Hill A.V. The Encyclopedia of Operations Management: A Field Manual and Glossary of Operations Management Terms and Concepts
Подождите немного. Документ загружается.


ptg6843605
green manufacturing – greenfield
The Encyclopedia of Operations Management Page 156
green manufacturing – Manufacturing that is environmentally conscious and ideally more profitable; closely
related to “sustainability.”
The number of computers and other electronic devices on our planet appears to be increasing according to
Moore’s Law and are having a negative impact on our environment. According to Greenpeace, demand for new
technology creates 4,000 tons of waste an hour, which often ends up in large piles in India, Africa, and China.
With take-back programs, customers return used technology to manufacturers that recycle the parts for new
products. Many European nations have legal requirements for return logistics. The U.S. has few such laws, but
many firms are voluntarily implementing such programs. For example, in 2004, Dell Computer recovered
40,000 tons of unwanted equipment for recycling, up 93% from 2005.
Ideally, organizations can improve the environment and improve their profits at the same time. Here are
several good examples adapted from the article www.fastcompany.com/magazine/120/50-ways-to-green-your-
business.html (October 25, 2007):
General Mills – In the past two years, General Mills has turned its solid waste into profits. Take its oat
hulls, a Cheerios by-product. The company used to pay to have them hauled off, but realized they could be
burned as fuel. Now customers compete to buy the waste. In 2006, General Mills recycled 86% of its solid
waste, earning more selling the waste than it spent on disposal. In 2006, General Mills redesigned packaging
and shaved off 20% of the paperboard box without shrinking contents. The result was 500 fewer distribution
trucks on the road each year.
General Electric – Trains were already the cleanest way to move massive amounts of freight long distances,
but General Electric raised the game with its Evolution locomotives, diesel engines launched in 2005 that cut
fuel consumption by 5% and emissions by 40% compared to locomotives built just a year earlier. GE has
plans for a GE hybrid diesel-electric locomotive that captures energy from braking (like the Toyota Prius)
and improves mileage by another 10%. According to GE, the energy dissipated in braking a 207-ton
locomotive during the course of a year is enough to power 160 homes for the same period.
Walmart – Walmart is providing funding to the biggest truck manufacturers (ArvinMeritor, Eaton,
International, and Peterbilt) to develop the first heavy-duty diesel-hybrid 18-wheeler. Walmart has pushed
the liquid-laundry-detergent industry to cut bottle sizes by 50% or more by concentrating the liquid. Thus,
Unilever’s triple-concentrated All Small & Mighty detergent has saved 1.3 million gallons of diesel fuel, 10-
million pounds of plastic resin, and 80 million square feet of cardboard since 2005. This fall, Procter &
Gamble is converting its entire collection of liquids to double concentration.
C3 Presents – Austin-based concert promoter C3 Presents made news when it banned Styrofoam cups from
the sixth annual Austin City Limits Music Festival. Following the model the company created for
Lollapalooza, C3 took a holistic approach to greening nearly every aspect of ACL, from bamboo-based
concert T-shirts to gel sanitizer in the bathrooms to bio-diesel power generators.
Philadelphia Eagles – Starting in 2006, the team’s “Go Green” environmental campaign has its stadium
cleaning crew making two full sweeps after each game, one to pick up recyclables and another for trash.
Tesco – Some retailers have introduced product labels that encourage customers to weigh their carbon. The
British grocery giant Tesco has a program to label all 70,000 of its products with carbon breakdowns.
Unilever – Unilever has reconfigured the plastic bottles for its billion-dollar Suave shampoo brand, saving
the plastic equivalent of about 15 million bottles a year.
The concept of the “green supply chain” extends green manufacturing concepts to the entire supply chain.
Using green supply chain concepts, organizations find ways to reduce emissions, avoid toxic wastes, reduce total
waste, improve energy efficiency, and otherwise improve their impact on the environment.
See cap and trade, carbon footprint, energy audit, Moore’s Law, remanufacturing, reverse logistics,
sustainability, triple bottom line.
green supply chain – See green manufacturing.
greenfield – The concept of building a new plant (or other facility) in a new location, which is often a field with no
existing buildings on it.
This is often an opportunity for the firm to start with a fresh perspective on facility layout, process
technology, and organization. In contrast, older facilities and land are sometimes called brownfields. These are

ptg6843605
gross profit margin − half-life curve
Page 157 The Encyclopedia of Operations Management
often abandoned, idled, or under-used industrial or commercial facilities. Some brownfield locations also have
problems with industrial contamination.
See facility location.
gross profit margin – An ambiguous term that relates gross profit to sales, measured as (1) a dollar amount (i.e.,
revenue less cost of goods sold), or (2) a percentage (i.e., 100(gross profit margin in dollars)/revenue); also called
gross margin.
The first definition is the margin in dollars, while the second definition is the margin as a percentage. The
second definition is sometimes called the gross margin percentage.
See cost of goods sold.
gross requirement – The total demand for an item, including both independent and dependent demand.
Unlike the gross requirement, the net requirements consider both on-hand inventory and open orders.
See Materials Requirements Planning (MRP).
gross weight – (1) Packaging context: The total weight of a package (including packaging) and its contents. (2)
Shipping/logistics context: The total weight of a vehicle and its contents.
See logistics, net weight, tare weight.
group technology – (1) A methodology for classifying parts (items) based on similar production processes and
required resources. (2) A manufacturing cell (cluster of machines, equipment, and workers) dedicated to making
a set of parts that share similar routings.
See Computer Aided Design (CAD), cellular manufacturing.
groupware – Software that helps groups of people work together on a common task; also called workgroup support
systems, group support systems, and workflow software.
Groupware supports communication, collaboration, and coordination and therefore can help improve
productivity of people working in groups. Groupware functionality can include e-mail, group calendars, address
books, video conferencing, audio conferencing, shared documents, shared databases, and task scheduling.
Groupware is particularly helpful when the workers are not all in the same location. Friedman (2005)
emphasized the importance of groupware (workflow software) in enabling firms to outsource.
See Decision Support System (DSS), outsourcing, project management.
Growth-Share Matrix – See cash cow.
GTD – See Getting Things Done (GTD).
H
HACCP – See Hazard Analysis & Critical Point Control (HACCP).
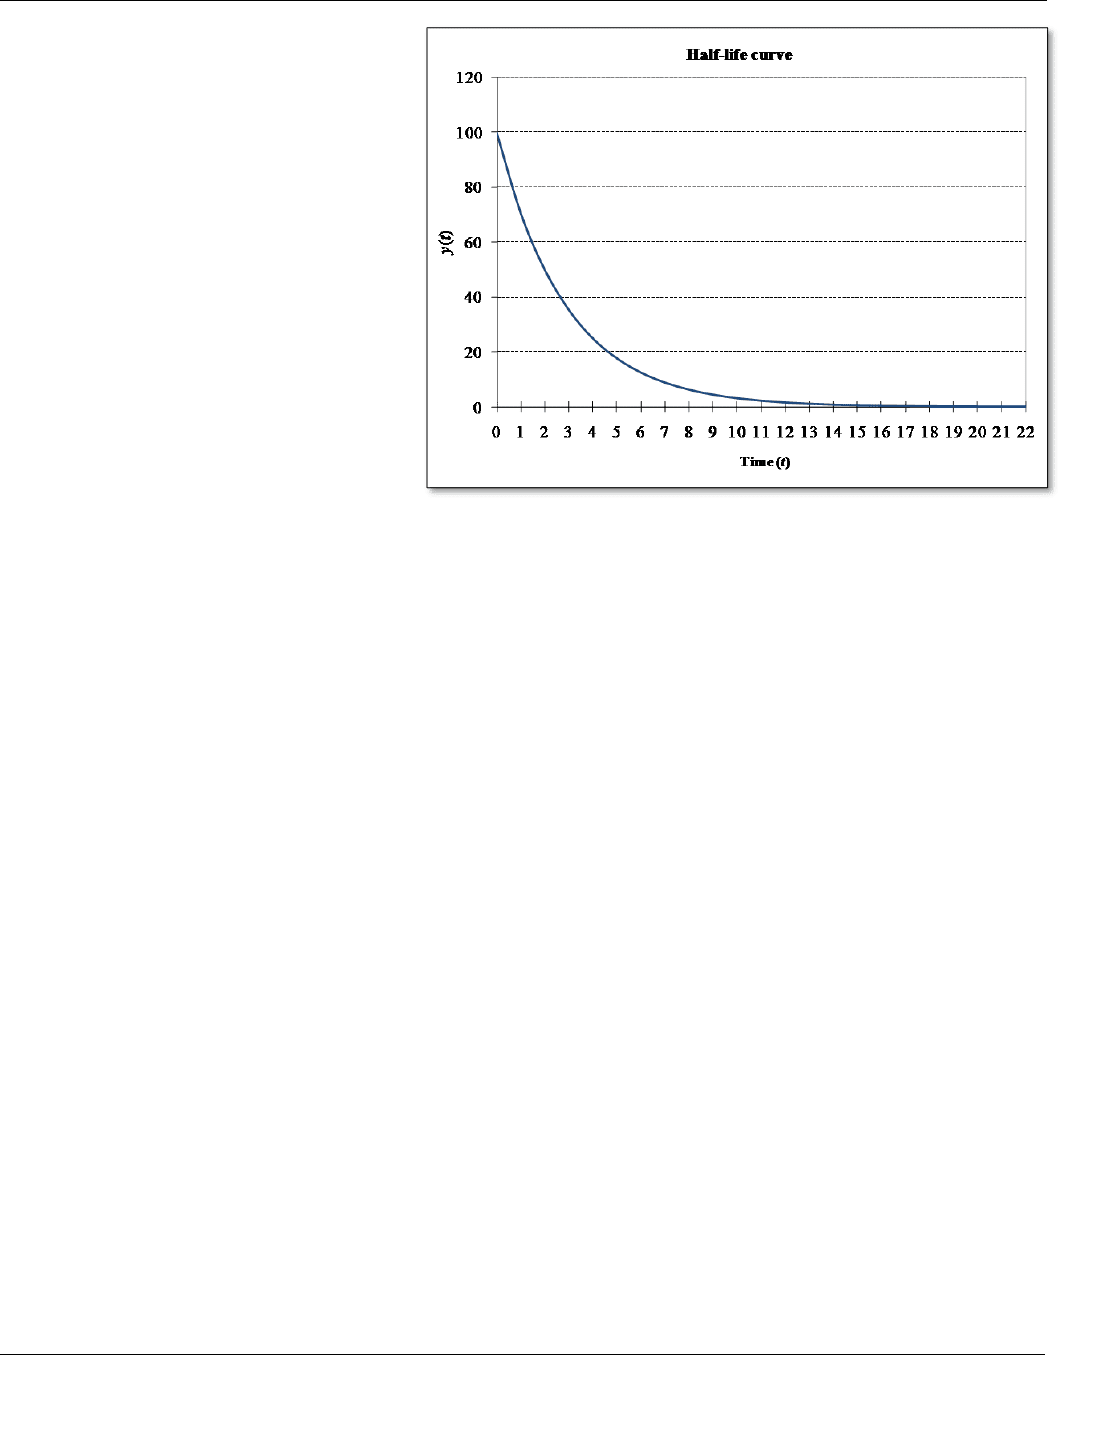
half-life curve – A mathematical model that shows the relationship between a performance measure (such as
defects) and the time required to reduce (cut) the performance measure in half.
The half-life curve was popularized by Ray Stata, founder of Analog Devices, Inc. (Stata 1989). Whereas
the learning curve assumes that learning is driven by production volume, the half-life curve assumes that learning
is driven by time. The half-life concept suggests that the performance measure will be cut in half every h
periods, where h is a constant. For example, if the unit cost at time zero is $100 and the half-life is six months,
the unit cost will be $50 at six months, $25 at 12 months, and so forth.
Any performance variable with an ideal point of zero can be used in this model. For example, the
performance variable could be cost/unit, time/unit, defects, cycle time, percent on-time delivery, etc.
The basic equation for the half-life curve is
( )
bt
y t ae
, where e ≈ 2.718281. The performance variable y(t)
is the performance at time t. The constants are
(0)a y
and ln(2) /b h
, where the half-life (in periods) is
ln(2) /h b . For example, if the half-life is 6 months, and the defect rate is 10% at time zero, at month 6 the
defect rate should be 5%, and at month 12 the defect rate should be 2.5%.
The graph below is an example of a half-life curve with parameters h = 2, y(0) = 100, and b = −0.347. Note
that unlike the learning curve, the half-life curve is continuous and is defined for all values of t.
ptg6843605
handoff
–
Hazard Analysis & Critical Point Control (HACCP)
The Encyclopedia of Operations Management Page 158
The easiest way to estimate b is to find
the value that fits the first and last
historical points ln( ( ) / (0)) /b y t y t . A
more accurate (but more complicated)
approach for estimating b is to apply linear
regression on transformed historical data.
To apply linear regression, take the natural
log transform of both sides of the half-life
equation to find ln( ( )) ln( )y t a bt , use
linear regression to estimate the ln(a) and
b parameters, and then use the model to
estimate the performance variable at some
time t in the future. Use the equation
ln(2) /h b to estimate the half-life from
the b parameter. This regression approach
will not work if any y(t) is zero and is also
adversely affected by autocorrelation in
the data.
See learning curve, learning
organization, linear regression, Moore’s Law, operations performance metrics.
handoff – A point in a process where work or information is transferred from one individual or organization to
another; also written hand-off.
From a lean manufacturing perspective, handoffs can lead to waste because each handoff has the potential to
lose information and create a queue of materials waiting to be picked up. Reducing the number of handoffs will
usually reduce the amount of information that is lost, reduce the number of queues, and reduce queue time, which
results in better quality, service, and cycle time.
Handoffs can also present problems because the reward systems in different organizations and for different
people might not be the same. For example, in a service organization, the customer-facing organization is
usually rewarded based on customer satisfaction, but the back-office organization might be rewarded based on
efficiency. Work enlargement seeks to combine these jobs into one job so that proper trade-offs can be made
between customer service and efficiency.
See addition principle, cellular manufacturing, focused factory, job enlargement, process map, service
quality, single point of contact.
hard currency – A freely convertible currency that is not expected to depreciate in value in the foreseeable future.
Hawthorne Effect – The concept that the act of showing attention to workers encourages better job performance.
The Hawthorne Studies (experiments) were conducted from 1927 to 1932 at the Western Electric Hawthorne
Works in Chicago, where Harvard Business School professor Elton Mayo examined the relationships between
work conditions and productivity. Mayo wanted to study the effects of fatigue and monotony on productivity
and how rest breaks, work hours, temperature, and humidity affected productivity. In the process, Mayo
stumbled upon the concept that the mere act of showing concern for people often spurs them on to better job
performance. (Note: Several different interpretations of the Hawthorne Effect can be found in the literature.)
For example, if the leadership of an organization gives management training to a new employee, the
employee will feel valued and will likely be motivated to work harder. The motivation is independent of the
particular skills or knowledge gained from the training. This is the Hawthorne Effect at work.
The Hawthorne Effect has been called the “Somebody Upstairs Cares Syndrome.” To generalize the
concept, when people have a sense of belonging and being part of a team, they are more productive.
See human resources, job design.
Hazard Analysis & Critical Point Control (HACCP) – Regulations issued by the U.S. Food and Drug
Administration (FDA) to drive standardization in food safety.

ptg6843605
hazmat
−
heijunka
Page 159 The Encyclopedia of Operations Management
Concepts center on building quality into food manufacturing processes rather than relying only on
inspections and sampling. HACCP involves seven principles:
1. Analyze hazards
– Identify potential hazards associated with a food and establish measures to control those
hazards. The hazard could be biological (e.g., microbes), chemical (e.g., toxin), or physical (e.g., ground
glass or metal fragments).
2. Identify critical control points
– These are points in food production from the raw state through processing
and shipping to consumption by the consumer at which the potential hazard can be controlled or eliminated.
Examples are cooking, cooling, packaging, and metal detection.
3. Establish preventive measures with critical limits for each control point
– For a cooked food, for
example, this might include setting the minimum cooking temperature and time required to ensure the
elimination of any harmful microbes.
4. Establish procedures to monitor the critical control points
– Such procedures might include determining
how and by whom cooking time and temperature should be monitored.
5. Establish corrective actions to be taken when monitoring shows that a critical limit has not been met
–
For example, food should be reprocessed or disposed if the minimum cooking temperature is not met.
6. Establish procedures to verify that the system is working properly
– For example, testing time and
temperature recording devices should be used to verify that a cooking unit is working properly.
7. Establish effective recordkeeping to document the HACCP system
– This includes records of hazards
and their control methods, the monitoring of safety requirements, and actions taken to correct potential
problems.
See error proofing, Failure Mode and Effects Analysis (FMEA), hazmat, sustainability.
hazmat – A hazardous material; also called HAZMAT and dangerous goods.
Hazmat or HAZMAT is any solid, liquid, or gas that can harm people, other living organisms, property, or
the environment. The term “hazardous material” is used in this context almost exclusively in the U.S. The
equivalent term in the rest of the English-speaking world is dangerous goods. A hazardous material may be
radioactive, flammable, explosive, toxic, corrosive, biohazardous, oxidizing, asphyxiating, or allergenic, or it
may have other characteristics that make it hazardous in specific circumstances (source:
http://en.wikipedia.org/wiki/HAZMAT, October 1, 2006).
See Hazard Analysis & Critical Point Control (HACCP), sustainability.
headhaul – A carrier’s primary trip, bringing a shipment to its destination.
See logistics.
hedging – Any transaction designed to reduce financial risk.
Hedging usually deals with reducing the risk of loss from price fluctuations. Hedging is usually done for
defensive purposes. It is often a combination of “bets” (transactions) such that if one bet loses, another wins (i.e.,
taking two positions that will offset each other if prices change). In operations, hedging is commonly used to
reduce the risk of a price increase for raw materials. For example, Southwest Airlines, the only major airline to
remain consistently profitable shortly after the 9/11 tragedy in 2001, used a hedging strategy that allowed it to
buy jet fuel for 38% less than the market price (Schlangenstein 2005). Unlike arbitrage, a hedge does not carry
the implication of having an edge. Note that the word “hedge” can be used as a noun or a verb.
See arbitrage.
heijunka – A Japanese technique used to smooth production over time; also called load leveling,
linearity, and stabilizing the schedule.
Dennis (2002) defined heijunka as “distribution of volume and mix evenly over time.”
The Japanese word heijunka (pronounced “hey-june-kah”) literally means to “make flat and
level.” Taiichi Ohno (1978) at Toyota defined heijunka as
production leveling
. Heijunka is considered one of
the main pillars of the Toyota Production System (TPS) and is closely related to lean production. It is very
similar to the concepts of production smoothing and load leveling. The following is a simple example of
production smoothing.

ptg6843605
heijunka box – heuristic
The Encyclopedia of Operations Management Page 160
Week Demand Weekly production
1 900 500
2 200
Average = 500 units/week
500
3 700 500
4 200 500
5 500
550
6 500
Average = 550 units/week
550
7 400 550
8 800 550
One of the main concepts for smoothing production is frequent changes of the model mix to be run on a
given line. Instead of running large batches of one model after another, TPS advocates small batches of many
models over short periods of time. This is called mixed model assembly. This requires quick changeovers, but
results in smaller lots of finished goods that are shipped frequently.
The main tool for heijunka is a visual scheduling board known as a heijunka box, which is generally a wall
schedule with rows dedicated to each product (or product family) and columns for each time period (e.g., 20-
minute periods). Colored production control kanban cards representing individual jobs are placed in the slots in
proportion to the number of items to be built of a given product type during a time interval. The heijunka box
makes it easy to see what types of jobs are queued for production. Workers remove the kanban cards from the
front of the schedule as they process the jobs.
The heijunka box consistently levels demand by short time increments (20 minutes in this example). This is
in contrast to the mass-production practice of releasing work for one shift, one day, or even a week to the
production floor. Similarly, the heijunka box consistently levels demand by mix. For example, it ensures that
Product C and Product D are produced in a steady ratio in small batch sizes.
Production process stability introduced by leveling makes it considerably easier to introduce lean techniques
ranging from standard work to continuous flow cells. Muda (waste) declines as mura (unevenness in
productivity and quality) and muri (overburden of machines, managers, and production associates) decline.
When processes are leveled in volume and mix, employees are no longer overburdened, customers get better on-
time delivery, and manufacturers reduce cost when muda, mura, and muri are reduced.
Although production leveling tools can be used to level the load (hours of work for the factory), demand
management tools can be used to level the demand, which makes it easier to level the load.
See chase strategy, demand management, dispatching rules, job shop scheduling, kanban, lean thinking,
level strategy, load, load leveling, mixed model assembly, takt time.
heijunka box – See heijunka.
help desk – A resource that provides problem-solving advice for internal or external customers.
Corporations often provide help desk support to their customers via toll-free phone numbers, faxes, websites,
and e-mail. The help desk is often the part of a call center that handles support for technical products. Help desk
workers sometimes use decision support software and knowledge bases to answer questions.
See call center, fulfillment, knowledge management, service management.
Herbie – The bottleneck in a process.
The question, “Where’s your Herbie?” is asking, “Where is your bottleneck?” This is based on the popular
Goldratt Institute film and book entitled The Goal (Goldratt 1992), where one boy (Herbie) in the Boy Scout
troop slowed down the entire troop on a long march through the woods. The teaching point here was that
organizations need to “go find their Herbie and help him with his load.”
See bottleneck, Theory of Constraints (TOC).
heuristic – A simple rule of thumb (procedure) used to solve a problem.
For example, when a vehicle schedule is created, the next location selected for the vehicle might be the one
closest to the last one selected. This is called the “closest customer” heuristic. Heuristics often produce very
good and sometimes even the mathematically best (optimal) solutions. However, the problem with heuristics is
that users seldom know how far the heuristic solution is from the optimal solution. In other words, a heuristic
procedure might produce a good solution, but the solution is not guaranteed to be the optimal (best) solution. All

ptg6843605
hidden factory − hockey stick effect
Page 161 The Encyclopedia of Operations Management
heuristic procedures are said to be algorithms; however, not all algorithms are heuristics, because some
algorithms always guarantee an optimal (mathematically best) solution. For some heuristics, it is possible to
mathematically derive the “worst case” performance, the average case performance, or both.
See algorithm, genetic algorithm, operations research (OR), optimization, simulated annealing, Traveling
Salesperson Problem (TSP).
hidden factory – A term for either rework or non-value-adding transactions in a system.
Rework – Armand Feigenbaum, a well-known quality expert, coined the term “hidden factory” to describe
the vast amount of work needed to correct the mistakes made by others. He estimated that the hidden factory
might be as much as 40% of the total cost (Feigenbaum 2004).
Non-value-added transactions – Miller and Vollmann (1985) identified a different type of “hidden factory”
that processed vast numbers of internal transactions that added little or no value to customers. This is often true
when a firm reduces lotsizes to move toward lean production without using visual control systems.
Eliminating both types of hidden factories (waste) is a key part of lean thinking.
See Activity Based Costing (ABC), lean thinking, rework, yield.
High Performance Work Systems (HPWS) – A form of workgroup that typically emphasizes high employee
involvement, empowerment, and self-management.
HPWS generally incorporate the following features:
• More job complexity, multi-tasking, and
multi-skilling.
• Increased employee qualifications.
• Ongoing skill formation through enterprise
training.
• A minimum of hierarchy.
• Greater horizontal communication and
distribution of responsibility (often through
teams).
• Compensation incentives for performance and
skill acquisition.
• Increased focus on “core activities.”
Firms that use HPWS often seek to improve organization performance through six synergistic strategies:
• Leadership that empowers others.
• Relentless focus on strategy and results.
• Open sharing of relevant information.
• Borderless sharing of power.
• Team-based design.
• Teamwork reinforced through rewards.
Unfortunately, the definition of HPWS is ambiguous, and practices vary widely between firms. HPWS is
closely related to employee involvement, employee empowerment, high involvement, people involvement, high
commitment systems, mutual gains enterprises, socio-technical systems, participative management, self-
management, boss-less systems, self-directed work teams, and empowered work teams.
Adapted from a contribution by Aleksandar Kolekeski, ISPPI Institute, Skopje, Macedonia,
kolekeski@msn.com, September 19, 2005.
See empowerment, human resources, job design, New Product Development (NPD), organizational design,
productivity, self-directed work team.
histogram – A graphical approach for displaying frequency data as a bar chart.
Histograms can be shown vertically or horizontally. The histogram is one of the seven tools of quality. See
the Pareto Chart entry to see an example of a vertical histogram.
See bar chart, Pareto Chart, seven tools of quality.
hockey stick effect – A pattern of sales or shipments that increase dramatically at the end of the week, month, or
quarter.
This pattern looks like a hockey stick because it is low at the beginning of the period and high at the end.
The hockey stick effect is nearly always a logical result of reward systems based on sales or shipments. The
large changes cause variance in the system, which often results in increased inventories, stockouts, overtime, idle
capacity, frustrated workers, and other significant problems. Clearly, the best solution is to change the reward
system to motivate workers to produce and sell at the market demand rate.
One creative potential solution is to have different sales regions with offset quarters so one region has a
quarter ending in January, another ending in February, etc. Another creative solution is to shorten the reporting
reward period from quarters to months or even weeks. This gives the organization less time to change between
the extreme priorities, and therefore provides motivation to avoid the hockey stick.
See carrying charge, carrying cost, production planning, seasonality.
ptg6843605
holding cost
–
hoshin planning
The Encyclopedia of Operations Management Page 162
holding cost – See carrying charge, carrying cost.
hoshin planning – A systematic planning methodology developed in Japan for setting goals and
aligning the organization to meet those goals; also called hoshin kanri and policy deployment.
Hoshin is short for “hoshin kanri.” The word “hoshin” is from “ho,” which means direction,
and “shin,” which means needle. Therefore, the word “hoshin” could translate into direction needle
or compass. The word “kanri” is from “kan,” which means control, and “ri,” which means reason
or logic. Taken altogether, hoshin kanri means management and control of the organization’s
direction needle or focus. Hoshin planning is like a management compass that points everyone in the
organization toward a common goal.
Hoshin kanri planning passes (deploys) policies and targets down the management hierarchy. At each level,
the policy is translated into policies, targets, and actions for the next level down. “Catchball” is played between
each level to ensure that the plans are well-understood and can be executed (see the entry catchball).
Hoshin operates at two levels: (1) the strategic planning level to define long-range objectives and (2) the
daily management level to address routine aspects of business operations.
Hoshin plans should be regularly reviewed against actual performance. This review can be organized in a
“hoshin review table,” which should show the owner, time frame, performance metrics, target, and results. Any
difference between the target and actual results should be explained. The review tables should cascade upward.
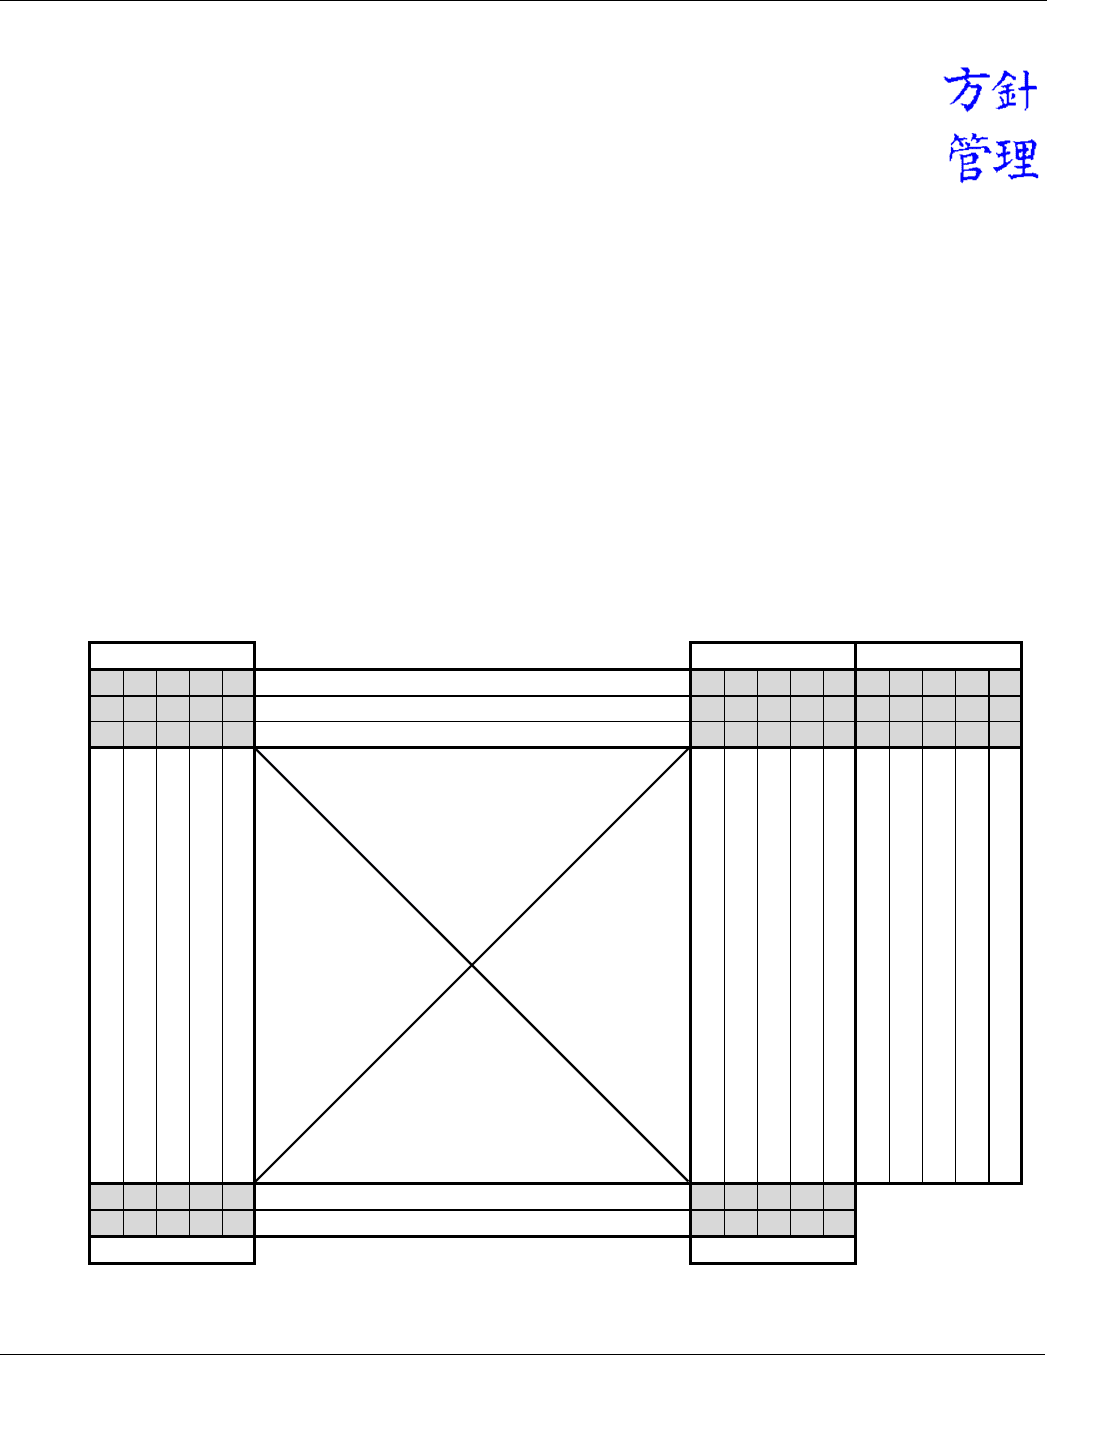
The
X-Matrix
, the main tool of hoshin planning, works backward from desired
results
, to
strategies
, to
tactics
, to
processes
. See the simple example below. The planning process begins with the results, which are
driven by strategies, which are driven by tactics, which are achieved by process improvements. The
“correlation” cells identify causal relationships using the symbols:
= strong relationship,
= important
relationship, and
= weak relationship. The accountability columns indicate roles and responsibilities for
individuals, teams, departments, and suppliers. See Jackson (2006) for more details.
The X-Matrix is similar to Management by Objectives (MBO), developed by Drucker (1954), except that it
focuses more on organizational rather than individual goals. The X-Matrix is also similar to the
strategy
Simple X-Matrix example
Conduct and implement s trategic s pend analys is .
Reduce s etup times by 50% at our bottleneck.
Accelerate our lean sigma program.
Increase sales to $51M for this year.
Reduce manufacturing cos t by $1.4M for this year.
So ur ce : P r o fe sso r
Arthur V. Hill
Industrial engineer
Correlation
Correlation
Correlation
Correlation
Accountability
Reduce total finished goods inventory $ by 20%.
Lean sigma champion
Plant manager
Lean sigma blackbelt
Purchasing
Identify and train 3 new lean sigma blackbelts.
Reduce total raw materials inventory $ by 25%.
Implement strategic setup reduction program.
Negotiate better supply leadtimes with key suppliers
.
Reduce average customer lead time by 15%.
Reduce average manufacturing cycle time by 20%.
STRATEGIES
PROCESS
TACTICS
RESULTS

ptg6843605
house of quality − hypergeometric distribution
Page 163 The Encyclopedia of Operations Management
mapping concepts developed by Kaplan and Norton (1990), the Y-tree concept used at 3M, and the causal
mapping tools as presented by Hill (2011c). A strategy map requires the causal linkages: learning & growth
internal customer financial. In contrast, the X-Matrix requires the causal linkages: process tactics
strategies results. In this author’s view, an X-Matrix is more general than a strategy map, a Y-tree is more
general than an X-Matrix, and a causal map is more general than a Y-tree. However, some industry experts
argue that hoshin planning is unlike other strategic planning methods because it has more accountability and
more “catchball” interaction between levels in the organization.
See alignment, balanced scorecard, catchball, causal map, lean thinking, Management by Objectives
(MBO), mission statement, PDCA (Plan-Do-Check-Act), strategy map, Y-tree.
house of quality – See Quality Function Deployment (QFD).
hub-and-spoke system – A distribution system used by railroads, motor carriers, and airlines to consolidate
passengers or shipments to maximize equipment efficiency.
Many passenger airlines in North America, such as Delta and United, have hub-and-spoke networks, where
the hub is a central airport and the spokes are the routes that bring passengers to and from the hub. In contrast,
the direct route (or point-to-point) system does not use a central hub airport. In North America, Southwest
Airlines is an example of a direct route system. The hub-and-spoke system is an important distribution strategy.
For example, FedEx, a delivery service, has a hub in Memphis, with all FedEx shipments going through this hub.
See consolidation, logistics.
human resources – (1) The employees in an organization. (2) The organizational unit (department) charged with
the responsibility of managing employee-related processes such as hiring, orientation, training, payroll, benefits,
compliance with government regulations, performance management (performance management, performance
reviews), employee relations, employee communications, and resource planning; sometimes called the personnel
organization; often abbreviated HR.
See absorptive capacity, addition principle, back office, business process outsourcing, cost center, cross-
training, delegation, division of labor, empowerment, Enterprise Resources Planning (ERP), ergonomics,
gainsharing, Hawthorne Effect, High Performance Work Systems (HPWS), job design, job enlargement, job
rotation, labor grade, lean sigma, learning curve, learning organization, multiplication principle, on-the-job
training (OJT), operations management (OM), organizational design, outsourcing, pay for skill, productivity,
RACI Matrix, Results-Only Work Environment (ROWE), scientific management, self-directed work team, Service
Profit Chain, service quality, standardized work, subtraction principle, unfair labor practice, value chain, work
measurement, work simplification, workforce agility.
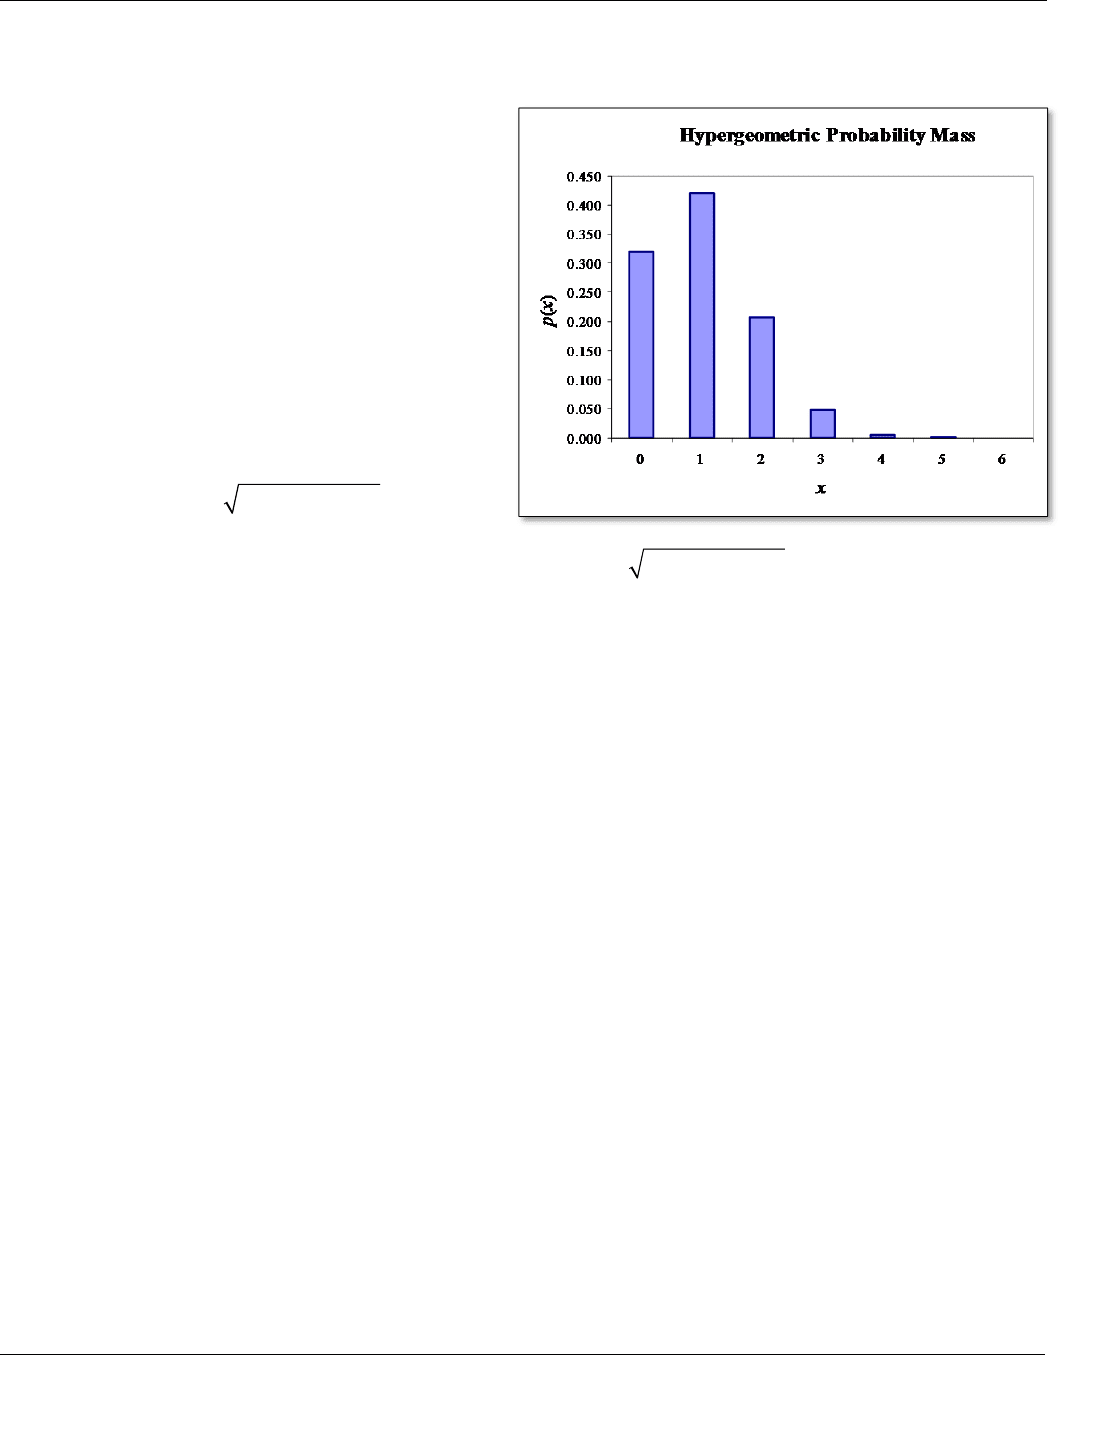
hypergeometric distribution – A discrete probability distribution widely used in quality control and auditing.
The hypergeometric distribution is useful for determining the probability of exactly x defective units found in
a random sample of n units drawn from a population of size N that actually contains m defective units. It is a
particularly useful distribution for acceptance sampling and auditing. The normal, Poisson, and binomial
distributions are often used as approximations for the hypergeometric distribution.
The hypergeometric distribution can be used to create confidence limits on the number of errors in a
population based on a sample. For example, an auditor can take a sample and then conclude with a 95%
confidence level that the true percentage of errors in the population is no more than p percent. The auditor can
also use this distribution to estimate the sample size required to achieve a desired confidence limit. Most
statistics textbooks recommend using the normal distribution for the proportion defective; however, this is an
approximation for the hypergeometric distribution and will be inaccurate when the error rate is small.
Parameters: Population size N and sample size n.
Probability mass function:
( ) ( , , , )
m N m N
P X x p x N n m
x
n x n
, where x is the number of
successes in the sample, n is the sample size, m is the number of successes in the population, and N is the size of
the population. The distribution function is simply the summation of the mass function.
Statistics: Range [a,b] where max(0, ( ))a n N m
and min( , )b m n
, mean πn, variance
(1 ) ( ) / ( 1)n N n N
, where π = m/N. The mode has no closed form.
ptg6843605
hypothesis
–
ideation
The Encyclopedia of Operations Management Page 164
Graph:
A jar has a population of N = 100 balls, with m = 20 red balls and (N – m) = 80 white balls.
Samples of n = 5 balls are drawn randomly from the jar. The graph below is the hypergeometric probability
mass function for x, which is the number of red balls found in a sample.
Excel:
In Excel, the probability mass function is
HYPGEOMDIST(x, n, m, N), where x is the number
of successes in the sample, n is the size of the
sample, m is the number of successes in the
population, and N is the size of the population. Excel
does not have distribution or inverse functions for the
hypergeometric distribution. The natural log of the
gamma function (GAMMALN(x)) is useful for
software implementation of this distribution. In
Excel 2010, HYPGEOMDIST has been replaced by
HYPGEOM.DIST, but still uses the same arguments.
Relationships with other distributions:
The
standard deviation for the hypergeometric
distribution is equal to that of the binomial
distribution times the finite population correction
factor (i.e.,
( ) / ( 1)
h b
N n N
). Therefore,
when the population size N is large compared to the
sample size (i.e.,
N n
), the correction factor is close to 1 (i.e.,
( ) / ( 1) 1N n N
) and the hypergeometric
distribution can be approximated reasonably well with a binomial distribution with parameters n (number of
trials) and /p m N . A reasonable rule of thumb is that the hypergeometric distribution may be approximated
by the binomial when
/ 20N n
. (The binomial differs from the hypergeometric distribution in that sampling is
done with replacement.) The Poisson distribution is often used as an approximation for the hypergeometric in
the auditing profession. The normal distribution can be used as an approximation for the hypergeometric when
/ 50N n
and
(1 ) 10np p
.
See binomial distribution, gamma function, Poisson distribution, probability distribution, probability mass
function, sampling, Statistical Quality Control (SQC).
hypothesis – In the operations management context, a suggested explanation for a problem; a statement of what
could be true; a proposition for how a problem might be solved.
A hypothesis consists of a statement of what could be true, often with some accompanied explanation and
justification. A hypothesis requires more work by the investigator to attempt to disprove it. When attempting to
address an operations problem, the best consultants work with their clients to quickly generate a large number of
hypotheses about how the problem might be solved. Much of the remainder of the consulting engagement is then
dedicated to testing if the hypotheses are true.
Most scientists require that a hypothesis be falsifiable, which means that it is possible to test if the statement
is false. Failing to falsify a hypothesis does not prove that the hypothesis is true. A hypothesis cannot ever be
accepted or confirmed because no human will ever have infinite knowledge. However, after a hypothesis has
been rigorously tested and not falsified, it may form the basis for theory and for reasonable action.
See issue tree, Minto Pyramid Principle, strategy map.
I
I2 – A software vendor of Advanced Planning and Scheduling (APS) systems.
See Advanced Planning and Scheduling (APS).
ideation – A group brainstorming process that seeks to generate innovative thinking for new product development
from of a group of people.

ptg6843605
IDOV
−
implementation
Page 165 The Encyclopedia of Operations Management
According to Graham and Bachmann (2004), ideation is done in the conceptual phase (the fuzzy front end)
of the design process. Ideation has strict disciplines but allows for free-wheeling imagination. The process
identifies the specific issue in need of rethinking, rethinks it in a fresh way, and evaluates the practical
advisability of the resulting ideas.
See brainstorming, causal map, Kano Analysis, New Product Development (NPD), Nominal Group
Technique (NGT), TRIZ.
IDOV – See Design for Six Sigma (DFSS), lean sigma.
IIE – See Institute of Industrial Engineers.
impact wheel – A graphical brainstorming tool that can be used to help a group identify and address the effects of a
decision, action, or potential event.
An impact wheel exercise is a causal mapping exercise that seeks to identify the impact of an event. In some
sense, the impact wheel is the opposite of a Root Cause Analysis (RCA) because a RCA seeks to identify factors
that caused an event, whereas the impact wheel seeks to identify the effects that will be caused by an event.
The impact wheel is a simple structured brainstorming approach designed to help managers fully explore the
potential consequences of specific events and decisions. The impact wheel can help managers uncover and
manage unexpected and unintended consequences of a decision. It is a powerful tool for exploring the future that
will be created by decisions made today.
The impact wheel process begins with the facilitator writing down the name for a change (event or decision)
on a Post-it Note and placing it on the wall. The facilitator then engages the participants in a discussion of (1)
the “impacts” extending out from the change (drawn like the spokes of a wheel), (2) the likelihood for each
impact, and (3) implications of each impact (costs, benefits). The group then focuses on each of the critical
impacts and repeats the process around each one. This approach can be supported by environmental scanning (to
consider external issues), scenario development (to consider best-case, worst-case, status-quo, and wild-card
scenarios), and expert interviews (to gain insights from subject matter experts). More detailed risk analysis
might follow with a formal Failure Mode and
Effects Analysis (FMEA) for each impact.
The figure on the right is a simple example of
an impact wheel in a bank that is considering
adding more workers. The first round identified
“more difficult scheduling” as one impact of hiring
more workers. The second round further identified
the need to buy new software and hire a new
scheduler.
See 5 Whys, brainstorming, causal map,
Failure Mode and Effects Analysis (FMEA), issue
tree, lean sigma, Nominal Group Technique (NGT),
Root Cause Analysis (RCA).
implementation – The process of turning a plan into reality.
The term “implementation” is often used in the context of setting up a new computer-based information
system (e.g., an ERP system), implementation of a new program or policy in an organization (e.g., a process
improvement program), or converting the conceptual design for a computer code into the actual computer code.
Implementions that require major changes often require strong leadership and cross-disciplinary project teams.
In the systems context, a number of implementation approaches are discussed in practice:
•
Full cutover
– The old system is turned off and the new system is turned on at the same time. As a joke, this
is sometimes called “cold turkey.”
•
Phased cutover
– Functions are tested and turned on sequentially.
•
Parallel
– The organization runs both the old and new systems at the same time to compare performance.
This approach is not practical when the systems require decisions to be made or when a significant amount of
manual data entry is required.
•
Conference room pilot
– The organization creates a realistic test database and then uses it to test the system
and train users before the system is implemented. A pilot can be used with any of the above approaches.
Add more
workers
Increased
overhead
Improved
service
Difficult
scheduling
Increased
labor cost
Need new
software
Need new
scheduler
Impact wheel
example
Source: Professor Arthur V. Hill