Kothari D.P., Nagrath I.J. Modern Power Systems Analysis
Подождите немного. Документ загружается.

\4gqe!_lg',gf
tyq]g1_
Analysis
Power
System Stability
|
505;
I
0.40 l.s
0.998
1.5
-
0.5
-
2.7
0.45 1.5 1.0 1.5
-
0.5
-
2.7
0.50 1.5
1.0 1.5
-
0.s
-
2.7
-
2.6
89.5
0.55 1.5
0.9985
1.5
-
0.5
-2.7
86.9
2.8
86.6
0.1
89.4
r
I
,r
l--,r-
r
]...r
r
o'5
1.0
Time
(sec)
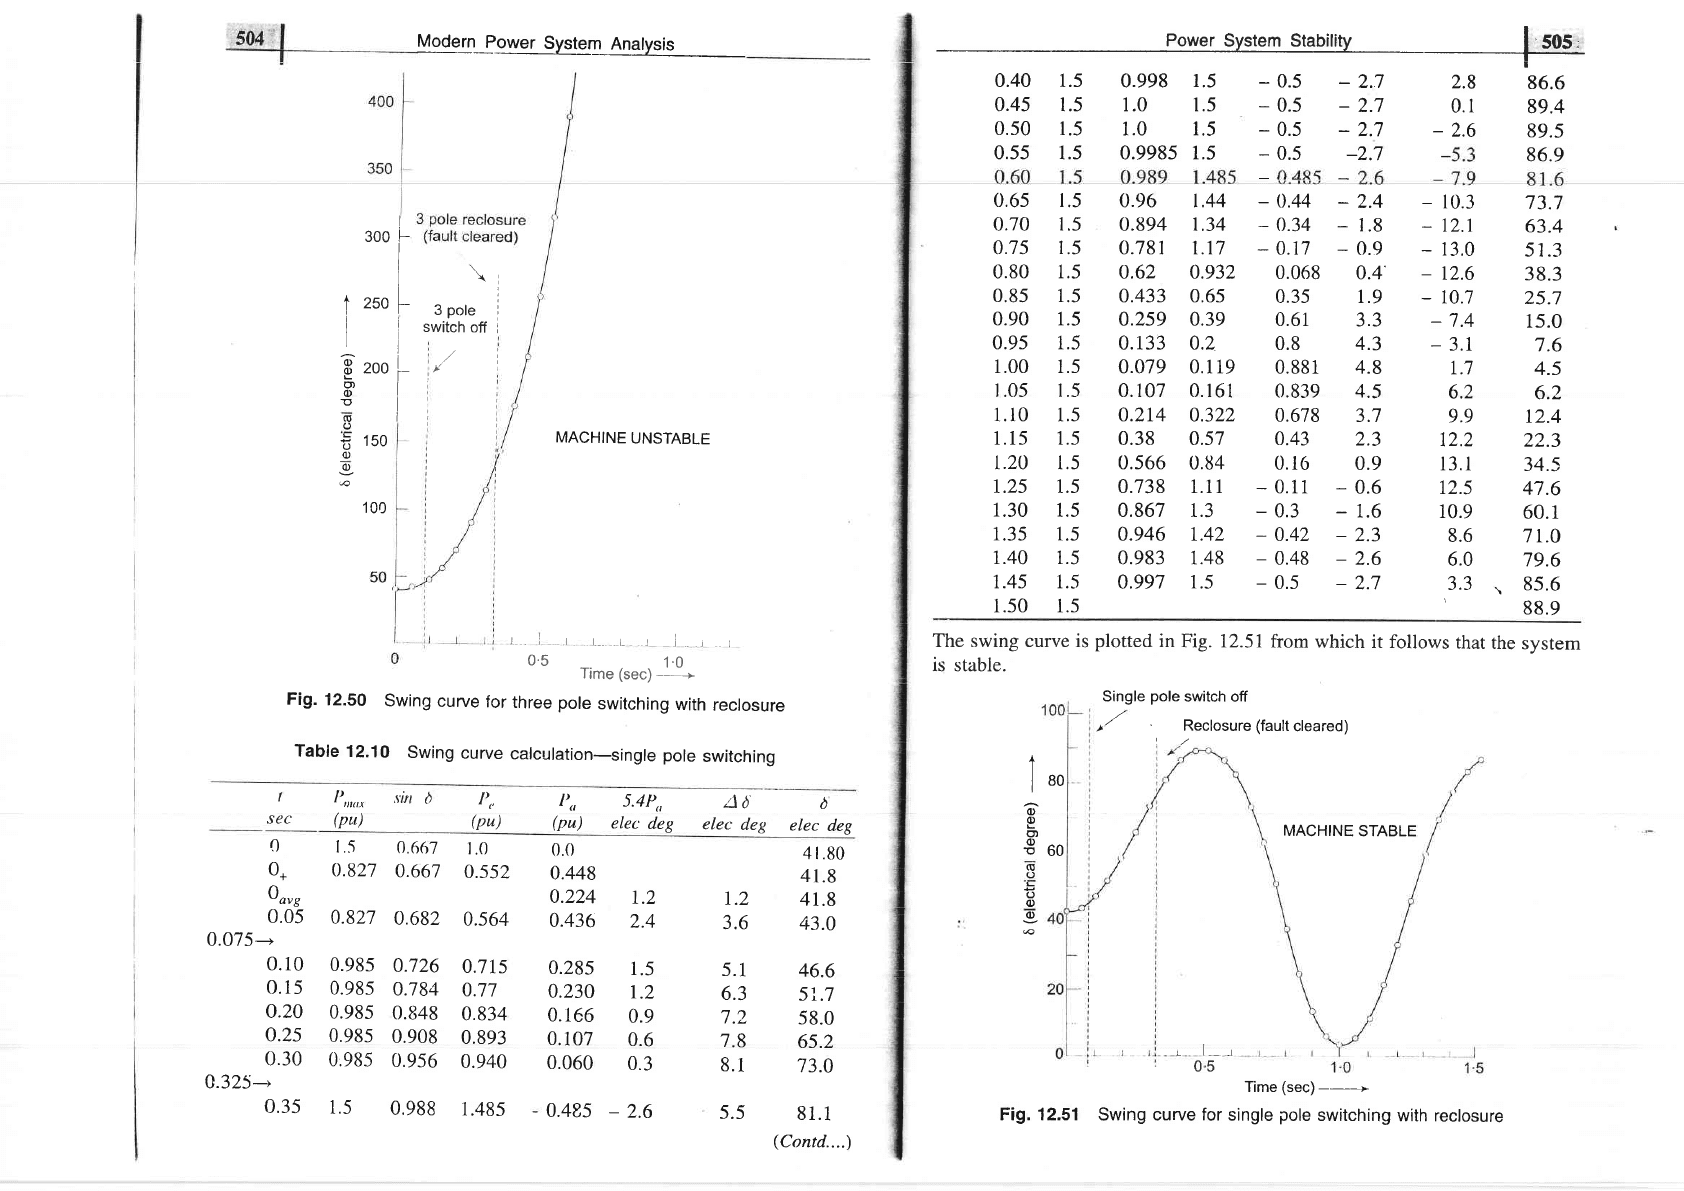
Fig.
12.50
swing
curue
for
three
pole
switching
with
reclosure
Table
12.10
swing
curve
calculation-single
pole
switching
-
10.3
73.7
-
12.r
63.4
-
13.0
51.3
-
12.6
38.3
-
10.7
25.7
-
7.4
15.0
-
3.r
7.6
1.7
4.5
6.2
6.2
9.9 r2.4
12.2
22.3
l3.l
34.5
12.5
47.6
10.9
60.1
8.6
7 r.O
6.0
79.6
3.3
\
95.6
'
gg.g
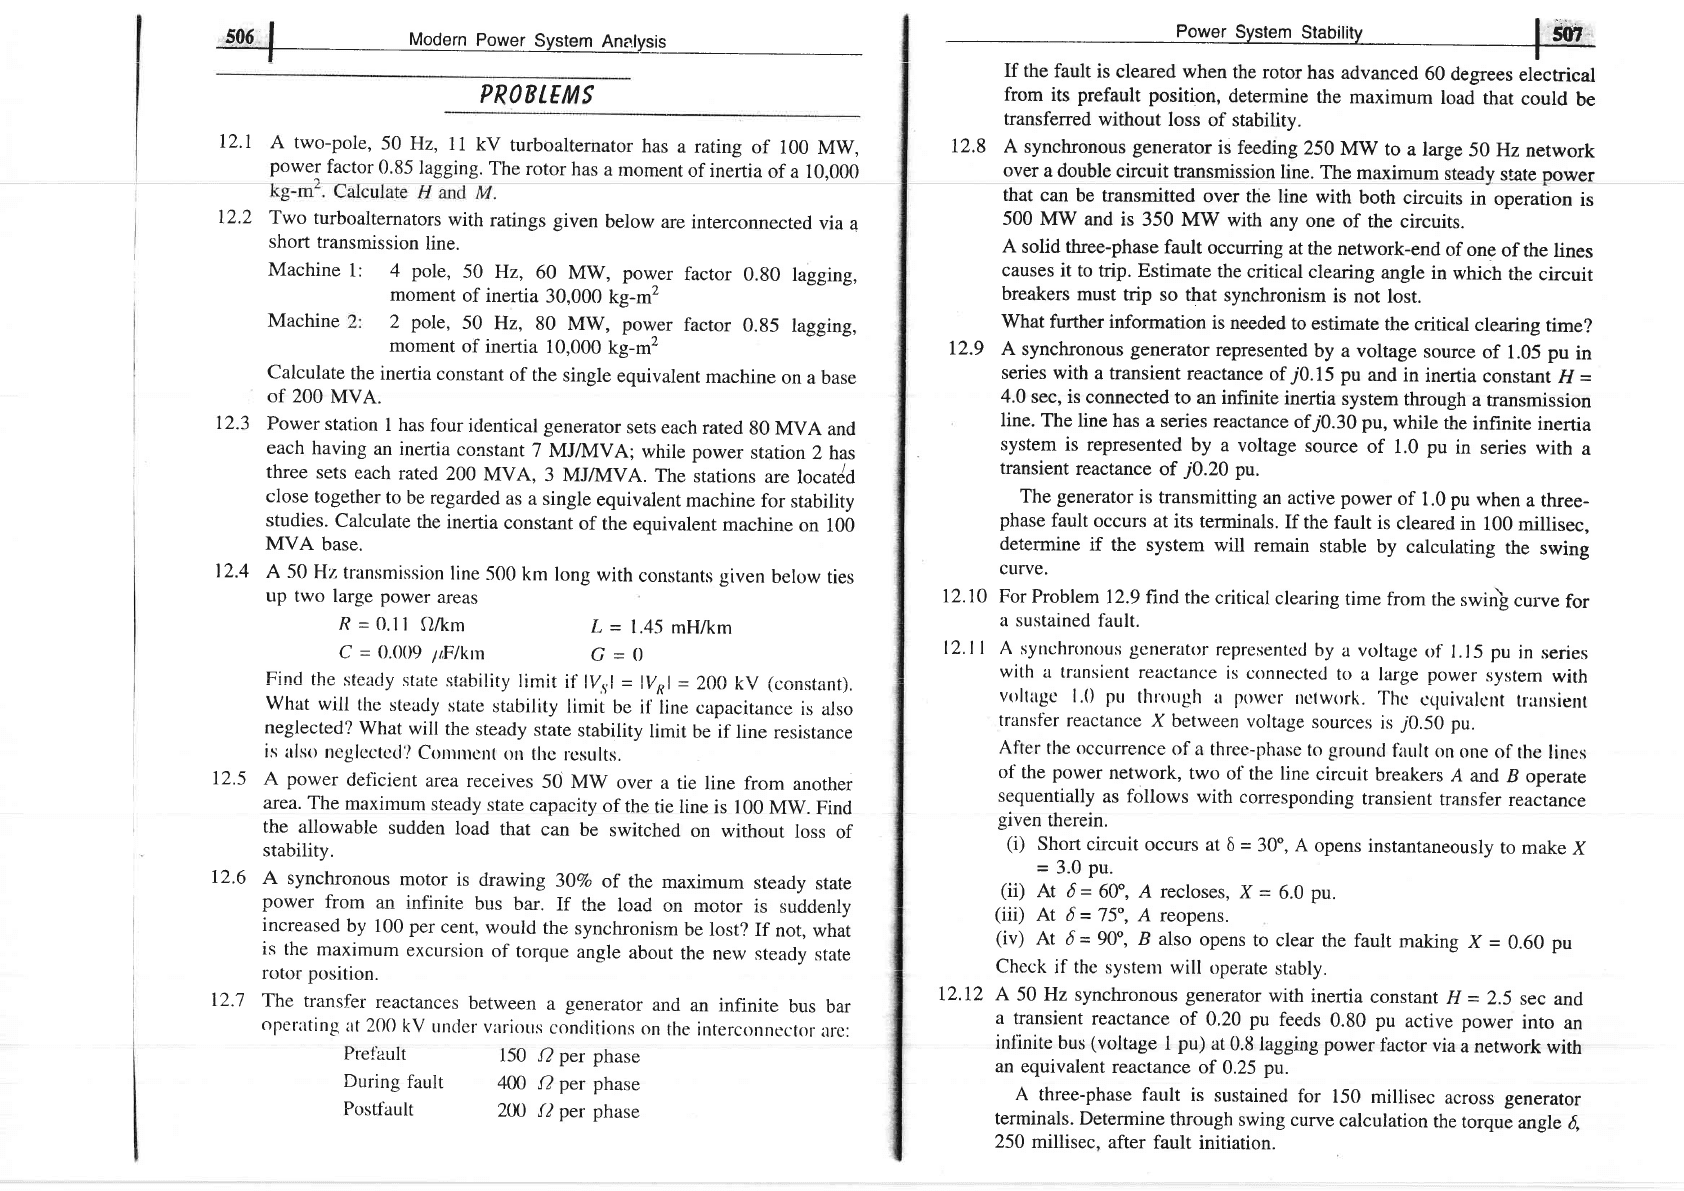
The swing curve is
plotted
in
Fig. 12.51from
which
it follows
that
the
sysrem
is stable.
Single
pole
switch off
/'/'
Reclosure
(fault
cleared)
|'/
i- l--r
05
Time
(sec)
Fig. 12.51
Swing curve
for
single
pole
switching
with reclosure
I
300 !
I
I
250
I
i
2oo
i-
I
I
t
I
I
L
6
q)
g)
o
E
o
L
(.)
q)
J)
to
\
I
i
r
pote
i
switch
off
i
//l
MACHINE
UNSTABLE
0.65 1.5
0.70 1.5
0.75
1.5
0.80
1.5
0.85 1.5
0.90 1.5
0.95 1.5
1.00 1.5
r
.05
r.5
1.10 1.5
1.15 1.5
1.20 1.5
r.25 1.5
1.30
1.5
1.35 1.5
r.40 1.5
1.45 1.5
1.50 1.5
0.96 t.44
-
0.44
-
2.4
0.894 1.34
-0.34
-1.8
0.781 t.l1
-
0.17
-
0.9
0.62 0.932
0.068
0.4'
0.433 0.6s
0.35 r.9
0.2s9 0.39
0.61
3.3
0.133 0.2
0.8 4.3
0.079 0.119
0.881 4.8
0.107 0.161
0.839 4.5
0.214
0.322 0.678
3.7
0.38 0.57 0.43
2.3
0.566
0.84 0. 16
0.9
0.738 1.11
-
0.11
-
0.6
0.867 1.3
-
0.3
-
1.6
0.946 t.42
-
0.42
-
2.3
0.983 1.48
-
0.48
-
2.6
0.997
1.5
-
0.s
-
2.7
150
100
I
SEC
I',uu^
(pu)
,s:itt
h
BO
60
A
I
I
I
o)
o
o)
o)
o
C)
L
o
o
o)
ra
t,,,
(pu)
l'r,
5'4P,,
(pu)
elec
deg
Ab
elec
deg
b
elec
deg
0
o,
f
oory
0.05
0.075---
0.10
0.15
o.20
o.25
0.30
4325---+
0.35
1.5
0.661
1.0
0.827
0.667
0.s52
0.827
0.682
0.s64
0.0
0.448
0.224
1.2
0.436
2.4
0.285
1.5
0.230
r.2
0.166
0.9
0.107
0.6
0.060
0.3
0.485
-
2.6
4 t.80
41.8
r.2
41.8
3.6
43.0
5.1
46.6
6.3
5r.7
7.2
58.0
1.8
65.2
8.1
73.0
5.5
81.1
(Contd....)
0.98s
0.726
0.98s
0.784
0.985
0.848
0.98s
0.908
0.985
0.956
1.5
0.988
0.7Ls
0.77
0.834
0.893
0.940
1.485
MACHINE
STABLE
t2.l
t2.3
12.4
t2.5
12.6
t2.1
506
|
Modern
po@is
PROB
TEIlIS
A two-pole,
50 Hz,
11
kv
turboalternator
has
a
rating
of
100
Mw,
powel
factor
0.85
lagging.
The
rotor
has a
moment
of inertia
of
a 10,000
12.2
Two
turboalternators
with
ratings given
below
are interconnected
via
a
short
transmission
line.
Machine
1:
4
poIe,
50 Hz,
60
MW, power
factor
0.g0
moment
of inertia
30,000
kg-rn,
lagging,
Machine
2
pole,
50
Hz,
80
MW, power
factor
0.85
lagging,
moment
of
inertia
10,000
kg--'
Calculate
the
inertia
constant
of the
single
equivalent
machine
on
a base
of
200
MVA.
Power
station
t has
four
identical generator
sets
each
rated
g0
MVA
and
each
having
an
inertia
constant
7 MJA4VA;
while
power
station
2 has
three
sets
each
rated
200
MVA,
3 MJA4VA.
The
stations
are
locatld
close
together
to be
regarded
as
a single
equivalent
machine
for
stability
studies.
Calculate
the
inertia
constant
of
the
equivalent
machine
on
100
MVA
base.
A 50
Hz
transmission
line
500
km
long
with
constants given
below
ties
up
two
large
power
areas
I ina
from
its
prefault
position,
determine
the
maximum
load
that
could
be
transferred
without
loss
of stability.
I2.8
A synchronous generator
is
feeding
250
MW
to a large
5O
Hz network
over
a double
circuit
transmission
line.
The
maximum
steady
state
Dower
that
can be
transmitted
over the
line
with
both circuits
in
operation
is
500 MW
and
is 350 MW
with
any
one
of
the circuits.
A
solid three-phase
fault occurring
at
the
network-end
of one
of
the lines
causes
it to
trip. Estimate
the
critical
clearing
angle
in
which
the
circuit
breakers
must
trip
so that
synchronism
is
not lost.
What further
information
is needed
to estimate
the critical
clearing
time?
12.9 A
synchronous
generator
represented
by
a
voltage
source
of
1.05
pu
in
series with
a transient
reactance
of
70.15
pu
and
in
inertia
constant
F/
=
4.0
sec, is
connected
to an infinite
inertia
system
through
a transmission
line.
The line
has a series
reactance
of70.30 pu,
while
the
infinite
inertia
system
is
represented
by a
voltage
source
of
1.0
pu
in
series with
a
transient
reactance
of
70.20
pu.
The
generator
is transmitting
an acti're power
of
1.0
pu
when
a three-
phase
fault
occurs
at its terminals.
If
the fault
is
cleared
in
100
millisec,
determine
if the system
will
remain
stable
by
calculating
the
swing
curve.
12.10
For Problem
12.9 find the
critical
clearing
time
from
the
swin!
currre
for
a sustained
fault.
l2.ll A
synchrt)nous generator
representcd
by
a voltage
of
l.l5 pu
in
series
with a transient
reactance
is
c<lnnected
to
a large
power
system
with
voltttgc
1.0
pu
throtlgh
l
powcr
rrclwork.
Thc
cquivalcnt
tlarrsient
transf'er reactance
X
between
voltage
sources
is
70.50
pu.
After
the occurrence
of
a three-phase
to
grouncl
fault
on
one
of
the
lines
of the
power
network,
two
of the line
circuit
breakers
A
and
B operate
sequentially
as
follows
with corresponding
transient
transfer
reactance
given
therein.
(i)
Short
circuit
occurs at
6
=
30",
A opens
instantaneously
to
make
X
=
3.0
pu.
(ii)
At
6
=
60o, A recloses,
X
=
6.0 pu.
(iii)
At 5=75o,
A
reopens.
(iv)
At
d
=
90o, B also
opens
to clear
the
fault
making
X
=
0.60 pu
Check
if the
systenr will
operate
stably.
12.12 A
50 Hz synchronous
generator
with
inertia
constant
H
=
2.5
sec
and
a transient
reactance
of
0,20
pu
feeds
0.80
pu
active power
into
an
infinite
bus
(voltage
I
pu)
at
0.8 lagging power
lactor
via
a network
with
an
equivalent
reactance
of
0.25
pu.
A three-phase
fault
is sustained
for
150 millisec
across
generator
terminals.
Determine
through
swing curye
calculation
the
torqu
e
angle
6,
250
millisec,
after
fault
initiation.
Fi nd the sfc:trlv slzfe cfehilitrr limit if ll,/ |
-
ll/ |
-
tnll t,\/ /..^-^+^-+r
,.--'.,,J
rrrJ rrrrrrr
,,
,r,tt
_
| v
Rt
_
,\rv
A V
\Lt,|t:ltdlllr.
What
will
the
steady
state
stability
limit
be if
line
capacitance
is
also
neglected?
What
will
the
steady
state
stability
limit
be if
line
resistance
is
also
negloctcd'/
Cornnrcltt
on tlrc
rcsults.
A
power
deficient
area
receives
50 MW
over
a tie
line
from
another
area.
The
maximum
steady
state
capacity
of
the
tie line
is 100
MW.
Find
the
allowable
sudden
load
that
can
be
switched
on without
loss
of
stability.
A
synchronous
motor
is
drawin g
30vo
of the
maximum
steady
state
power
from
an
infinite
bus
bar.
If
the
load
on motor
is suddenly
increased
by 100 per
cent,
would
the
synchronism
be lost?
If
not,
what
is
the
maximum
excursion
of torque
angle
about
the
new
steady
state
r<ltor position.
The
transfer
reactances
between
a
generator
and
an infinite
bus
bar
operilting
irf 200
kV trnder
various
conditions
on
fhe interconnector
aro:
R
=
0.11
f)/km
C
=
0.009
lFlkm
Pretault
During
fault
Postfhult
L
-
1.45
mH/km
G=0
S0
0
per
phase
m O per
phase
2ffi
{)
per
phase
12.13
A
50 Hz,
500 MVA,400
kV
generator
(with
transformer)
is connected
to
a 400 kV
infinite
bus
bar
through an
interconnector.
The
generator
has F1
-
2.5
MJA4VA,
voltage
behind
transient
reactance
of 450 kV
and
is
loaded 460
MW.
The
transfer
reactances
between generator
and
bus
Power
System
Stabitity
I
5(D
12. Kundur, P., Power
System
Stability and Control,
McGraw-Hill,
New
York,
1994.
13.
Chakrabarti,
A.,
D.P. Kothari and
A.K. Mukhopadhyay,
Performance
Operation
and
Cqntrol of EHV Power Transmission
Systems, Wheeler
Publishing,
New
Delhi, 1995.
14. Padiyar, K.R., Povter
System
Stability
and
Control, Znd
lcatlons, Hy
15. Sauer, P.W. and M.A. Pai,
Power
System
Dynamics
and
Stabiliry, Prentice-Hall,
New
Jersey, 1998.
Papers
16. Cushing, E.W. et al.,
"Fast
Valving
as an Aid
to Power
System Transient
Stability and Prompt Resynchronisation
and
Rapid
Reload
After Full
L,oad
Rejection", IEEE
Trans, L972, PAS
9I
1624.
t
17. Kimbark,
E.W.,
"Improvement
of Power
System
Stability", IEEE
Trans., 1969,
PAS-88: 773.
18. Dharma Rao,
N.
"Routh-Hurwitz
Condition
and
Lyapunov
Methods for the
Transient
Stability Problem", Proc.
IEE, 1969,
116:
533.
19.
Shelton, M.L. et al.,
"BPA
1400
MW Braking
Resistor",
IEEE
Trans.,
1975,94:
602.
Nanda,
J.,
D.P.
Kothari, P.R. Bijwe
and D.L.
Shenoy, "A
New
Approach for
Dynamic Equivalents
Using Distribution
Factors
Based
on
a Moment
Concept",
Proc. IEEE Int. Conf.
on
Computers,
Systems and
Signal Processi4g,
Bangalore,
Dec. 10-12, 1984.
\
Dillon, T.S.,
'Dynamic
Modelling
and
Control
of Large
Scale
System", Int.
Journal of Electric Power
and Energy
Systems,
Jan.
1982,
4: 29.
Fatel,
R.,
T.S.
Bhatti and D.P.
Kothari,
"Improvement
of Power
System Transient
stability using
Fast valving: A
Review",
Int.
J. of
Electric
Power
components
and
Systems,
Vol.
29, Oct 2001,
927-938.
Patel,
R., T.s. Bhatti and D.P.
Kothari,
"MATLAB/simulink
Based
rransient
Stability Analysis
of a Multimachine
Power
System,
IJEEE,
Vol.
39, no.
4,
Oct.
2002,
pp
339-355.
Patel
R., T.S. Bhatti and D.P.
Kothari,
"A
Novel
scheme
of Fast valving
Control",
IEEE
Power Engineering
Review,
Oct.2002, pp.
4446.
Patel, R., T.S. Bhani
and D.P. Kothari,
"Improvement
of Power
system
Transient
stability by coordinated
operation
of Fast
valving
and
Braking
Resistor", To
appear in IEE
proceeriings-Gen.,
Trans and
Distribution.
During
fault
Postfault
1.0
pu
0.75
pu
Calculate
the
swing
curve
using
intervals
of 0.05
sec
and assuming
that
the
fault,is
cleared
at 0.15
sec.
I2.I4
Plot
swing
curves
and
check
system
stability
for the
fault shown
on the
system
of Example
12.10
for fault
clearing
by simultaneous
opening
of
breakers
at the
ends
of the
faulted
line
at three
cycles and
eight cycles
after the
fault
occurs.
Also plot
the swing
curye
over
a
period
of
0.6 sec
if the
fault is
sustained.
For the
generator
assume
H
=
3.5
pu,
G
=
1
pu
and carry
out
the computations
in
per
unit.
12.15
Solve Example
12.10
for a
LLG fault.
REFERE
N CES
Books
1
Stevenson,
W.D.,
Elements
of Power
System
Analysis,
New
York, 1982.
Elgerd,
O.I., Electic
Energy
Systems
Theory:
An
McGraw-Hill,
New
York,
1982.
4th edn.,
McGraw-Hill,
iniroduciion,
2nd
edn.,
The Iowa
3.
Anderson,
P.M. and
A.A.
Fund,
Power
System
Control
and
Stability,
State
University Press,
Ames,
Iowa,
1977.
4.
stagg, G.w. and
A.H.
o-Abiad,
computer
Methods
in Power
system Analysis,
Chaps
9
and
10,
McGraw-Hill
Book
Co., New
York,
1968.
5.
Crary,
S.8., Power
System Stability,
Vol.
I
(Steady
State
Stability), Vol. II
(Transient
Stability), Wiley,
New
York,
1945-1947.
Kimbark,
E.W.,
Power
System
Stability, Vols
1, 2 and
3,
Wiley, New
york,
1948,
Veuikorz,
Y.A.,
Transient
Phenomena
in Electrical
Power
System
(translated
from
the Russian),
Mir
Publishers,
Moscow,
1971.
8.
Byerly,
R.T.
and
E.w. Kimbark
(Eds.),
stability
of l^arge Electric
power
Systems,
IEEE
Press, New
York,
1974.
9.
Neuenswander,
J.R., Modern
Power
Systems,International
Text Book Co., 1971.
t0.
Pai,
M.A., Power
System
Stability Annlysis
by
the Direct
Method
of
Lyapunov.,
North-Holland,
System and
Control
Services, Vol.
3, 1981.
I
1.
Fouad, A.A
and
V.
Vittal,
Power
System Transient
Stability
Analysis using the
Transient Energy
Function Method,
Prentice-Hall,
New
Jersy, 1992.
20.
2r.
22.
23.
.A
L+.
25.
6.
7.
13.1
INTRODUCTION
In
Chapter
7,
we
have
been
primarily
concerned
with
the
economical
operation
of
a
power
system'
An
equally
important
factor
in
the
operation
of
a power
system
is
the
desire
to
maintain
system
security.
System
security
involves
practices
suitably
designed
to
keep
the
system
operating
when
components
fail.
Besides
economizing
on
fuel
cost
and
minimizrngemission
of gases
(co,
cor,
Nox,
sor),
the
power
systern
should
be
operationally
,.secure,,.
An
operation_
ally
"secure"
power
system
is
one
with
low
probability
of,
systern
black
out
(collapse)
or
equipment
damage.
If
the
pro."r,
uf
cascading
failures
continses.
the
systern
as
a
whole
or
its
tnajor
parts
may
completely
collapse.
This
is
normally
referred
to
as
system
blackout.
All
these
aspects
require
security
constrained
power
system
optimization
(SCO).
Since
security
and
economy
normally
have
conflicting
requirements,
it
is
inappfopriate
to
treat
them
separately.
The
fina.l
aim
of
economy
is
the
security
lunction
of
the
utility
company.
The
energy
management
system
(EMS)
is
to
operate
the
system
at
minimum
cost,
with
the guaranteed
alleviation
of
emergency
conditions.
The
emergency
condition
will
depend
on
the
severity
of
t
iolations
of
operating
lirnits
(branch
f'lows
and
bus
voltage
limits).
The
most
severe
violations
result
fiom
contingencies.
An
irnportant
part
of
security
study,
therefbre,
moves
around
the
power
system's
ability
to
withstanrj
the
effects
of
contingencies.
A
particular
system
state
is
said
to
be
secure
only
with
reference
to
one
or
more
specific
contingency
cases,
and
a
given
set
of quantities
monitored
for
violation.
Most
power
systems
are
operated
in
such
a
way
that
any
single
contingency
will
not
leave
other.o-pon"nts
heavily
overloaded,
so
that
cascading
failures
are
avoided.
Power
System
Security
I
Sll
Most
of
the
security related
functions
deal
with
static
"snapshots"
of the
power
system.
They have
to
be executed
at intervals
compatible
with
the
rate
of change
of system
state.
This
quasi-static
approach
is, to a large
extent, the
only
practical
approach
at present,
since
dynamic
analysis
and
optimization
are
conslder4bly
mole
{!fficu!! 4nd
cqmpurallo44lly
1aqte lime
corrsulurg,
System
security can
be
said to comprise
of
three
major
functions
that
are
carried
out in an
energy
control
centre:
(i)
system
monitoring, (ii)
contingency
analysis,
and
(iii)
comective
action analysis.
System monitoring
supplies
the
power
system
operators
or dispatchers
with
pertinent
up-to-date
information
on the
conditions
of the power
system
on
real
time
basis as load
and
generation
change.
Telemetry
systems
rneasure,
monitor
and transmit
the data, voltages,
currents,
current
flows
and
the
status
of circuit
breakers
and switches in
every
substation
in a
transrnission
network.
Further,
other critical
and important
information
such
as frequency,
generator
outputs
and transformer
tap
positions
can also
be telemetered.
Digital
computers
in a
control
centre
then
process
the
telemetered
data
and place
them
in
a data base
form
and inform the
operators
in case
of an
overload
or out
of limit
voltage.
Important
data
are also
displayed
on large
size
monitors.
Alarms
or
warnings
may
be
given
if required.
State estimation
(Chapter
14)
is normally
used in
such
systems
to
combine
telemetered
data
to
give
the
best estimate
(in
statistical
sense)
of the
curreltt
system
condition
or
"state".
Such systems
otten
work with
supervi$ory
control
systems
to help
operators control
circuit
breakers
and
operate
switches
and
taps
remotely.
These
systems
together
are
called
SCADA
(supervisory
control
and
data
acquisition)
systelns.
The second
ma-ior security
function
is
contingency
analysis.
Modern
operation
computers
have
contingency
analysis
programs
stored
in them.
These
loresee
possiblc
systetn troubles
(outages)
before
they
occur.
They
study
outage
events
and alert
the operators
to
any
potential
overloads
or serious
voltage
violatitlns.
For exalnple,
the
sirnplest
firrm
of contingency
analysis
can
be
put
together with
a
standard LF program
as
studied
in
Chapter
6, along with
procedures
to set
up the load
flow
dafa for
each
outage
to
be studied
by
the
LF
plogram.
This allows
the
system
operators
to
locate
def'ensive
operating
states where
no single
contingency
event
will
generate
overloads
and/or
voltage
violation:;.
This
analysis
thus
evolves
operating
constraints
which
may be
cntpioycd
in thc
liD
(ccotrolnic
dispatch)
and
UC
(unit
cornnritrnclrt)
prograrrr.
Thus
contingency
analysis
carrics
out
ornergcncy
identil'ication
ancl
"what
if''
simulations.
The
third
major security
function,
corrective
action
analysis,
permits
the
operator to
change the
operation
of
the power
system
if a
contingency
analysis
program predicts
a
serious
problem
in
the event
of the
occurrence
of
a certain
outage.
Thus
this
provides
preventive
and post-contingency
control.
A
simple
example
of
corrective
action
is
the shifting
of
generation
from
one
station to
another. This
may
result in
change
in
power
flows
and
causing
a
change in
loading
on overloaded
lines.
j5!2,1
Modern
Po@is
Threse
three ftrnctions
together
consist
oi
a very compiex
set of toois
that heip
in the secure
operation
ol'a
power
system.
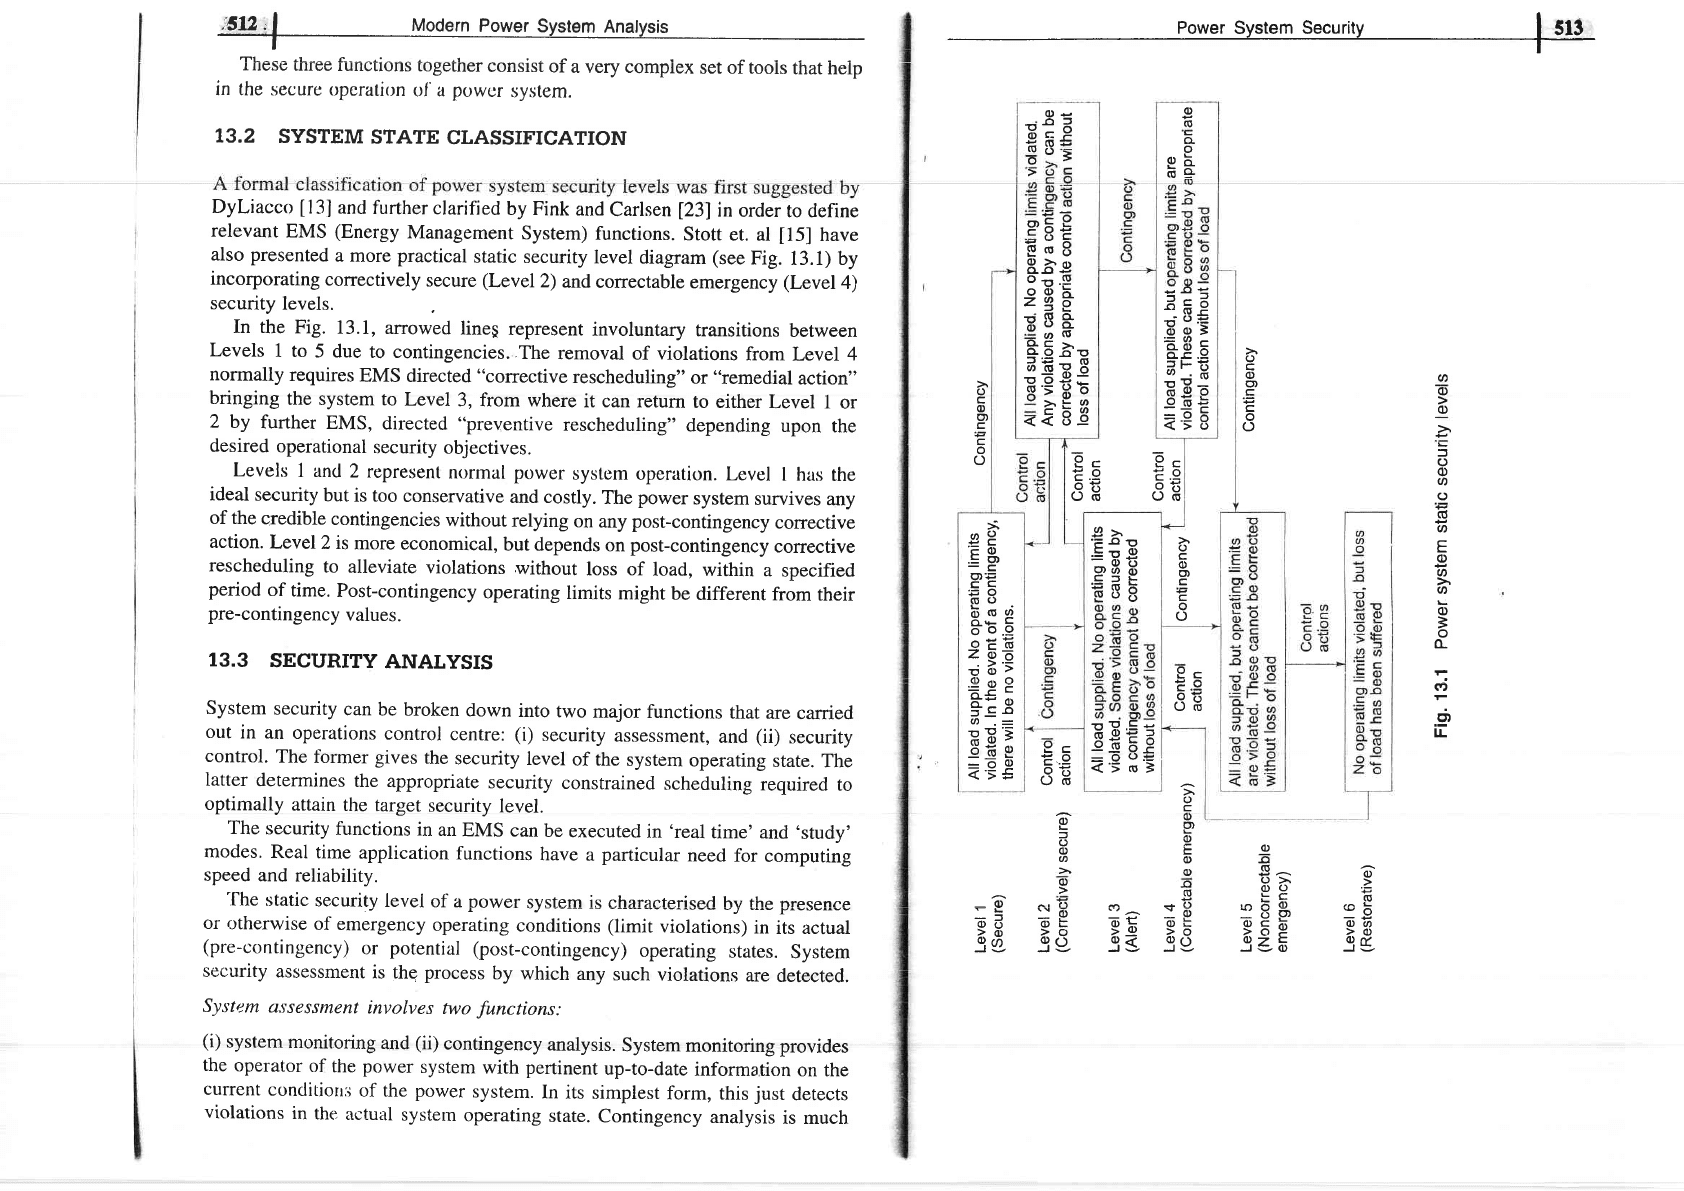
T3.2
SYSTEM
STATE
CLASSIFICATION
Dyliacco
[13]
and
further
clarified
by Fink
and
Carlsen
l23l
in
order
to define
relevant
EMS
(Energy
Management
System)
functions.
Stott
et. al
[15]
have
also presented
a
more
practical
static
security
level
diagram
(see
Fig.
13.1) by
incorporating
correctively
secure
(Level
2)
and
correctable
emergency
(Level4)
security
levels.
In the
Fig.
13.1,
arrowed
linep
represent
involuntary
transitions
between
Levels
1 to
5 due
to contingencies..The
removal
of violations
from
Level 4
normally
requires
EMS
directed
"corrective
rescheduling"
or
"remedial
action"
bringing
the system
to
Level
3, from where
it can return
to either
Level
I or
2
by
further
EMS,
directed
"preventive
rescheduling"
depending
upon
the
desired
operational
security
objectives.
Levels
I and
2
represent
normal
power
system
operation.
Level
t
has the
ideal
security
but
is too
conservative
and costly.
The
power
system
survives
any
of the
credible
contingencies
without
relying
on
any
post-contingency
corrective
action.
Level2
is
more
economical,
but depends
on
post-contingency
corrective
rescheduling
to
alleviate
violations
without
loss of
load,
within
a
specified
period
of
time.
Post-contingency
operating
limits
might
be
different
from
their
pre-contingency
values.
13.3
SECURITY
ANALYSIS
System
security
can
be broken
down
into
two
major
functions
that
are
carried
out
in
an operations
control
centre:
(i)
security
assessment,
and
(ii)
security
control.
The
tormer gives
the
security
level
of the
system
operating
state.
The
latter
determines
the
appropriate
security
constrained
scheduling
required
to
optimally
attain
the
target
security
level.
The
security
functions
in
an
EMS
can
be
executed
in
'real
time'
and
'study'
modes.
Real
time
application
functions
have
a
particular
need
for
computing
speed
and
reliability.
'fhe
static securit.v
level
of a power
system
is
characterised
by the
presence
or
rrtherwise
of emergency
operating
conditions
(limit
violations)
in
its actual
(pre-contingency)
or
potential (post-contingency)
operating
states.
System
security
assessment
is
the
process
by
which
any
such
violations
are
detected.
Sy
st e m e.:^
s €
s s
tlt€rrt
involv
e s two
func
tions
:
(i)
system
monitoring
and
(ii)
contingency
analysis.
System
monitoring
provides
the
operator
of
the
power
system
with
pertinent
up-to-date
information
on the
current
condition:;
clf the
power
system.
In
its
simplest
form,
this
just
detects
violations
in
the
actual
system
operating
state.
Contingency
analysis
is much
I
srr
=
o
-
3
o
-o
c
o
o
o
o
o
o
o
o
L
o-
o
pb.
6q
o
o
o)
o
o
o
o
o
L
f
()
o
U)
C)
(E
o
E
o
o
o
o
o
o_
at
.d,
lr
Pc
9c
EO =O
dH d8
o
c
c)
o)
c
o
o
9c
6H
g>
.FOE
=-E
fi
E8E
zE
Cg
g#EE
('5
o
3
x
o9.
'Eb
.=
g,
g)'E
cc
FO
(g(J
bod
8bb
:58
d
d'5
(l)-.o
.=9=
los i
5co
(t)
.=
H E'=
eoy
=ee
o
-o
8s
9
oo
':=
L-A
,^kat ,^i:
*'uo
*9
ocfr
o)c,
>ox
>o
Az
C.
Ail
J3(D J3
o
0)
o)
E
o)
o
-o
([
()
q)
L
C)
r'/^
Y
ea i
9c
F.O
d8
6-
L
o
c)
a
o
::0
(l)-
>o
_9 !)
-E
ad
gE
o
o
g,
c
c
o
(J
EE
8E
(!6
BE
r:
.9
qF
oo
oo_
E;.
^Et-E
.;Eb
abg
o,
c
o
L
q)
o.
o
o
z
E
o
o.
o-
=
o
E
o
o
-o=
gH€
'=O-
o_o
x
o--c.Y
!ie
=98
,.sfe
;l
Modern
power
Svstem
Analvsis
Only a small
proportion
of work
on
optimal
power
flow
(OPF)
has taken
into
account
the
security
constraints.
The most
successful
applications
have
been
to
the
security
constrained
MW
dispatch
OPF sub-problem.
The
contingency-
constrained
voltageivar
rescheduling problem,
as
of the
writing
of this
text,
still
remains
to
be solved
to a
satisf
desree.
The
total
number
of
contingency
constraints
imposed
on SCO is
enormous.
The
SCO or contingency
constrained
OPF
problem
is solved
with
or without
first
optimizing
with
respect
to the base
case
(precontingency)
constraints.
The
general
procedure
adopted
is
as follows:
(i)
Contingency
analysis
is carried
out and
cases
with violations
or near
violations
are identified.
(ii)
The
SCO
problem
is solved.
(iii)
The
rescheduling
in
Step 1
might
have
created
new violations,
and
therefore
step 1 should
be repeated
till
no violations
exist.
Hence,
SCO represents
a
potentially
massive
additional
computing
effort.
An excellent
comprehensive
overview
of
various
available
methods
is
presented
by
Stott
et. al
[15].
There
is still
great
potential
for
further
improvement
in
power
system
security
control.
Better problem
formulations,
theory,
computer
solution
methods
and
implementation
techniques
are
required.
T3.4
CONTINGENCYANALYSIS
In
the
past
many
widespread
blackouts
have
occurred
in
interconnected power
systems.
Therefore,
it
is
necessary
to
ensure
that power
systems
should
be
operatec!
mosf
economic:r!ly
such
that povrer
is cle!i.rerecl
reliably.
Reliable
operation
implies
that there
is adequate
power generation
and the
same
can be
transmitted
reliably
to the
loads. Most power
systems
are
designed with
enough
redundancy
so that
they
can withstand
all
rnajor
tailure
events.
Here we
shall
sttrdy
thc
possiblc
consccprcnccs
:rncl rcrncdial
actions
rcquircd
by
two nrain
f
ailure
events;
line.orrtages
ancl generating
rrnit
failures.
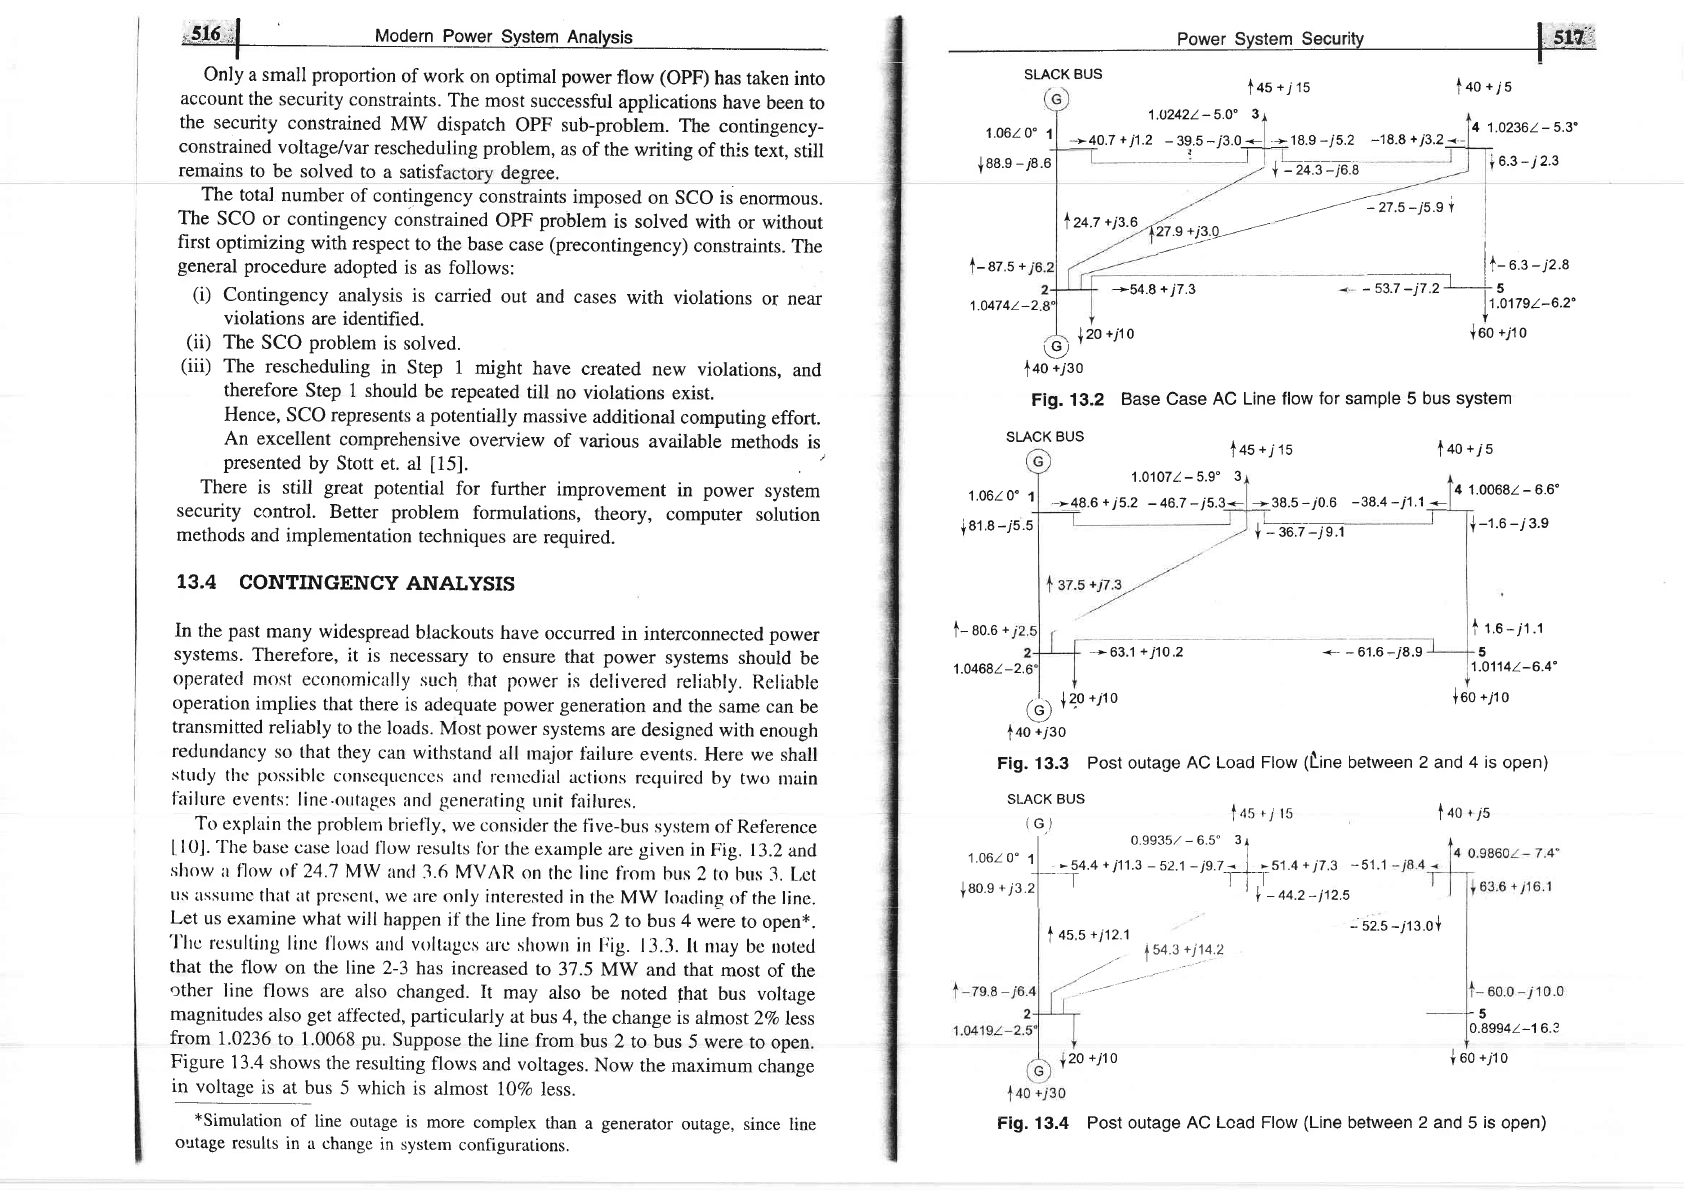
To
explain
the
probleln
briefly, we
consider
the five-bus
system
of Ref'erence
L
I0J.
The
base case
load llow
results
lbr
the
example
are given
in
t ig. 13.2
and,
sltrrw
ir f'low <tf
24.7
MW
and
3.6 MVAR
on
the line
f}om
bus
2 to
hus
3. L.ct
tls
llsstllllc
that at
prcscnl,
we
ilrc
only intcrestecl
in
the MW
loading
of the line.
Let
us examine
what will
happen
if the
line
from bus
2 to bus 4
were
to open*.
'l'lrc
rcsulting
linc
l'lows
artcl
voltagcs
ulc
shown
in lrig.
13.3.
tt nray
be
notcd
that
the flow
on the line
2-3
has
increased
to 31.5
MW
and that
most
of the
other
line flows
are also
changed.
It
may
also
be
noted
fhat
bus voltage
magnitudes
also get
aff'ected,
particularly
at
bus 4,
the change
is almost2To
less
from
1.0236
to
1.0068 pu.
Suppose
the
line from
bus 2
to bus
5 were to
open.
Figure
13.4
shows
the resulting
flows and
voltages.
Now
the
inaximum
change
t:fgl.g.j
",jus
5 which
is almost
107o
less.
xSimulation
of line
outage
is
more
complex
than a
generator
outage,
since line
outage
results
in a change
in
system
configurations.
I
srai
Power System
Security
_
SLACK
BUS
f+o*ys
t
+s
*y
ts
1.02421-5.0"
3
1.O6tO"
1
41.0236t-5.3"
--.>40.7
+
j1.2
_
39.5
_i3.0:_
+
18.9
-y5.2
_16.9
+13.2-<
_
,f
88.e
-y8.6
,l
+
-Ja.a--/e.8
i6.3-j2.3
I
z+.2
*js.a
----/
--zt.s-i5.9
t
'L?:'-q''---'
t-
az.s
*
1.0474t-2
1.0610"
1
!G-)
),zo
+1to
t40
+i30
Fig. 13.2
Base Case
AC
SLACK
BUS
*oo
*ito
Line flow
for sample 5 bus system
l+-u
'-"''
.i;n;l--+s-
53.7
-i7.2
-*
5
'
i1.o17gt-6.2"
Y
*S4.9
+17.3
:63.1 +
j1O.2
{+s*yts
1.01071-
5.9"
3
->48.6
+ j5.2
-46.7 -
j5.3<-
+
38.5
-10.6
-38.4 -i1.1
:-
+
--
3a?
-/'e
r
f+o+7s
4
1.00682
-
6.6"
{
-r.o -7
a.s
i
r.s
-;t
.r
-<--
-
61.6
-i8.9
5
1.O114t-6.4"
loo
*lt
o
AC Load Flow
(Line
between
2
and
4 is
open)
tas
rr
ts
I
ao
,7s
-
52.s
-i
13.0
+
+
81 .8
-i
5.5
t-
eo.o
*
1.0468t-2.
rlr
{
2s
+ilo
\
lJ./
t40
+i30
Fig.
13.3
Post outage
SLACK
BUS
(c)
|
+s,s
*
1tz.t
'::
)ll
':t't'
-5
0.8994t-16.?
120
+i10
'f
oo
*yr
o
between
2
and 5
is
open)
|
0.se35/
-
6.s"
o
1
1'06t0"
1l
'54.4 +
i1i.3
-s2.1-i9.7
-
|
-s1.4 +i7.3
-s1.1
_1_
_r
tl;f
+80.e+13.21
|
Itl_qq.z_j1z.s
Fig. 13.4 Post
outage AC Lcad Flow
(Line
5LAUK
HUS
e
t4s
+l
15
|
1.oo61t
_
s.7" 31
1.06t0"
1l
^ I
'l_
-!.6
+
1t.s
_
4s.9
_j7.6
<_i
__22.4
_
j2.6
{nze+iz1.7l
L-
--i-1-I
I ---
V
_21.5_j4.8
Give Alarm
signal
;'518 |
rr,rodern
Po@is
-t-
l+o*1s
41.O043t-6.1"
_22
.3
+
j0.7
<_
{
t.s
-
1t.t
-25.2-j4.4
+
I
---t
i
'''"
1-rzo.g
-1ts.tl
(-'-
_-
ll
r
2..]--u+
_+
_53.6
+16.8
1.o24st-3.7.
i
Y
l,zo
+1lo
<-
-52.5
-16.5
f-zs-7s.s
5
o
9956/_-7
.1"
{oo*iro
lost
generation
is
Give Alarm
signal
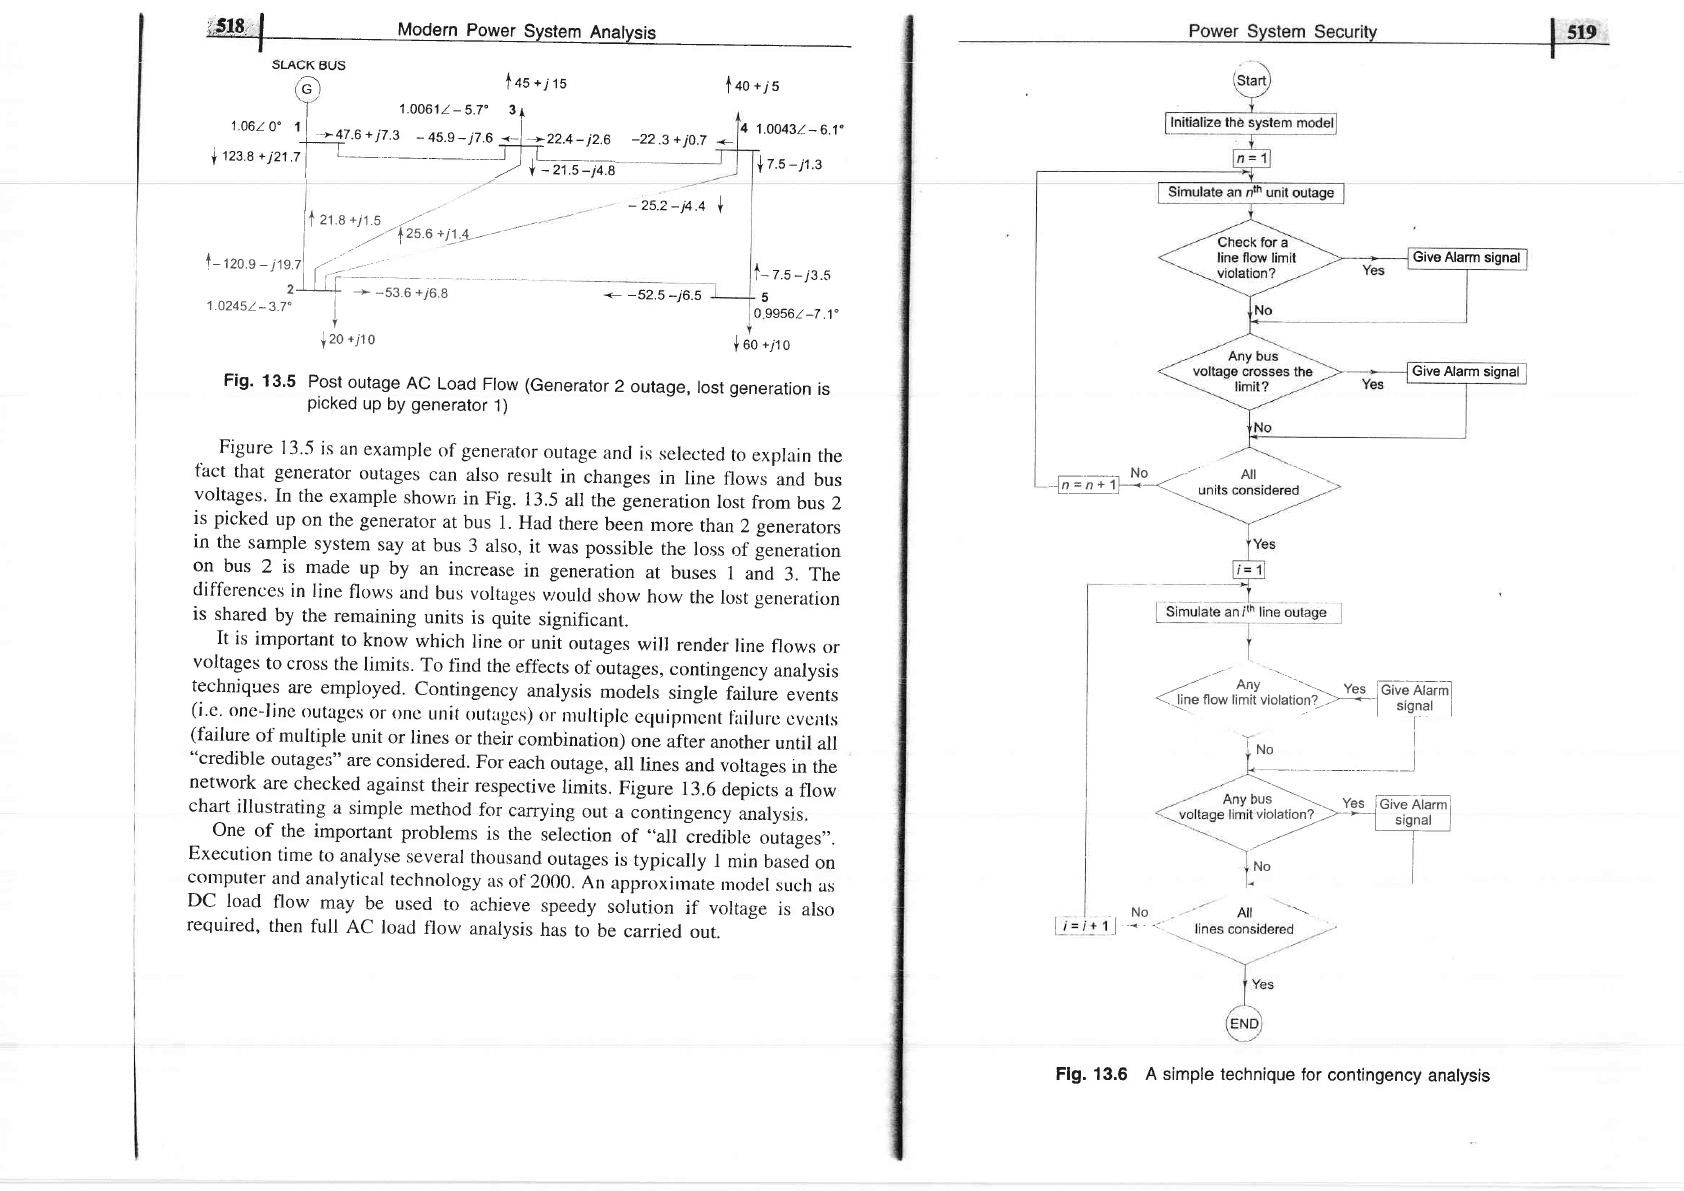
Fig.
13.5
Post
outage
AC
Load
Flow (Generator
2
outage,
picked
up
by
generator
1)
Figure
13.5
is
an
example
of
generator
outage
ancl
is
selected
to
explain
the
tact
that generator
outages
can
also
result
in
changes
in
line
flows
and
bus
voltages.
In
the
example
showr
in
Fig.
13.5
all
the generation
lost
from
bus
2
is picked
up
on
the generator
at
bus
1.
Had
there
been
more
thanZgenerarors
in
the
sample
system
say
at
bus
3 also,
it
was
possible
the
loss
of
leneration
on
bus
2 is
made
up
by
an
increase
in generation
at
buses
1
and
3.
The
differences
in Iine
flows
ancl
bus
voltages
vrould
show
how
the
lost gener.ation
is
shared
by
the
remaining
units
is
quite
significant.
It
is
important
to
know
which
line
or
unit
outages
will
render
line
flows
or
voltages
to cross
the
lirnjts.
To
find
the
eff'ects
of
outages,
contingency
analysis
techniques
are
empioyeci.
Contingency
analysis
models
single
failure
events
(i'e'
one-linc
outagcsi
orollc
unit
outugcs)
or
nrultiplc
ccpripnrcnt
firilurc
cvc^ts
(failure
of multiple
unit
or lines
or
their
combination)
one
after
another
until
all
"credible
outages"
are
considered.
For
each
outage,
all
lines
ancl
voltages
in
the
netrvork
are
checked
against
their
respective
limits.
Figure
13.6
depicts
a
flow
chart
illustrating
a
simple
method
for
carrying
out
a
contingency
analysis.
One
of the
important
problems
is
the
selection
of
"all
credible
outages,,.
Execution
time
to
analyse
several
thousand
outages
is
typically
I
min
based
on
computer
and
analytical
technology
as
of
2000.
An
erpproxirnate
rnodel
suclr
as
DC
load
flow
may
be
used
to
achieve
speedy
solution
if
voltage
is
aiso
required,
then
full
AC
load
flow
analysis
has
to
be
carried
out.
--'t A-..
1;no*rifii.iuior".""-i;{offi
'l
l'r'.,o
'
''l''''
__l
,rr\=_
ves
jciventarn
violation?
->*-t_-qJ
-T-
,*"
I
,No
I
'-- -i
Ail
--\
FIg. 13.6 A simple technique
for
contingency
analysis
620j;:f
uodern
Power
System
Anatysis
I
^ a ? frErrarE?rtrElt
IJ.C
DIIIYDIIIVII
Y .FAUI-L'I(s
A .security
analysis
program
is
run
in a load dispatch
centre
very
quickly
to help
the
operators.
This
can
be attempted
by carrying
out
an approximate
analysis
and
using
a computer
system
having
multiple processors
or
vector
processors
y
anarysts.
I ne
s
may
uate
an equrvalent
should
be
used
for neighbours
connected
through
tie-linos.
We
can
eliminate
all
non-violation
cases and
run
complete
exact program
for
"critical"
cases only.
This
can
be achieved
by using
techniques
such
as
"contingency
selection"
or
"contingency
screening",
or
"contingency
ranking".
Thus it will
be easy to
warn
the operation
staff
in advance
to enable
them to
take
corrective
action
if
one
or
more
outages
wiil result
in
serious
overloads
or any
violations.
One of
the
simplest
ways
to
present
a
quick
calculation
of
possible
overloads
is to
employ
network
(linear)
sensitivity
factors.
These factors give
the approximate
change
in
line
flows for
changes
in
generation
in the
system
and can
be
calculated
from
the
DC load
flow.
They are
mainly
of two
types:
1.
Generation
shift factors
2. Line
outage distribution
factors
Briefly
we
shall now
describe
the use
of those
factors
without
deriving
them.
Reference
[7]
gives
their
deri iation.
The
generation
shift
factorsl
cr.,; are
defined
as:
limits
and
those
violating
their
limit
can
be
informed
to the
operator
for
necessary
control
action.
The
generation
shift
sensitivity
factors
are
linear
estimates
of
the change
in
line
flow
with
a change
in
power
at a bus.
Thus,
the
effects of
simultaneous
principle of
superposition.
Let
us assume
that
the
loss of
the
ith
generator
is to
be
made up
by
governor
action
on
all
generators
of the
interconnected
system
and
pick
up
in
proportion
to their
maximum
MW
ratings.
Thus,
the
proportion
of
generation
pick up
from
unit
k
(k
*
i)
would
be
where,
4t
=
Change
in MW power
flow
on hne
I when
tion,
AP", takes place
at the
ith bus
Here,
it is
assumed
that LPotis
fully
compensated
by an
equal
and opposite
change
in
generation
at
the
slack
(reference)
bus, with
all other
generators
remaining
fixed at their
original power generations.
The factor
al,then gives
the
sensitivity
of the
/th line flow
to a change
in
generation
at ith
bus. Let us
now
study
the
outage of a large generating
unit
and
assume
that all
the lost
generation (Pod
would
be supplied
by the
slack
bus
generation.
Then
APo,
-
-P1i
where
Pn,,,,,u,^
=
maximum
MW
rating
for
rnth
generator
g*i=
proportionality
factor
for
pick
up
on
kth unit
when
ith
unit
fails.
Now,
for checking
the
/th line
flow,
we
may
write
j,
=
ff
* 0r;
APo,
-
E,lau,
\ri
LPotl
In Eq.
(13.8)
it
is
assumed
that
no unit
will
violate
its
maximdm
limit.
For
unit
limit
violation,
algorithm
can
easily
be
modified.
Similarly
the
line
outage
distribution
factors
can
be
used
for
checking
if
the
line
overloads
when
solllc
of
the
lines
are lost.
The
line
outage
distribution
factor
is defined
as:
d,,,=
*
Ji
where
dt,i
=
line
outage
distribution
outage
of
ith
line.
Aft
=
change
in
MW
flow
on
/th iine'
fi
-
precontingency
line
flow
on
ith line
lf
precontingency
line
flows
on lines
/ and
i,
tlre
power flow on
line
/
with
line
i out
can
be
found
out
employing
"d"
factors.
(13.4)
a change
in
genera-
(13.7)
(13.8)
(13.10)
(
13.e)
factor
when
monitoring
/th line
atter
an
(13.s)
and
the new
power
flow
on each
line could
be calculated
using
a
precalculated
set of
"
d' factors
as
given
below.
ft
=
f
i
*
dti APc,
for
all lines
V /
(13.6)
where,
ft
-
power
flow
on /th
line after the
failure
of
ith generator
f
i
=
power
flow
on /th
line before
the failure
or
precontingency
power
flow
Here,
fi
^d
foi
=precontingency
or
preoutage
flows
on
lines
/ and
i respectively
?,=
ff
*d,,,f,o
fr
=
power flow
on
/th
line
with
ith
line
out.
iii
l
Modern
Po
a
Thus
one can check
quickiy
by
precaiculating
'd'
factors ali the
lines for
overloading
for the outage
of a
particular
line.
This can be repeated fbr the
outage
of each
line one by one
and
overloads
can be found out
for corrective
action.
It
may be noted
that a line flow
can be
positive
or negative. Hence
we must
check
/
agarnst
-
Jt
^u*
as
well as
h **.
Llne tlows can be louncl out usmg
telemetry
systems or
with state estimation
techniques. If the network undergoes
any
significant
structural change,
the sensitivity factors must be updated.
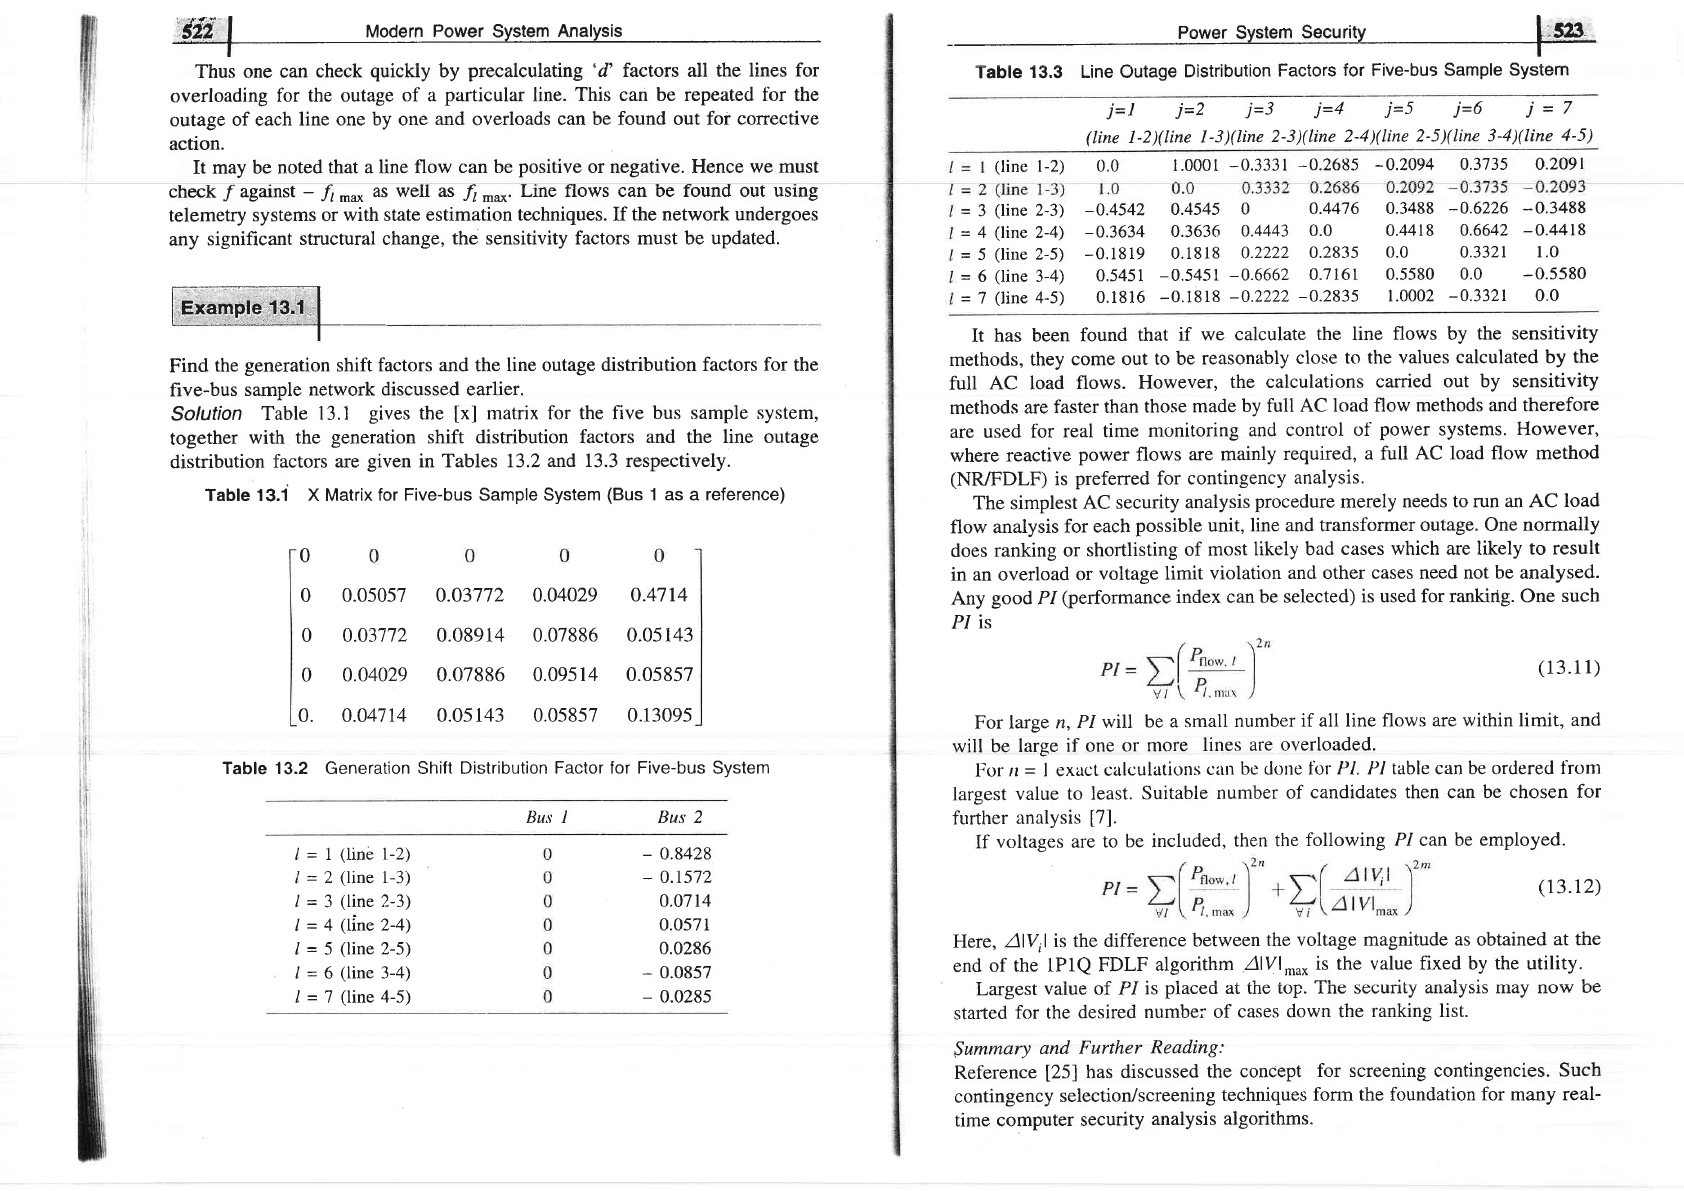
Find
the
generation
shift
factors and the line outage
distribution factors for the
five-bus
sample network
discussed earlier.
Solution
Table
13.1
gives
the
[x]
matrix for the five bus sample
system,
together
with
the
generation
shift distribution factors
and the line outage
distribution
factors are
given
in Tables I3.2
and 13.3 respectively.
Table 13.1 X Matrix
for Five-bus Sample System
(Bus
1 as a reference)
0.05057 0.03772 0.04029 0.4714
0.03772 0.08914 0.07886 0.05143
0.04029 0.07886 0.09514
0.05857
0.04714
0.05143 0.05857 0.13095
Table 13.2 Generation Shift
Distribution Factor for Five-bus System
Bus I Bus 2
J
"srr
j=l j=2
j=3 j=4
j=5 j=6 j
=
7
(line
1-2)(line
l-3)(Iine
2-3)(line 2-4)(line
2-5)(line
3-4)(line
4-5)
(line
l-2)
0.0
1.0001
-0.3331
-0.2685
-0.2094
0.3735 0.2091
=
3
(line
2-3)
-0.4542
0.4545
0
0.4476 0.3488
-0.6226 -0.3488
-
J
\rr\rw
L-J)
-v
=
4
(hne
2-4)
-0.3634
0.3636
0.4443
0.0 0.4418
0.6642
-O.44r8
=
5
(line
2-5)
-0.1819
0.1818
0.2222
0.2835
0.0 0'3321
1.0
=
6
(line
3-4)
0.5451
-0.5451
-0.6662
0.7161
0.5580 0.0
-0.5580
=
7
(line
4-5)
0.18i6
-0.1818
-0.2222
-0.2835
1.0002
-0.3321
0'0
It
has been
found
that
if
we calculate
the line flows
by the sensitivity
methods,
they
come out
to be
reasonably
close
to the
values calculated by
the
full
AC load
flows.
However,
the
calculations
carried
out by sensitivity
methods
are
faster than
those
made
by full AC
load flow methods
and therefore
are used
for
real time
monitoring
and control
of
power
systems. However,
where
reactive
power flows
are mainly
required,
a full AC
load flow method
(NR/FDLF)
is
preferred for contingency
analysis.
The simplest
AC
security
analysis
procedure
merely
needs to run an AC
load
flow analysis
for
each
possible unit,
line and transformer
outage. One
normally
does ranking
or
shortlisting
of
most
likely bad
cases which are likely to
result
in an overload
or
voltage limit
violation
and other cases
need not be analysed.
Any
good
P1(performance
index
can
be selected)
is used for rankirig. One
such
P/
is
0
0
0
0
0.
(13.11)
For large
n, PI
will
be a small
number
if all line flows
are within limit,
and
will
be
large
if one or
more
lines are
overloaded.
For
rr
=
I exact
calculations
ciur
be done fbr
P1. P1 table can be ordered
from
largest
value
to least.
Suitable
number
of
candidates then can be
chosen for
further
analysis
[7].
If
voltages
are to
be included,
then
the
following
PI
can
be employed.
l=1(line1-2)
/=2(line1-3)
/=3(line2-3)
I=4(line2-4)
/=5(line2-5)
/=6(line3-4)
I=l
(line4-5)
-
0.8428
-
o.t572
o.0714
0.0571
0.0286
-
0.0857
-
0.0285
(13.12)
Here,
Alvil
is the difference
between
the
voltage magnitude as obtained
at the
end
of
the lPlQ
FDLF
algorithm
Alvl-u* it the
value fixed by the utility.
Largest
vaiue oi Pi
is
piaceci at the
top. The security
arraiysis trray rrow
-ue
started
for the
desired
numbel of
cases
down the
ranking list.
$ummary
and Further
Reading:
Reference
[25]
has
discussed
the
concept
for screening contingencies.
Such
contingency
selection/screening
techniques
fonn the foundation for many
real-
time
computer
security
analysis
algorithms.
Reference
[15]
gives
a broad
overview
of
security
assessment
and
contain
an
;;;;t]r",
bibliography
covering
the
literature
on"security
assessmenr
up
to
Reference
[11]
gives
an
excellent
bibliography
on
voltage
stability.
This
topic
is
discussed
briefly
in
the
next
section.
13.6
POWER
SYSTEM
VOITAGE
STABILITY
Power
transmissiol
tuglgility
has
traditionally
been
Iimited
by
either
rotor
angle
(synchronous)
stability
or
by
thermal
loaoing
capabilities.
The
blackout
problem
has
been
linked
with
transient
stability.
L-uckily
this
;roblem
is
now
not
that
serious
because
of
fast
short
circuii
clearing;
po*Lrru
excitation
systems,
and
other
special
stability
controls.
ElectriJ
*rnpuni"s
are
now
required
to
squeeze
the
maximum
possible
power
through
"ii.G
networks
owing
to
various
constraints
in
the
construction
of generation
and
transmission
facilities.
voltage
(load)
stability,
however,
is
now
a
main
issue
in planning
and
operating
electric
power
systems
and
is
a
factor
reading
to
limit
po-w;
transfers.
voltage
stability
is
concerned
with
the
ability
of
a
power
system
to
maintain
acceptable
voltages
at
all
buses
in
the
system
under
normal
conditions
and
after
being
subjected
to
a
disturbance.
A
power
system
is
said
to
have
entered
a
state
of
voltage
instability
when
a
disturbante
resurts
in
a pro!."rriu"
and
uncontrollable
decline
in
voltage
Inadequate
reactive.-power
support
from
generators
and
transmission
lines
leads
to
voltage.instability
ot
uoitug"
collapse,
which
have
resulted
in
several
major
system
failures
in
the
world.
Th"y
-",
(i)
south
Florida,
usA,
system
disturbanc
e
of
17
May
r9g5,
(transient,
4
sec)
(ii)
French
system
disturbances
of
Decembe
r
19,
r97g
and
Januar
y
12,
rgg7,
(longer
term).
(iii)
swedish
system
disturbance
of
December
27,
rgg3 (longer
term,
55
sec)
(iv)
Japanese (Tokyo)
system
disturbance
of
July
23,
1gg7
irorg",
term,
z0
min)
(v)
NREB
grid
disturbance
in
India
in
19g4
and
r9g7.
(vi)
Belgium,
Aug
4,
1992.
(longer
term,
4.5
min)
(vii)
Baltimore,
washington
DC,
usA,
5th
July
1990 (longer
rerm,
insecure
for
hours)
Hence,
a
full
understanding
of
voltage
stability
phenomena
and
designing
mitigation
schemes
to
prevent
voltase
instabilitv is nf o,raqr'or,,o +^,.+:r:a:^^
',
;,ilir;
;;,:;;
ffiri#il;";
;age
stability.
lf phenomena.
Becadse
of
this,
voltage
'ent
engineers.
Voltage
instabilitv
and
rterchangeably.by
many
."r"ur"h..r.
voltage
instability
or
co[apse
is
a
faster
dynamic-process.
As
opposed
to
angle
l#GrffiE
IE!F}ILfr
stability, the
dynamics mainly involves the loads and
the means
for voltage
control.
Ref
[11]
provides
a comprehensive list
of books,
reports, workshops
and
technical
papers
related to
voltage
stability and
security.
Definitions:
[2]
A
power
system at
a
given
operating state
is small-disturbance
voltage
stable
if, following
any small
disturbance,
voltages near
loads are identical
or close
to the
pre-disturbance
values. The concept
of small-disturbance
voltage
stability
is related to
steady-state
stability
(Chapter
12) and can
be analysed
using
small-
signal
(linearised)
model of the system.
A
power
system at a
given
operating state and
subject to
a
given
disturbance
ts voltage stable if voltages near loads
approach
post-disturbance
equilibrium
valuei.
The concept of
voltage
stability is related
to the ffansient
stability
of a
power
system.
The
analysis of
voltage
stability normally
requires
simulation
of
the system modelled
by
non-linear
diffdrential-algebraic
equations.
A
power
system
at
a
given
operating
state and subject
to a
given
disturbance
undergoes voltage
collapse
if
post-disturbance
equilibrium
voltages
are
below
acceptable limits. Voltage collapse may
be total
(blackout)
or
partial.
The
voltage
instability and collapse may occur in a time
frame
of a second.
In this
case the term transient voltage stability
is used. Sometimes
it may
take
up to
tens of minutes in which case the term long-term
voltage
stability
is used.
The
term voltage security means the ability
of a system,
not only
to
operate
stably, but also to remain stable following
any reasonably
crediblebontingency
or
adverse
system change such as load increases
[2].
Voltage stability involves dynamics,
but load flow
based static
analysis
methods are
generally
used for
quick
and
approximate
analysis.
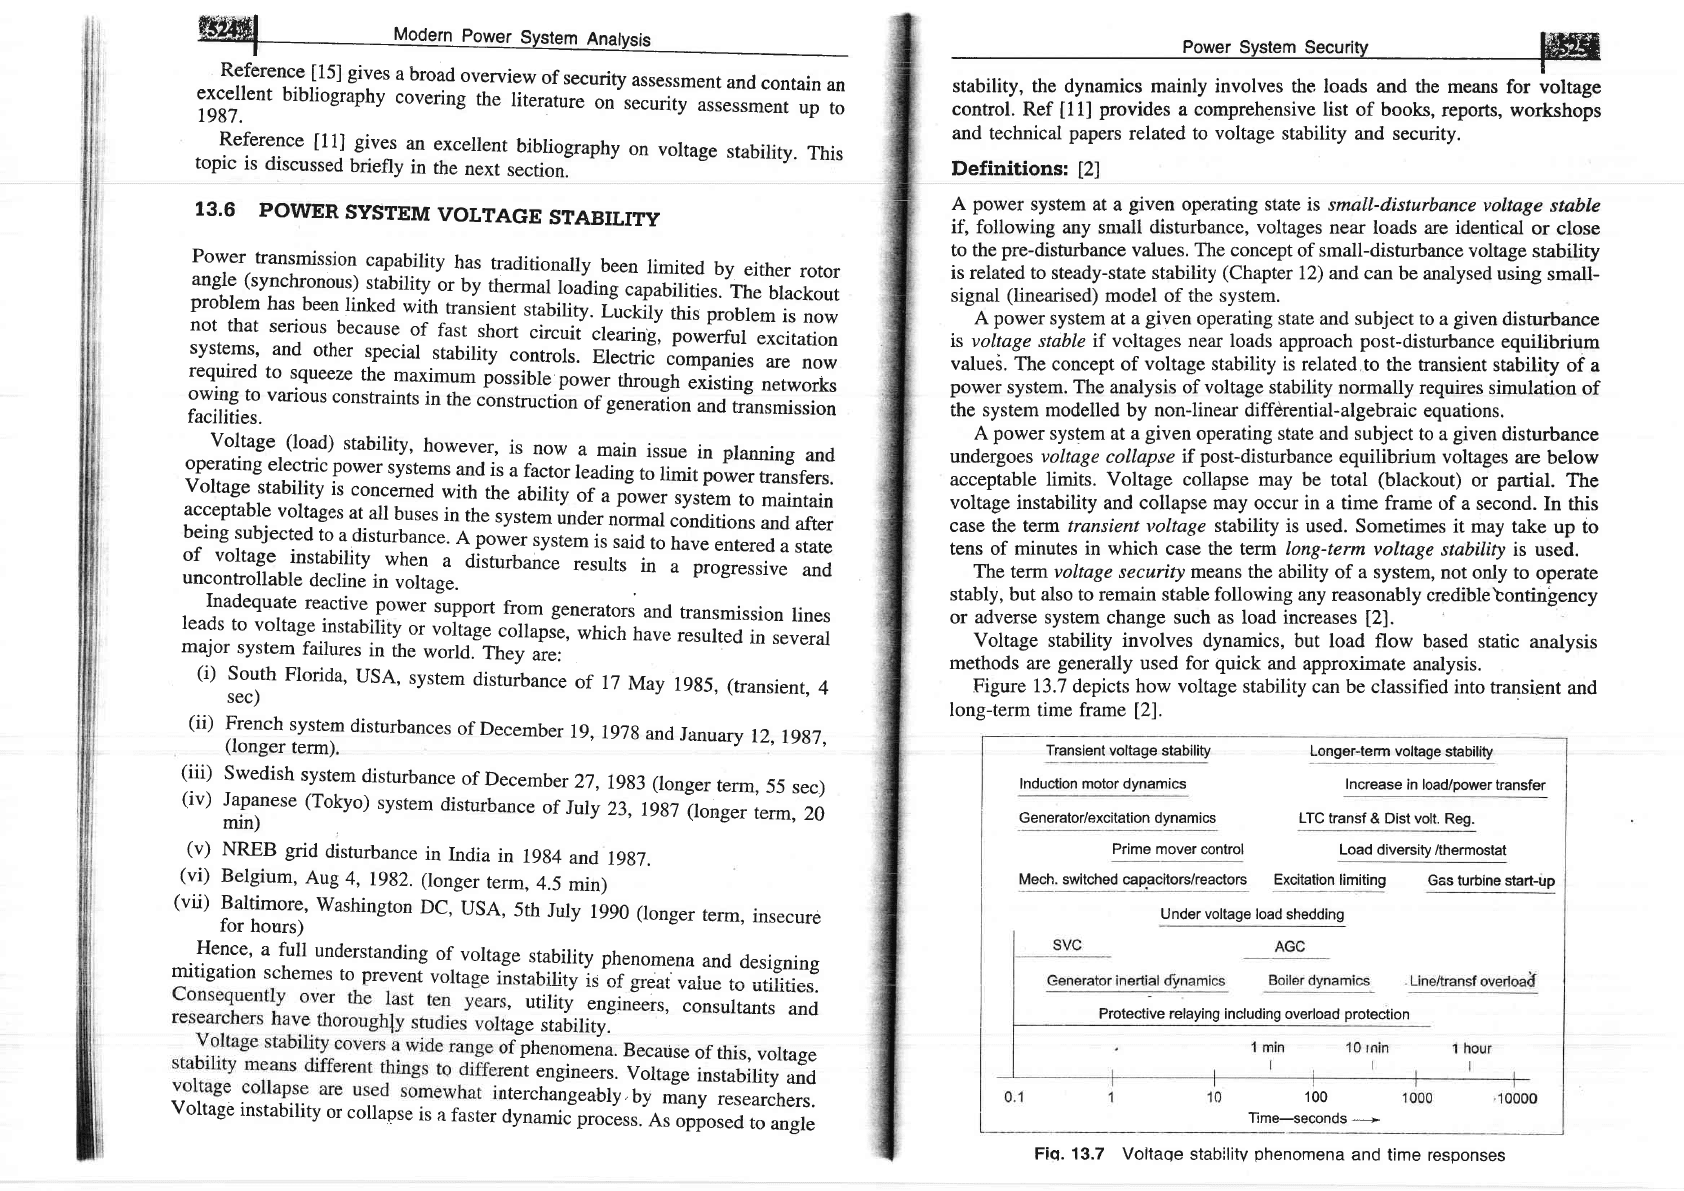
Figure
13.7
depicts how voltage stability
can be
classified into
transient
and
long-term time frame
l2l.
Transient
voltage stability
Longer-term
voltage
stability
Induction motor dynamics
Increase
in load/power
transfer
Generator/excitation dvnamics LTC
transf
& Dist volt. Reg.
Prime
mover control
Load diversity
/thermostat
Mech.
switched capacitors/reactors Excitation
limiting
Gas
turbine start-up
Under voltage load
shedding
100
Time-seconds
-
Protective relaying
including overload
protection
Fiq. 13.7 Voltage
stabilitV
phenomena
and
time
responses