McConnell Campbell R., Brue Stanley L., Barbiero Thomas P. Microeconomics. Ninth Edition
Подождите немного. Документ загружается.


chapter fourteen • the demand for resources 371
more than 26,000 ATMs are used
in Canada. We rank number one
in the world in ATM use, logging
53 transactions per Canadian
in 1997, followed by the United
State at 41.4 and Sweden at 37.6.
There are now 709,000 ATMs
worldwide.
ATMs are highly productive:
A single machine can handle
hundreds of transactions daily,
thousands weekly, and millions
over the course of several years.
ATMs can not only handle cash
withdrawals, but they can also
accept deposits and facilitate
switches of funds between vari-
ous accounts. Although ATMs
are expensive for banks to buy
and install, they are available
24 hours a day, and their cost
per transaction is one-fourth the
cost for human tellers. They
rarely get held up, and they do
not quit their jobs (turnover
among human tellers is nearly
50 percent per year). ATMs are
highly convenient; unlike human
tellers, they are located not only
at banks but also at busy street
corners, workplaces, universi-
ties, and shopping malls. The
same bankcard that enables you
to withdraw cash from your local
ATM also enables you to with-
draw pounds from an ATM in
London, yen from an ATM
in Tokyo, and even rubles from
an ATM in Moscow. (All this,
of course, assumes that you
have money in your account.)
In the terminology of this
chapter, the more productive,
lower-priced ATMs have reduced
the demand for a substitute in
production—human tellers. Be-
tween 1990 and 2000, 6000
human teller positions were
eliminated, and half the remain-
ing teller positions may be gone
by 2010. Where will the people
holding these jobs go? Most will
eventually move to other occu-
pations. Although the lives of
individual tellers are disrupted,
society clearly wins. Society
gets cheaper, more convenient
banking services and more of
the other goods that these freed-
up labour resources help to
produce.
Source: Based partly on Ben Craig,
“Where Have All the Tellers Gone?”
Economic Commentary (Federal
Reserve Bank of Cleveland), April.
15, 1997; and statistics provided by
the Canadian Bankers Association.
chapter summary
1. Resource prices act as a determinant of money
incomes, and they simultaneously ration
resources to various industries and firms.
2. The demand for any resource is derived
from the product it helps produce. That
means the demand for a resource will
depend on its productivity and on the market
value (price) of the good it is producing.
3. Marginal revenue product is the extra rev-
enue a firm obtains when it employs one
more unit of a resource. The marginal-
revenue-product curve for any resource is the
demand curve for that resource, because the
firm equates resource price and MRP in deter-
mining its profit-maximizing level of resource
employment. Thus, each point on the MRP
curve indicates how many resource units the
firm will hire at a specific resource price.
4. The firm’s demand curve for a resource
slopes downward, because the marginal
product of additional units declines in accor-
dance with the law of diminishing returns.
When a firm is selling in an imperfectly
competitive market, the resource demand
curve falls for a second reason: Product price
must be reduced for the firm to sell a larger
output. We can derive the market demand
curve for a resource by summing horizon-
tally the demand curves of all the firms hir-
ing that resource.
5. The demand curve for a resource will shift as
the result of (a) a change in the demand for,
and therefore the price of, the product the
resource is producing; (b) changes in the
productivity of the resource; and (c) changes
in the prices of other resources.

terms and concepts
372 Part Three • Microeconomics of Resource Markets
6. If resources A and B are substitutable for
each other, a decline in the price of A will
decrease the demand for B provided the sub-
stitution effect is greater than the output
effect. But if the output effect exceeds the
substitution effect, a decline in the price of A
will increase the demand for B.
7. If resources C and D are complementary or
jointly demanded, there is only an output
effect; a change in the price of C will change
the demand for D in the opposite direction.
8. The majority of the fastest growing occupa-
tions in Canada relate to computers or health
care.
9. The elasticity of demand for a resource
measures the responsiveness of producers to
a change in the resource’s price. The coeffi-
cient of the elasticity of resource demand is
E
rd
When E
rd
is greater than one, resource de-
mand is elastic; when E
rd
is less than one,
resource demand is inelastic; and when E
rd
equals one, resource demand is unit elastic.
10. The elasticity of demand for a resource will
be greater (a) the more slowly the marginal
product of the resource declines, (b) the
larger the number of good substitute
resources available, (c) the greater the elas-
ticity of demand for the product, and (d) the
larger the proportion of total production
costs attributable to the resource.
11. Any specific level of output will be produced
with the least costly combination of variable
resources when the marginal product per
dollar’s worth of each input is the same—
that is, when
=
12. A firm is employing the profit-maximizing
combination of resources when each re-
source is used to the point where its mar-
ginal revenue product equals its price. In
terms of labour and capital, that occurs
when the MRP of labour equals the price of
labour and the MRP of capital equals the
price of capital—that is, when
= = 1
13. The marginal productivity theory of income
distribution holds that all resources are paid
what they are economically worth: their mar-
ginal contribution to output. Critics assert
that such an income distribution is too
unequal and the real-world market imperfec-
tions result in pay above and below mar-
ginal contributions to output.
MRP of Capital
ᎏᎏ
Price of Capital
MRP of Labour
ᎏᎏ
Price of Labour
MP of Capital
ᎏᎏ
Price of Capital
MP of Labour
ᎏᎏ
Price of Labour
percentage change in resource quantity
ᎏᎏᎏᎏᎏ
percentage change in resource price
derived demand, p. 353
marginal product (MP), p. 355
marginal revenue product
(MRP), p. 355
marginal resource cost
(MRC), p. 356
MRP = MRC rule, p. 356
substitution effect, p. 361
output effect, p. 361
elasticity of resource demand,
p. 364
least-cost combination of
resources, p. 366
profit-maximizing
combination of resources,
p. 367
marginal productivity theory
of income distribution,
p. 369
study questions
1. What is the significance of resource pricing?
Explain how the factors determining resource
demand differ from those underlying product
demand. Explain the meaning and signifi-
cance of the fact that the demand for a re-
source is a derived demand. Why do resource
demand curves slope downward?
2.
KEY QUESTION Complete the follow-
ing labour demand table for a firm that is hir-
ing labour competitively and selling its prod-
uct in a competitive market.
a. How many workers will the firm hire if
the market wage rate is $27.95? $19.95?
Explain why the firm will not hire a larger
or smaller number of units of labour at
each of these wage rates.
b. Show in schedule form and graphically the
labour demand curve of this firm.

chapter fourteen • the demand for resources 373
c. Now redetermine the firm’s demand curve
for labour, assuming that it is selling in an
imperfectly competitive market and that,
although it can sell 17 units at $2.20 per
unit, it must lower product price by 5 cents
to sell the marginal product of each suc-
cessive labour unit. Compare this demand
curve with that derived in question 2b.
Which curve is more elastic? Explain.
Units Marginal
of Total Marginal Product Total revenue
labour product product price revenue product
00
_____
$2 $_____
$_____
117
_____
2 _____
_____
231
_____
2 _____
_____
343
_____
2 _____
_____
453
_____
2 _____
_____
560
_____
2 _____
_____
6 65 2 _____
3.
KEY QUESTION What factors deter-
mine the elasticity of resource demand? What
effect will each of the following have on the
elasticity or the location of the demand for
resource C, which is being used to produce
commodity X? Where there is any uncertainty
as to the outcome, specify the causes of that
uncertainty.
a. An increase in the demand for product X
b. An increase in the price of substitute re-
source D
c. An increase in the number of resources
substitutable for C in producing X
d. A technological improvement in the capi-
tal equipment with which resource C is
combined
e. A decline in the price of complementary
resource E
f. A decline in the elasticity of demand for
product X due to a decline in the competi-
tiveness of the product market
4.
KEY QUESTION Suppose the produc-
tivity of capital and labour are as shown in
the accompanying table. The output of these
resources sells in a purely competitive market
for $1 per unit. Both capital and labour are
hired under purely competitive conditions at
$3 and $1, respectively.
Units of MP of Units of MP of
capital capital labour labour
0
24
0
11
1
21
1
9
2
18
2
8
3
15
3
7
4
9
4
6
5
6
5
4
6
3
6
1
7
1
7
1
⁄2
88
a. What is the least-cost combination of
labour and capital the firm should employ
in producing 80 units of output? Explain.
b. What is the profit-maximizing combination
of labour and capital the firm should use?
Explain. What is the resulting level of out-
put? What is the economic profit? Is this
the least costly way of producing the
profit-maximizing output?
5.
KEY QUESTION In each of the follow-
ing four cases, MRP
L
and MRP
C
refer to the
marginal revenue products of labour and capi-
tal, respectively, and P
L
and P
C
refer to their
prices. Indicate in each case whether the condi-
tions are consistent with maximum profits for
the firm. If not, state which resource(s) should
be used in larger amounts and which re-
source(s) should be used in smaller amounts.
a. MRP
L
= $8; P
L
= $4; MRP
C
= $8; P
C
= $4
b. MRP
L
= $10; P
L
= $12; MRP
C
= $14; P
C
= $9
c. MRP
L
= $6; P
L
= $6; MRP
C
= $12; P
C
= $12
d. MRP
L
= $22; P
L
= $26; MRP
C
= $16; P
C
= $19
6. Florida citrus growers say that the recent
crackdown on illegal immigration is increasing
the market wage rates necessary to get their
oranges picked. Some are turning to $100,000
to $300,000 mechanical harvesters known
as “trunk, shake, and catch” pickers, which
vigourously shake oranges from the trees. If
widely adopted, what will be the effect on the
demand for human orange pickers? What does
that imply about the relative strengths of the
substitution and output effects?
7. (The Last Word) Explain the economics of the
substitution of ATMs for human tellers. Some
banks are beginning to assess transaction
fees when customers use human tellers rather
than ATMs. What are these banks trying to
accomplish?

374 Part Three • Microeconomics of Resource Markets
internet application questions
1. Go to Human Resource and Development
Canada at <www11.hrdc-drhc.gc.ca/jf-ea/
jf.prospects_by_current1?p_rating=1> to de-
termine the specific employment outlooks for
several occupations. For which job are
prospects good now but only fair in 2004?
2. Increases in employment reflect increases in
labour demand, accompanied by increases in
labour supply. Go the Bureau of Labour Sta-
tistics at <stat.bls.gov/top20.html> and select
International Labour Statistics (at the bottom).
Find the percentage increases in employment
for the United States, Japan, Germany, France,
Great Britain, Italy, and Canada for the most
recent 10-year period. Which three countries
have had the fastest growth of labour demand,
as measured by the employment outcome?
which three the slowest?

IN THIS CHAPTER
IN THIS CHAPTER
Y
Y
OU WILL LEARN:
OU WILL LEARN:
That wages are determined
by demand and supply forces.
•
About the effects of
monopoly power on the
demand and supply of labour.
•
The pros and cons of
a minimum wage.
•
The effects of labour
market discrimination.
•
The effects of immigration on
domestic labour markets.
Wage
Determination,
Discrimination,
and
Immigration
N
early 15 million of us go to work each
day in Canada. We work at an amazing
variety of jobs for thousands of differ-
ent firms for considerable differences in pay.
What determines our hourly wage or annual
salary? Why is the salary for, say, a top major
league baseball player $18 million a year,
whereas the pay for a first-rate schoolteacher
is $60,000? Why are starting salaries for uni-
versity graduates who major in engineering
and accounting so much higher than for grad-
uates majoring in journalism and sociology?
FIFTEEN

Having explored the major factors that underlie labour demand, we now bring
labour supply into our analysis to help answer these questions. Generally, labour sup-
ply and labour demand interact to determine the hourly wage rate or annual salary
in each occupation. Collectively, those wages and salaries make up about 70 percent
of the national income.
Economists use the term “labour” broadly to apply to (1) blue-collar and white-col-
lar workers of all varieties; (2) professional people such as lawyers, physicians, den-
tists, and teachers; and (3) owners of small businesses, including barbers, plumbers,
television repairers, and a host of retailers who provide labour as they carry on their
own businesses.
Wages are the price that employers pay for labour. Wages may take the form of
salaries, bonuses, royalties, or commissions. We will use the term “wages” to mean
the wage rate per hour, per day, and so forth. That usage will remind us that a wage
rate is a price paid per unit of labour services. It will also let us distinguish between
the wage rate and labour earnings, the latter being determined by multiplying the
number of hours worked per week, per month, or per year by the hourly wage or
wage rate.
We must also distinguish between nominal wages and real wages. A nominal
wage is the amount of money received per hour, per day, and so on. A real wage is
the quantity of goods and services a worker can obtain with nominal wages; real
wages reveal the purchasing power of nominal wages.
Your real wage depends on your nominal wage and the prices of the goods and
services you purchase. Suppose you receive an 8 percent increase in your nominal
wage during a certain year, but in that same year the price level increases by 5 per-
cent. Then your real wage has increased by 3 percent (= 8 percent minus 5 percent).
Unless otherwise indicated, we will assume that the overall level of prices remains
constant. In other words, we will discuss only real wages.
Wages differ among nations, regions, occupations, and individuals. Wage rates are
much higher in Canada than in China or India. Wages are slightly higher in the
south and west of Canada than in the north. Plumbers are paid less than NHL
hockey players, and lawyer Adam may earn twice as much as lawyer Bharti for the
same number of hours of work. Wage rates also differ by gender, race, and ethnic
background.
The general, or average, level of wages, like the general level of prices, includes
a wide range of different wage rates. It includes the wages of bakers, barbers, brick
masons, and brain surgeons. By averaging such wages, we can more easily compare
wages among regions and among nations.
As Global Perspective 15.1 suggests, the general level of real wages in Canada is
relatively high—although not the highest in the world.
The simplest explanation for the high real wages in Canada and other industri-
ally advanced economies (referred to hereafter as advanced economies) is that
the demand for labour in these nations is relatively large compared to the supply
of labour.
376 Part Three • Microeconomics of Resource Markets
Labour, Wages, and Earnings
nominal
wage
The
amount of money
received by a
worker per unit
of time (hour,
day, etc.).
real wage
The amount of
goods and services
a worker can pur-
chase with a nomi-
nal wage.
General Level of Wages
<www.internationalecon.
com/v1.0/ch40/
40c200.html>
The real wage
effects of free trade

The Role of Productivity
We know from the previous chapter that the demand for labour, or for any other
resource, depends on its productivity. Generally, the greater the productivity of
labour, the greater the demand for it. If the total supply of labour is fixed, then the
stronger the demand for labour, the higher the average level of real wages. The
demand for labour in Canada and the other major advanced economies is large
because labour in these countries is highly productive. There are several reasons for
that high productivity:
● Plentiful capital Workers in the advanced economies have access to large
amounts of physical capital equipment (machinery and buildings). The total
physical capital per worker in Canada is one of the highest in the world.
● Access to abundant natural resources In advanced economies, natural re-
sources tend to be abundant in relation to the size of the labour force. Some of
those resources are available domestically and others are imported from
abroad. Canada, for example, is richly endowed with arable land, mineral
resources, and sources of energy for industry.
● Advanced technology The level of technological progress is generally high in
advanced economies. Not only do workers in these economies have more cap-
ital equipment to work with but that equipment is also technologically supe-
rior to the equipment available to the vast majority of workers worldwide.
Work methods in the advanced economies are steadily being improved
through scientific study and research.
Hourly wages of
production workers,
selected nations
Wage differences are pro-
nounced worldwide. The
data shown here indicate
that hourly compensation in
Canada is not as high as in
some European nations. It is
important to note, however,
that the prices of goods and
services vary greatly among
nations, and the process of
converting foreign wages into
dollars may not accurately
reflect such variations.
15.1
048121620242832
Germany
Denmark
United Kingdom
Canada
Taiwan
Mexico
Hourly Pay in U.S. Dollars, 1999
Korea
Switzerland
Sweden
France
Italy
United States
Japan
Australia
Source: U.S. Bureau of Labor Statistics, <stat.bls.gov>, 2000.
chapter fifteen • wage determination, discrimination, and immigration 377
● Labour quality The health, vigour, education, and training of workers in
advanced economies are generally superior to those in developing nations,
which means that, even with the same quantity and quality of natural and cap-
ital resources, workers in advanced economies tend to be more efficient than
many of their foreign counterparts.
● Intangible factors Less tangible factors also may underlie the high produc-
tivity in some of the advanced economies. In Canada, for example, such fac-
tors include (1) the efficiency and flexibility of management; (2) business,
social, and political environments that emphasize production and productiv-
ity; and (3) the vast size of the domestic market, which enables firms to engage
in mass production.
Real Wages and Productivity
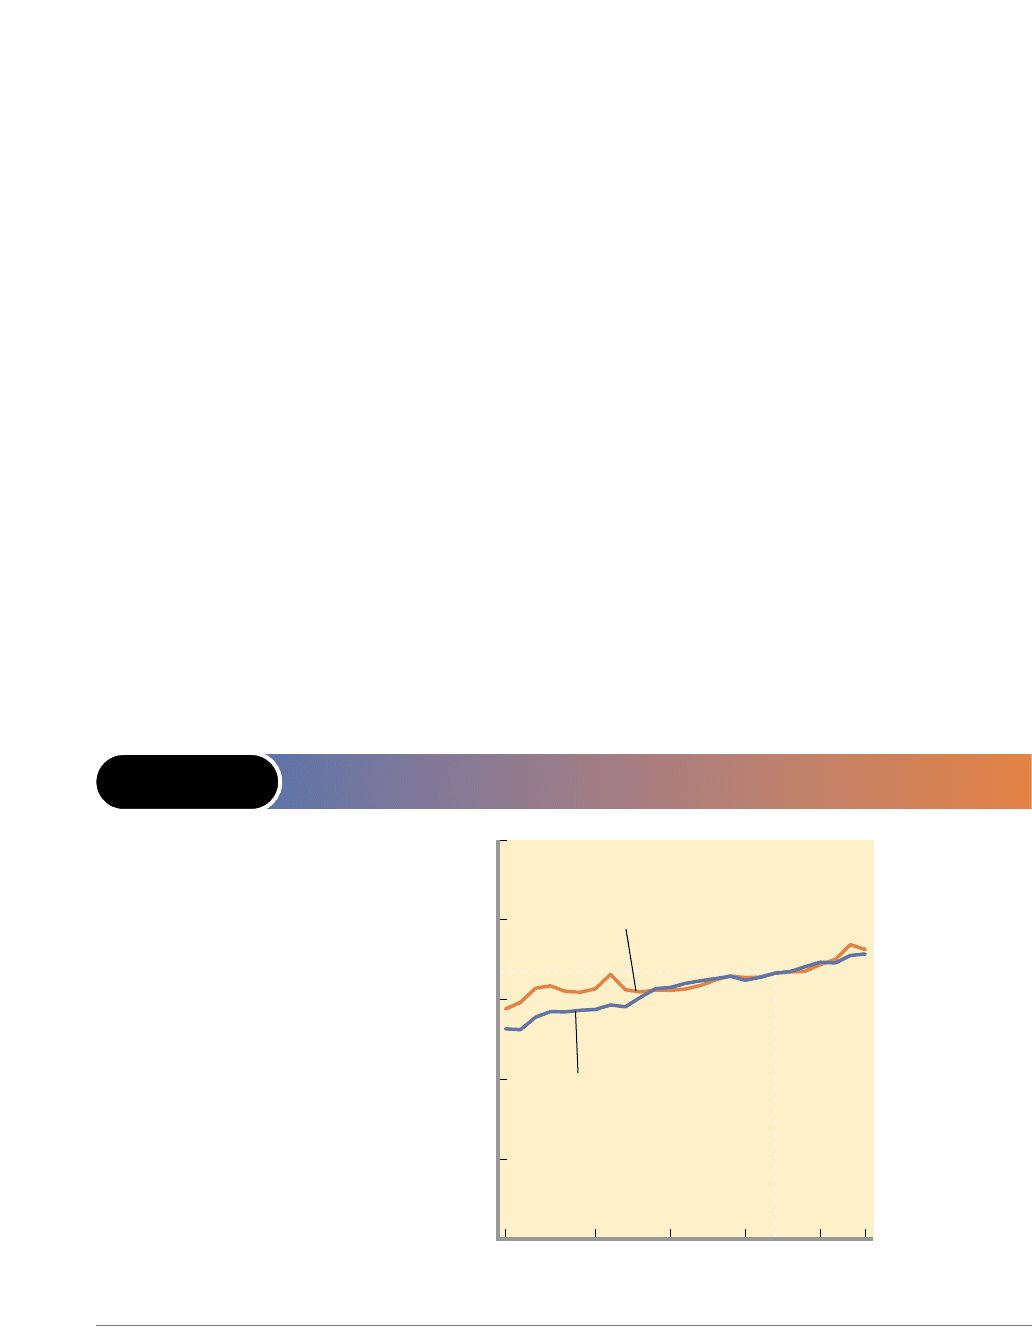
Figure 15-1 shows the close long-run relationship between output per hour of work
and real hourly earnings in Canada. Because real income and real output are two
ways of viewing the same thing, real income (earnings) per worker can increase
only at about the same rate as output per worker. When workers produce more
real output per hour, more real income is available to distribute to them for each
hour worked.
In the real world, however, suppliers of land, capital, and entrepreneurial talent
also share in the income from production. Real wages, therefore, do not always rise
in lockstep with gains in productivity over short spans of time. But over long peri-
ods, productivity and real wages tend to rise together.
378 Part Three • Microeconomics of Resource Markets
FIGURE 15-1 OUTPUT PER HOUR AND REAL HOURLY EARNINGS
IN CANADA
Index (1992 = 100)
Output per person-hour
Real compensation
per person-hour
0
30
60
90
100
120
150
199819951990198519801974
Over the years a
close relationship
exists between
output per hour of
work and real hourly
earnings.
Source: Statistics Canada.

Secular Growth of Real Wages
Basic supply and demand analysis helps explain the long-term trend of real-wage
growth in Canada. The nation’s labour force has grown significantly over the
decades, but, as a result of the productivity-increasing factors we have mentioned,
labour demand has increased more rapidly than labour supply. Figure 15-2 shows
several such increases in labour supply and labour demand. The result has been a
long-run, or secular, increase in wage rates and employment.
We now turn from the average level of wages to specific wage rates. What deter-
mines the wage rate paid for some specific type of labour? Demand and supply
analysis is again revealing. Let’s begin by examining labour demand and labour
supply in a purely competitive labour market. In this type of market
● Many firms compete with one another in hiring a specific type of labour.
● Each of numerous qualified workers with identical skills supplies that type of
labour.
● Individual firms and individual workers are wage-takers, since neither can
exert any control over the market wage rate.
Market Demand for Labour
Suppose 200 firms demand a particular type of labour, say carpenters. These firms
need not be in the same industry; industries are defined according to the products
they produce and not the resources they employ. Thus, firms producing wood-
framed furniture, wood windows and doors, houses and apartment buildings, and
wood cabinets will demand carpenters. To find the total, or market, labour demand
curve for a particular labour service, we sum horizontally the labour demand curves
(the marginal revenue product curves) of the individual firms, as indicated in Figure
15-3 (Key Graph). The horizontal summing of the 200 labour demand curves like d
in Figure 15-3(b) yields the market labour demand curve D in Figure 15-3(a).
chapter fifteen • wage determination, discrimination, and immigration 379
FIGURE 15-2 THE LONG-RUN TREND OF REAL WAGES IN CANADA
S
1900
S
1950
S
2000
S
2020
D
1900
D
1950
D
2000
D
2020
Real wage rate (dollars)
0
Q
Quantity of labour
The productivity of
Canadian labour has
increased substan-
tially over the long
run, causing the
demand for labour,
D, to shift rightward
(that is, to increase)
more rapidly than
increases in the
supply of labour, S.
The result has been
increases in real
wages.
purely
competitive
labour
market
A
resource market in
which a large num-
ber of (noncollud-
ing) firms demand
a particular type of
labour supplied by
a large number of
nonunion workers.
A Purely Competitive Labour Market
Choosing
a Little More
or Less

380 Part Three • Microeconomics of Resource Markets
a
b
($10)
W
c
0
Q
c
Q
(5)
Wage rate (dollars)
(b) Individual firm
Quantity of labour
e
c
s
= MRC
d
= mrp
($10)
W
c
Wage rate (dollars)
0
Q
c
Q
(1000)
Quantity of labour
(a) Labour market
S
D
= MRP
(Σ mrp’s)
In a purely competitive labour market (panel a), the equilibrium wage rate, W
c
, and the number of workers, Q
c
, are deter-
mined by labour supply S and labour demand D. Because this market wage rate is given to the individual firm (panel b)
hiring in this market, its labour supply curve s = MRC is perfectly elastic. Its labour demand curve is its MRP curve (here
labelled mrp). The firm maximizes its profit by hiring workers up to where MRP = MRC. Area 0abc represents both the
firm’s total revenue and its total cost. The green area is its total wage cost; the lavender area is its nonlabour costs,
including a normal profit—that is, the firm’s payments to the suppliers of land, capital, and entrepreneurship.
FIGURE 15-3 LABOUR SUPPLY AND LABOUR DEMAND
IN (PANEL A) A PURELY COMPETITIVE LABOUR
MARKET AND (PANEL B) A SINGLE COMPETITIVE FIRM
Key Graph
Quick Quiz
1. The supply of labour curve S slopes upward in graph (a) because
a. the law of diminishing marginal utility applies.
b. the law of diminishing returns applies.
c. workers can afford to buy more leisure when their wage rates rise.
d. higher wages are needed to attract workers away from other labour markets,
household activities, and leisure.
2. This firm’s labour demand curve d in graph (b) slopes downward because
a. the law of diminishing marginal utility applies.
b. the law of diminishing returns applies.
c. the firm must lower its price to sell additional units of its product.
d. the firm is a competitive employer, not a monopsonist.
3. In employing five workers, the firm represented in graph (b)
a. has a total wage cost of $6000.
b. is adhering to the general principle of undertaking all actions for which the
marginal benefit exceeds the marginal cost.
c. uses less labour than would be ideal from society’s perspective.
d. experiences increasing marginal returns.
4. A rightward shift of the labour supply curve in graph (a) would shift curve
a. d = mrp leftward in graph (b).
b. d = mrp rightward in graph (b).
c. s = MRC upward in graph (b).
d. s = MRC downward in graph (b).
Answers
1. d; 2. b; 3. b; 4. d