Middleton W.M. (ed.) Reference Data for Engineers: Radio, Electronics, Computer and Communications
Подождите немного. Документ загружается.


12-22
REFERENCE
DATA
FOR ENGINEERS
I
I
TRACE A
(MEASURED DATA)
CORRECTED
MEASUREMEN1
- -
TRACE
B
(AMPLITUDE CORRECTION
ERROR COEFFICIENTSI
Fig.
53.
Error
correction
by
arithmetic operations on multiple traces
COMPARATOR
lNPUT
1
INPUT
2
TRIGGER
LEVEL
MICROPROCESSOW
ARMING
Fig.
54.
Basic reciprocal counter.
To
make
a
simple period measurement, the shaded portion
is
used.
event pulses by time a trivial matter, and one not
needing a microprocessor. Modern counters use a
microprocessor to perform the division,
so
the gate can
be open over any arbitrary time. To make the measure-
ment, the input signal pulses are counted with one
circuit while the length of time the gate was open is
measured with another circuit. Additionally, an arming
signal can be used to control the timing of the measure-
ment if a particular portion of the signal is being
measured. The arrangement described is called a recip-
rocal counter (Fig.
54).
The resolution of the frequency measurement in a
reciprocal counter is determined by the resolution of a
time measurement. If a counter can resolve time to
1
ns,
9
digits of frequency resolution can be displayed given a
1-second measuring time. This same counter will
provide
3
digits given a
I-ps
measuring time. A more
recent resolution extension technique employs continu-
ous
count signal processing.
A
truer average of the
frequency can be calculated if the signal is sampled
multiple times during the measurement period; up to
I2
digits of resolution in a 1-second measurement time can
be obtained with 1-ns time resolution.
Microwave frequencies can be measured with the
same counter architectures, but usually some form of
frequency conversion needs to be used, because the
counter logic typically is limited to operation below
500
MHz.
One approach is
to
use a prescaler. This is simply
a very fast counter placed between the comparator and
the gating logic.
A
3-GHz
divide-by-32 prescaler (a
five-bit counter) brings the count rate down to a
maximum of below
100
MHz, and the microprocessor
multiplies the count by
32
for
proper display.
A sampler can also be used
to
mix down the signal
to
a more countable rate. This is a harmonic heterodyne
down-conversion technique. A relatively low-frequency
local-oscillator signal is sent through a step recovery
diode
to
generate microwave-frequency harmonics for
the sampler to use. The microwave input signal is mixed
down, and the resulting intermediate frequency is
counted. The microprocessor is used to dither the
local-oscillator frequency
to
determine which harmonic
came into play
so
that it can add the proper frequency
offset for display. This technique can be used for
microwave and millimeter-wave frequencies. It has the
advantage
of
added frequency resolution because the

MEASUREMENTS AND ANALYSIS
I
:-
10MHz
+
TlME
BASE
12-23
EVENT
-
COUNTER
MICROPROCESSOW
DISPIAY
WN
C
H
R
0
N
0
US
TlME
----t
COUNTER
phase is preserved, but the act of finding the proper
harmonic number slows the measurement. Also, confu-
sion can be introduced if multiple signals are present,
so
sometimes a tuned YIG filter is used to preselect the
signal. For pulsed microwave signals, a detector is
added to form a signal that the counter uses to open and
close the gate properly.
Frequency and Time-Interval
Analysis
A
new class of instruments allows further analysis of
time and frequency. These instruments share similari-
ties with the counter, but have several significant
differences. First, the instrument does not have a gate,
so
the counter circuits are constantly counting the input
and time-base signals. The contents of the counters are
read synchronously and stored into memory. From two
sets of these readings, a frequency measurement can be
effectively constructed. This architecture
is
called
con-
tinuous count
(Fig.
55).
The first advantage of continuous-count architecture
is that a frequency measurement can now be construct-
ed from several
contiguous
samples, and by using a
least-squares fit or other algorithm, a truer estimate of
frequency can be made.
The second advantage
is
the ability to store these
samples into a deep memory. This allows for the
analysis of time-varying signals, such as the measure-
ment
of
the step response of a voltage-controlled
oscillator (Fig.
56A).
If the signal is being frequency or
phase modulated (either to carry data or
to
make the
signal spread-spectrum), the modulation pattern can be
displayed in a frequency-vs-time or phase-vs-time man-
ner (Figs.
56B
and
56C).
If required, the modulation
can be displayed in an eye diagram form. The maximum
INPUT
1
INPUT
2
ARMING
u
Fig.
55.
Continuous-count architecture.
TIME
(A)
VCO step-response measurement.
HISTOGRAM
I-
I
FREQUENCY
(0)
Freqqencyhopping radio channel usage
Fig.
56.
Continuous-count
measurements.
I
I
TIME
(Bj
FSK shown
In
a frequency eye diagram
HISTOGRAM
TIME
(C) Phase coded radar
signal
TlME
(E)
Clock-to-data
per.
60Hz
WQUENCY
(Fj
Jltter specfrum showlng power-supply nolse

12-24
REFERENCE DATA FOR ENGINEERS
modulation rate that can be analyzed is governed by the
sample rate of the counter,
or
how often the counters are
read into memory. Note that phase-modulation mea-
surement is possible only because the signal is sampled
continuously.
The measurements can also be stored and analyzed in
histogram form (Figs.
56D
and
56E).
This can be
useful for analyzing a frequency-agile signal. Note that
these measurements cannot be easily done with a
spectrum analyzer.
If the parameter being measured is time
or
time
interval, the histogram can show information
on
data-
to-data or clock-to-data jitter. The information in the
memory can also be passed through an FFT to show
jitter spectrum (Fig. 56F). These measurements are
useful
in
the design
of
high-speed computers, telecom-
munications systems
~
and magnetic storage systems.
RF
AND MICROWAVE POWER
MEASUREMENTS
A
common technique for measuring power at high
frequencies
is
to employ a sensing element that converts
the RF power
to
a measurable dc
or
low-frequency
signal. The sensing element is often designed to form a
termination that is matched to the characteristic imped-
ance
(Z,)
of the input transmission line. Various types
of sensing elements are used.
Thermistor Sensors
Thermistor sensors provide a change of resistance.
The typical power range is
1
pW to 10 mW; the
maximum frequency is greater than
100
GHz.
Fig.
57A
shows a typical power sensor employing thermistors.
The thermistors form the termination for the RF input,
and dc
or
audio power from the self-balancing bridge in
Fig.
57B
raises the temperature of the thermistors until
they each have a resistance of
2Z0.
The RF impedance
then becomes equal to
Zo.
Since the bridge keeps the thermistor resistance
constant, any heat added by the RF power causes a
corresponding reduction in bias power. The RF power
level
is
determined by measuring this change in bias
power.
Thermal
Converters
Thermal converters provide a dc voltage (less than
10
mV). The typical power range is
0.1
to
100
mW; the
maximum frequency is less than
1
GHz.
Thermal
converters employ a number of thermocouples (thermo-
pile) mounted with good thermal contact to the RF
termination (Fig.
58).
The
RF
power heats the termina-
tion, and the thermopile output voltage is proportional
to the amount of power dissipated. The converter can be
calibrated by applying a precisely known dc
or
RF
power level at the input. This calibration yields the
value of
C.
TO
BOLOMETER
BRIDGE
9
(A)
Thermistor
sensor
BIAS
+
(El
Self-balancing
bridge
Fig.
57.
Power
measurement
with
thermistor sensor.
Fig.
58.
Thermal converter.
Thermocouple Sensors
Thermocouple sensors provide a dc voltage (less than
10
mV). The typical power range
is
0.1
pW
to
100
mW; the maximum frequency
is
greater than
100
GHz.
Thermoelectric sensors differ from thermal converters
in that the thermocouples are used as the terminating
resistors (Fig.
59).
This type of sensor must be calibrat-
ed with a precise RF power level to determine the value
of
c.
Diode Sensors
Diode sensors provide a dc voltage (approximately
1
V
at
10
mW). The typical power range is
0.
I
nW
to
10
mW; the maximum frequency is greater than
18
GHz.

12-25
<
PRF
I
Fig.
59.
Thermocouple
sensor
ZO
I
i1
Fig.
60.
Diode
power
sensor.
Diode power sensors (Fig.
60)
use point-contact or
Schottky barrier diodes to detect the
RF
signal. If the
RF voltage is less than
20
mV, the diode output follows
the square of the applied voltage,
so
the dc voltage is a
function
of
RF
power. At higher levels, the rectified
output gradually changes to the more familiar peak-
detection mode, and harmonics in the signal can cause
errors in the power reading. Diode sensors must be
calibrated with a precise RF signal level to determine
the value
of
C.
Power- Measurement
Definitions
Maximum Available Power,
P,,
-The power ob-
tainable from a source when it is terminated in a load
whose impedance is the complex conjugate of the
source impedance. This condition
is
usually obtained
by installing a tuning device between the source and the
power sensor and adjusting the tuner for a peak in the
power reading.
2,
Available Power,
Pzo
-The power obtainable
from a source when it is terminated with a load matched
to
the
Z,
of
the transmission line. The
Zo
available
power
is
related
to
the maximum available power by:
where
pg
=
lrg
1
Power Incident Upon the Load,
q-The amount
of power the source transmits toward the load is usually
measured by use of a directional coupler connected
such that its coupled output is governed by the wave
emerging from the source. The incident power is related
to the
Zo
available power by:
pi
=
p20/li
-
rgrL/2
Power Reflected
by
the Load,
P,-This power is
usually measured by using a directional coupler con-
nected such that its coupled output is governed by the
amount of power reflected by the load. The reflected
power is related to the incident power by:
P,
=
PL2P,
Power Dissipated in a Load,
Pt-The power
dissipated in the load is related to the other power levels
by
:
PL
=
p,
-
P,
=
P,(1
-
pL2)
Source and Load Reflection Coefficients,
rs
and
rL-Some of the foregoing equations refer to the
match
of
the source and load impedance to the charac-
teristic impedance of the transmission line. Values
of
reflection coefficients
rg
and
rL
are given by:
Pg
=
Irgl
PL
=
PLI
Effective Efficiency,
q-Efficiency
of
a power
sensor
is
defined as
where,
Psub
is the dc substituted or RF calibration power,
Po
is the amount of power dissipated
in
the sensor.
Calibration Factor,
KB-Calibration factor is re-
lated to efficiency by:
where
p
is the magnitude
of
the reflection coefficient of
the sensor.
Multiple Mismatch Error,
M,
-The precise
amount of power dissipated in the sensor
is
a function
of
many variables, the largest one being the interaction of
the source and load reflections. Fig.
61
can be used
to
estimate the worst-case uncertainty for a simple source-
to-load power measurement. In the example shown, an

12-26
m
SOURCE
“Pi
”
NETWORK
.%e
“
REFERENCE
DATA
FOR ENGINEERS
,.,.
pRX
Rx
--
Fig.
61.
Mismatch uncertainty limits
r
4
SOURCE
“Ps
-
-
(A)
Source
and iood
Fig.
62.
Insertion
loss
or
gain.
SWR of
1.54
interacting with an SWR of
1.24
intro-
duces about a 0.2-dB uncertainty.
M,
=
(1
2
PgPL)-2
MICROWAVE-LINK ANALYSIS
Insertion
Loss
or Gain
Insertion
loss
or
gain is defined as the
loss
or
gain
that is apparent upon inserting the network to be
measured between a given source and a given receiver.
In
Fig. 62,
P,
is the transmitted power
of
the source, and
PR
is the received power. In Fig. 62A, it is clear that
PR
=
Ps,
but in Fig. 62B, the value
OfPR
is
modified by
the insertion
of
the network. This change in power is the
insertion
loss
or
gain and is usually quoted in decibels:
Insertion
Loss
or
Gain
=
10
logl0(PR/Pr)
Amplitude Response
Amplitude response is sometimes referred
to
as
“flatness”
or
frequency response and is the variation in
gain
or
loss
with change in frequency over a defined
frequency band. While
it
may be thought that this
12-27
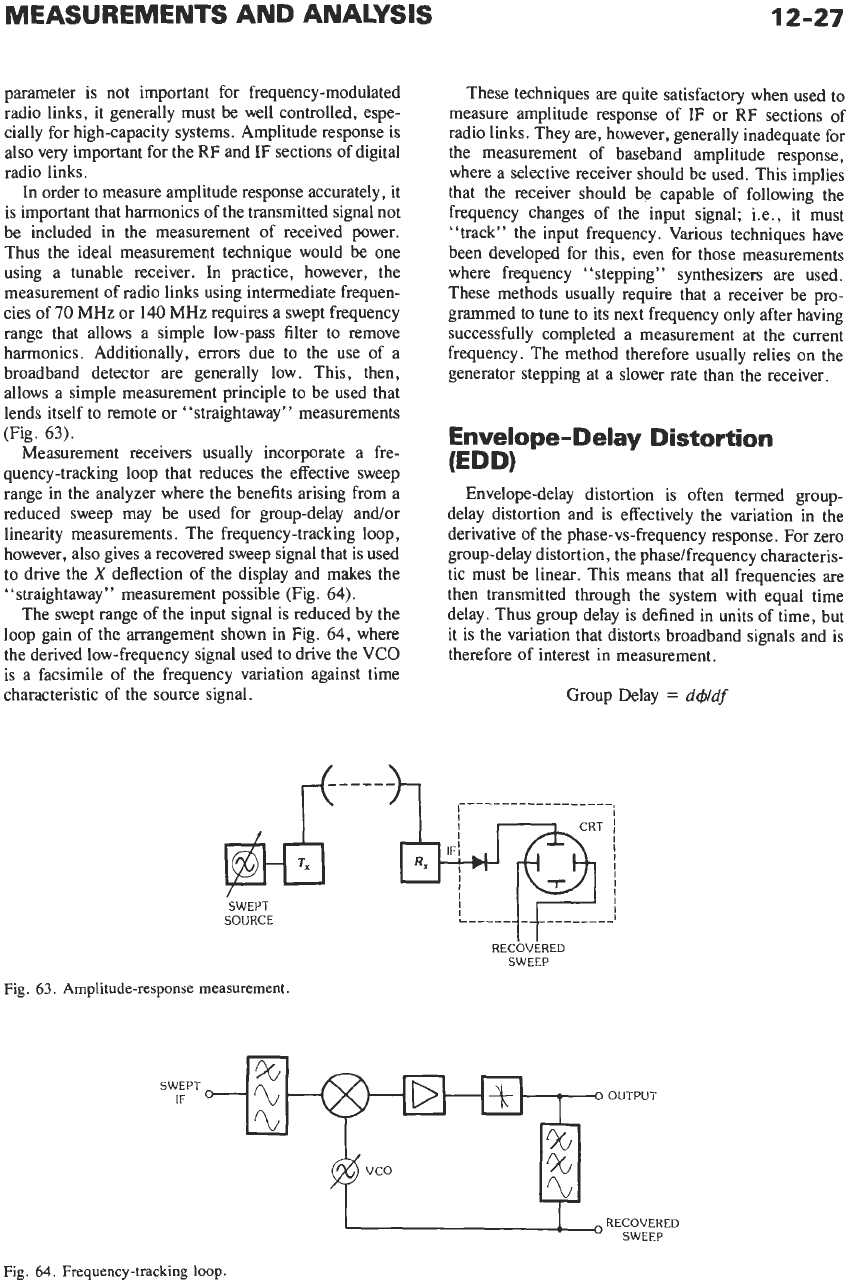
parameter is not important for frequency-modulated
radio links, it generally must be well controlled, espe-
cially for high-capacity systems. Amplitude response is
also very important for the RF and
IF
sections of digital
radio links.
In order to measure amplitude response accurately, it
is important that harmonics of the transmitted signal not
be included in the measurement of received power.
Thus the ideal measurement technique would be one
using a tunable receiver. In practice, however, the
measurement of radio links using intermediate frequen-
cies of
70
MHz or 140 MHz requires a swept frequency
range that allows
a
simple low-pass filter to remove
harmonics. Additionally, errors due to the use of a
broadband detector are generally low. This, then,
allows a simple measurement principle to be used that
lends itself
to
remote or “straightaway” measurements
(Fig.
63).
Measurement receivers usually incorporate a fre-
quency-tracking loop that reduces the effective sweep
range in the analyzer where the benefits arising from a
reduced sweep may be used for group-delay and/or
linearity measurements. The frequency-tracking loop,
however, also gives a recovered sweep signal that is used
to drive the
X
deflection of the display and makes the
“straightaway” measurement possible (Fig.
64).
The swept range of the input signal is reduced by the
loop gain of the arrangement shown in Fig.
64,
where
the derived low-frequency signal used to drive the
VCO
is a facsimile of the frequency variation against time
characteristic of the source signal.
These techniques are quite satisfactory when used
to
measure amplitude response of
IF
or RF sections of
radio links. They are, however, generally inadequate for
the measurement of baseband amplitude response,
where a selective receiver should be used. This implies
that the receiver should be capable of following the
frequency changes
of
the input signal; i.e., it must
“track” the input frequency. Various techniques have
been developed for this, even for those measurements
where frequency “stepping” synthesizers are used.
These methods usually require that a receiver be pro-
grammed to tune to its next frequency only after having
successfully completed a measurement at the current
frequency. The method therefore usually relies on the
generator stepping at a slower rate than the receiver.
Envelope-Delay
Distortion
(ED0
Envelope-delay distortion is often termed group-
delay distortion and is effectively the variation in the
derivative of the phase-vs-frequency response. For zero
group-delay distortion, the phaselfrequency characteris-
tic must be linear. This means that all frequencies are
then transmitted through the system with equal time
delay. Thus group delay is defined in units of time, but
it is the variation that distorts broadband signals and is
therefore of interest in measurement.
Group Delay
=
d@df
RECOVERED
SWEEP
Fig.
63,
Amplitude-response measurement.
SWEPT
IF
OUTPUi
Fig.
64.
Frequency-tracking loop.

12-28
REFERENCE
DATA
FOR ENGINEERS
The nonlinear phase characteristic of Fig.
65
will
give rise to distortion of a broadband signal that will
manifest itself in the form of noise and intermodulation
for analog systems, The group-delay response derived
from Fig.
65
will be
of
the form shown in
Fig.
66.
As
can
be
seen, there
is
a mean level
of
group delay that is
not
very
important; it is the variation of distortion that
must be equalized.
Equalization is achieved by means
of
networks that
give inverse group-delay variations. The most common
types required are those that compensate for linear
group-delay slope or parabolic group-delay distortion.
It
is
important that equalizers
be
connected as close
as
possible
to
the source of group-delay distortion
or
at
least that
no
nonlinear networks be connected before
the equalizer. This is because nonlinearities that intro-
PHASE
(0)
duce amplitude-to-phase-modulation conversion will
produce effects that cannot be removed by group-delay
equalization.
Measurement
of
Group-Delay
Distortion
There are several methods for the measurement
of
group-delay distortion, but the basis is usually that of
comparing the phase
of
an output modulation envelope
with the phase of a reference signal. The usual method
employs a frequency-modulated signal that is swept over
the frequency band
of
interest. Use
of
a phase-locked
loop at the receiver makes possible the recovery
of
the
frequency modulation, which then
is
used
to give the
variation in phase as the input signal
is
swept (Fig.
67).
Fig.
65.
Phase versus frequency slope.
GROUP DELAY
(rg).
(dmld,)
VARIATION OVER
IF
BAND
FREQUENCY
(jl
IF
BAND
Fig.
66.
Group-delay
distortion.
SWEPT
FM
SIGNA1
PHASE-
A
CONTROLLED
"
OSCILLATOR
AFC
LOOP
B
-
BASEBAND
SlGFiAL
RECOVERED
SWEEP
Fig.
67.
Measurement
of
group-delay
distortion

It was shown earlier that a frequency-tracking loop
could be used to recover the sweeping signal for the
X
deflection of the CRT. Additionally, the tracking loop
reduces the swept range of the received IF signal
so
that
distortions arising from the nonideal nature of networks
in
the receivers are minimized. For example, a signal
that is used to test a radio link may sweep over a band of
more than
30
MHz but will be sweep reduced
in
the
analyzer to yield a sweep range of less than
100
kHz.
Consequently, the errors introduced by the analyzer are
minimized. The phase-locked loop in the group-delay
measurement then uses the demodulated baseband fre-
quency to control the phase of its reference oscillator,
which will be held at the mean phase of the modulating
frequency. Variations in phase are then available at
point
B
in Fig.
67.
Another way of looking at this
is
to say that if point A
represents the reference phase of the modulating signal,
then going backward around the double integrating loop
means that the signal at point
B
is the derivative of this
phase, or
dq5/dt.
In this system, however, time is the
same as frequency, because as time proceeds, the
IF
is
swept; hence the instantaneous value of the dc voltage at
B
represents the group delay
(dq5/o!f)
at the instanta-
neous value of the IF.
The reason for using a phase-tracking detector is that
it is always working very close to zero phase difference
between the inputs. This means that the phase detector
is always working on the central part of its dc/phase
conversion slope, and nonlinearity of this response does
not affect the measurement.
The measurement of group-delay distortion involves
the careful selection of several test parameters:
Sweep range
Sweep rate
Modulation frequency (test tone)
Modulation index
Post-detection bandwidth
It is important to select a sweep range appropriate for
the device or system under test. Some consideration
should be given to the spectrum of the modulating
signal, since the device under test will be subjected to
the total spectrum. This is usually important only where
a high-frequency test tone
(>
1
MHz) is used, but
it
can
be important for testing components such as narrow-
band filters with lower test-tone frequencies.
The sweep rate employed is often in the range of
50
to
100
Hz, but this range may not be suitable for systems
such
as
satellite communication links where use
of
a
lower sweep rate will allow a narrow bandwidth to be
selected for the post-detection bandwidth. This will
then enhance the measurement resolution by reducing
noise power.
The modulation frequency used is a compromise
between two conflicting effects:
2.
Use of too low a frequency will produce a low
voltage at the output of the group-delay detector,
and the signal-to-noise ratio of the display will be
poor.
1.
Use of too high a frequency will tend to conceal
rapid fluctuations in group delay such as the ripple
produced by imperfect impedance matching.
It is therefore usual to select frequencies between
50
kHz and
500
kHz to give an appropriate compromise.
There are cases, however, where much higher modula-
tion frequencies can be used. This is usually true when
either television or broadband telephone systems are
carried and the test signal has to reveal low values of
nonlinearity that produce intermodulation. In these
cases, the measurement sensitivity is enhanced by using
a modulation frequency between
1
MHz and
12
MHz.
In using these high frequencies, it is not appropriate to
refer to the measurement as a group-delay measure-
ment, but rather as a measurement of “differential
phase.
”
In practice, this measurement is not as important as
the measurement of “differential gain,” which can be
very useful in tracing problems of amplitude-to-phase
modulation conversion.
Television systems are often measured with a test-
tone frequency equal to the television color subcarrier
frequency. The measurement of differential phase is
then used
to
define system performance.
Differential gain is an extension of the measurement
of linearity that uses techniques similar to those for
group delay, but, whereas this reveals how the phase for
the modulation envelope varies, linearity shows how the
amplitude of the envelope varies. The same measure-
ment principle is applied to modulators and demodula-
tors to measure nonlinearity of the voltage/frequency
characteristic. It is interesting to note that for a nonline-
arity occurring in a discriminator or modulator, the
measured nonlinearity will be relatively independent of
the modulation frequency employed. This contrasts
with the case for IF nonlinearities where the distortion
value changes with the square of the change in test-tone
frequency. This property may then be used in analyzing
system deficiencies.
It can be valuable to be able to separate key charac-
teristics that contribute significantly to intermodulation
distortion. Table
1
shows the relative effects of distor-
tion styles to give an approximate indication of which
shapes are most serious.
Table
1
does not show the effects of the “coupled”
responses where amplitude-to-phase modulation con-
version interacts with distortions in other parameters,
but these interactions can have a serious effect in
high-capacity radio systems. Additionally, nonflatness
can be important, especially for digital radio systems.
Return
Loss
In
the alignment of microwave radio links, it is
important that the impedance match of the various
sections be well maintained. This is especially impor-
tant where cabling is used between a source and a load,
since any mismatch will produce time-delayed reflec-

12-30
SWEPT
IF
SOURCE
REFERENCE
DATA
FOR ENGINEERS
-
11
TABLE
1.
DISTORTION
FOR
IOO-PW
INTERMODULATION NOISE
(1
800-CHANNEL SYSTEM WITH PREEMPHASIS)
1‘
SWEEP
Parameter
Distortion
Over
10
MHz
~-
Test
Tone
Differential-Gain Slope
1%
2.4
MHz
Differential-Phase Slope
3%
rad
2.4
MHz
Group-Delay Slope
2
ns
-
Group
Delay, Cubic
3.5
ns
-
Group
Delay, Parabolic
14
ns
-
UNDER
TEST
DETECTOR
I-
AND
CRT
-
Fig.
68.
Return-loss
measurement
by
long-cable method.
tions that may impair link performance. The normal
way of describing the mismatch of a source and load is
by using the term “return loss.” Return
loss
is the
measure of the ratio between the transmitted and
reflected signals:
Return
loss
=
20
loglo
IEiIE,l
where,
E,
is the incident signal,
E,
is the reflected signal.
Return
loss
is a measure of the magnitudes of incident
and reflected signals and does not take account of phase
relationships.
Measurement
of
Return
Loss
Long-Cable Method-In this method, a “long
cable” is connected to the termination under test as
shown in Fig.
68.
When the swept IF signal is applied to
the long cable
and
its
termination, a series
of
ripples
will appear
on
the CRT display. If the test termination is
removed, the open circuit produces a large amplitude of
ripple that is then adjusted by the attenuator to equal the
level when the termination is connected. The return
loss
is equal to
2
times the attenuation inserted.
Note that the cable must be long enough to produce
at least one ripple over the swept range, but more than
ten are required to observe variations across the band.
Thus, for normal
IF
measurements, a length in excess
of
20
meters
is
required.
Standard-Mismatch Method-This method (Fig.
69)
relies
on
the measurement
of
power passed from a
hybrid when it is terminated by a
known
mismatch and
then by the test item.
A
typical mismatch of
17
dB
is
used to calibrate the power meterldetector, after which
the actual return
loss
may be measured directly.
Baseband Measurements
Most of the above measurements are made at the
intermediate frequency (IF) of the radio system or at the
microwave carrier frequency. Obviously, some meas-
urements such as modulator linearity also involve the
direct use of baseband inputs, but there
is
an additional
class of measurements that define system performance
and are carried out at baseband level. The most obvious
IF
SOURCE DISPLAY
T
17
dB
MISMATCH.
THEN
I
I
TEST
LOAD
w
I
Fig.
69.
Measurement
of
return
loss
by
standard-mismatch
method.

12-31
of these is the measurement of baseband amplitude/
frequency response, but checks for spurious frequencies
should also be made. These measurements can be made
with special instruments that provide spectrum analysis.
For multichannel telephony systems, the prime con-
cern is to minimize the level of noise in each channel.
There can be many sources of noise, but they are mainly
either thermal
or
caused by cross talk
or
intermodula-
tion. Thermal noise is not affected by the traffic level
(loading) of the system, whereas intermodulation dis-
tortion
is
sensitive to loading. The system designer
therefore attempts to define a loading level at which
intermodulation noise is low and yet the ratio of signal
level
to
thermal noise is also satisfactory.
In
order to verify that the correct balance of thermal
and intermodulation noise is obtained, it is necessary to
be able to simulate the traffic load and then measure the
effects
in
channels throughout the baseband. This
is
achieved by using a band of thermal noise to represent
the traffic.
controlling noise bandwidth are prescribed by the
various telecommunications authorities.
Noise
Power
Ratio- When the system has been
loaded with noise to simulate traffic,
it
is then necessary
to measure intermodulation noise. This is done by
introducing a quiet “slot” into the noise band. This
slot
is then inspected to determine the level of noise
introduced by intermodulation. This is known as the
measurement of noise power ratio (NPR), which may be
defined as the ratio of the noise power in a measurement
channel with the baseband fully loaded to the noise
power in that channel when the baseband is noise-
loaded except for the measurement channel.
In
Fig. 70,
fl
(Fig. 70A) represents the power in the measurement
channel due to the loading signal,
Pz
(Fig. 70B) would
equal zero
for
the ideal case where there is no thermal
noise
or
intermodulation noise, and
P3
(Fig. 70C) shows
the effect that these noise components will have. Thus,
NPR
=
PI
if3
Noise
Loading-Traffic simulation using a band of
thermal noise is possible because the amplitude distri-
bution of such noise is Gaussian and the’power-versus-
c
s
2
frequency spectrum is uniform. This latter characteris-
tic is analogous to white light,
so
the band of noise used
In order to simulate a given traffic load, the formula
normally used to calculate the noise power required is
a
Z
w
to simulate traffic is often referred to as “white noise.”
K
w
E
0
Mean noise power
=
-
15
+
IO
logloN
FREQUENCY
where,
Mean noise power
is
in
dSm0 (power in dBm
(Ai
Measurement chonnel
referred to a point of zero relative transmission
level),
c
6
,2
N
is the number of telephone channels.
v)
Y
For this formula to be valid,
N
must be greater than
240,
because as the noise bandwidth
IS
reduced to simulate
high-capacity systems, the signal departs significantly
from a Gaussian distribution. The formula then used
is
Mean noise power
=
-
1
+
4
logloN
c
3
W
FREQUENCY
where,
Mean noise power is in dBmO,
N
is less than
240.
Modem systems may,
of
course, be loaded with data.
In
this case, a modified formula is used:
(Bi
Quiet
“slot”
Introduced.
P
Mean noise power
=
-10
+
10
logloN
where,
Mean noise power is in dBm0,
Data loading
N
is greater than
12
channels.
It is necessary to limit the noise bandwidth to
represent the bandwidth of the system. Filters for
(Cj
Effect
of
thermal
and
inierrnodulatron
noise
Fig.
70.
Principle
of
NPR
measurement.