Muga G. Time in Quantum Mechanics - Vol. 2
Подождите немного. Документ загружается.

8 Experiments on Quantum Transport of Ultra-Cold Atoms in Optical Potentials 213
λ
/4
from Dye Laser
50/50
to Scope
λ
/2
AOM 2
AOM 3
Spatial
Filter
Spatial
Filter
AOM 1
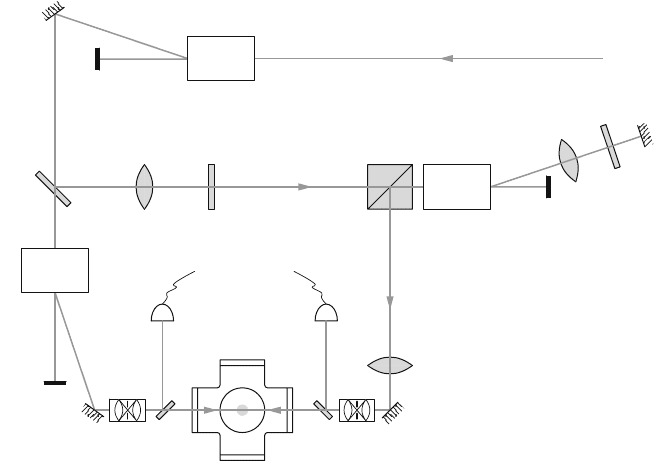
Fig. 8.3 Schematic of the interaction beam setup. AOM1 (40 MHz) provides the global control
of the intensity. AOM3 is a double-passed, 40 MHz AOM shifting the beam frequency down by
twice its drive frequency without leading to an appreciable angular deflection. AOM2 is in the
single-passed configuration shifting down the beam frequency by 80 MHz
both passes through the AOM was still overlapped with the incoming beam regard-
less of the deflection angle. To separate the backreflected from the incoming beam
the polarization was rotated along the path with a quarter-wave plate (λ/4) so that
a polarization beam splitter cube could be used for separation. To compensate for
the frequency offset of 80 MHz introduced by AOM3, the frequency in the sec-
ond arm was down-shifted by AOM2, also by 80 MHz. The frequency difference
between both beams was therefore 2Δν. After passing through the acousto-optic
modulators each beam was spatially filtered. The resulting transverse beam intensity
profiles were approximately Gaussian with a beam radius of about 2 mm. The size
and divergence of the beams were matched to avoid transverse spatial interference
fringes, which could have created local variations of the well depth. A small part
of each beam was diverted onto a photodiode to measure the optical power (the
calibration accuracy was about 10%).
8.4 Quantum Transport
The system of ultra-cold atoms in a periodic optical potential offers a unique means
of studying solid state effects with quantum optics tools. In order to gain insight
into the possibilities for experiments, some of the basic properties of this system
214 M.C. Fischer and M.G. Raizen
will be reviewed. A thorough treatment of the fundamental properties can be found
in many solid state textbooks, such as Ashcroft and Mermin [2] or Marder [30]. The
specifics of our system are described more thoroughly by Fischer [11].
8.4.1 Stationary Lattice
We created the optical potential by spatially overlapping two counterpropagating
light beams (k
L
≡ k
2
=−k
1
), which yields q = k
2
− k
1
= 2k
L
. Choosing the
same frequency for both beams simplifies the effective Hamiltonian in Eq. (8.12) to
H =
p
2
2M
+ V
0
cos
(
2k
L
x
)
, (8.22)
assuming that beam propagation is along the x-axis. This form of the Hamiltonian is
a textbook example for a particle placed in a spatially periodic potential, and many
general properties of this system can be derived by symmetry arguments alone. The
most fundamental properties are expressed in Bloch’s theorem. It states that the
eigenstates ψ(x) of this Hamiltonian take on the form of a plane wave multiplied by
a function u(x) of periodicity d =
π
k
L
=
λ
2
(the periodicity of the potential):
ψ
n,k
(x) = e
ikx
u
n,k
(x) , (8.23)
where k is the quasi-momentum of the particle. The index n is called the band
index and appears in Bloch’s theorem because for a given k there are many solu-
tions to the Schr
¨
odinger equation. An important consequence of Bloch’s theorem
is that the wave functions and the energy dispersion of the particle are periodic in
quasi-momentum (reciprocal) space with a periodicity of K =
2π
d
= 2k
L
in recip-
rocal space. Another property of paramount importance concerns the mean velocity
of a particle in a particular Bloch state ψ
n,k
. It can be shown that the velocity is
determined by the energy dispersion relation as
ν
n
(k) =
1
∂ E
n
(k)
∂k
, (8.24)
in analogy to the free particle case [2].
The problem of finding the energy eigenstates of H, that is solving H|ψ=
E|ψ, is equivalent to solving Mathieu’s equation [1]. Sample dispersion curves
(energy versus the quasi-momentum k) were calculated and plotted in Fig. 8.4. For
a vanishing well depth V
0
the dispersion curve is the free particle energy parabola
E(k) =
2
k
2
2M
. For a finite well depth V
0
, the lowest crossing points of the free energy
parabolas at k =±k
L
develop a level repulsion due to the coupling of the levels by
the potential term. The amount of repulsion in this avoided level crossing can easily
8 Experiments on Quantum Transport of Ultra-Cold Atoms in Optical Potentials 215
(c)
(a)
(b)
–6 –4 –2 0 2 4 6
0.0
0.5
1.0
1.5
2.0
2.5
3.0
k/k
L
k/k
L
–6 –4 –2 0 2 4 6
0.0
0.5
1.0
1.5
2.0
2.5
3.0
–6 –4 –2 0 2 4 6
0.0
0.5
1.0
1.5
2.0
2.5
3.0
E/E
0
E/E
0
E/E
0
E/E
0
E/E
0
E/E
0
0.0 0.5 1.0
0.0
0.5
1.0
1.5
2.0
2.5
3.0
0.0 0.5 1.0
0.0
0.5
1.0
1.5
2.0
2.5
3.0
–1.0 –0.5
–1.0 –0.5
–1.0 –0.5
0.0 0.5 1.0
0.0
0.5
1.0
1.5
2.0
2.5
3.0
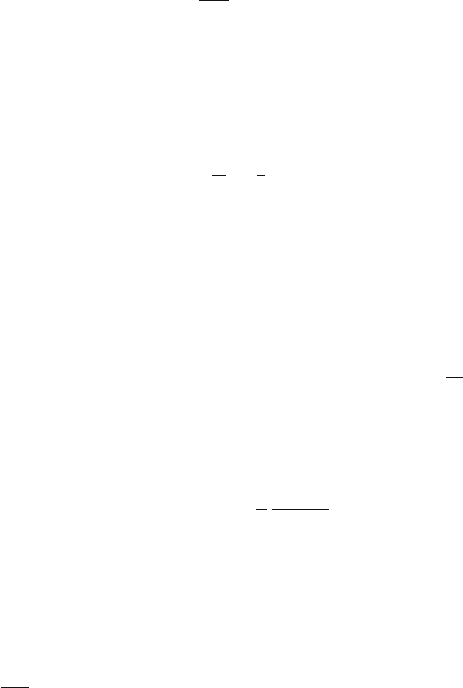
Fig. 8.4 Dispersion curves of a particle in a sinusoidal potential. Plotted here are the energy (in
units of E
0
= 8 ω
r
, ω
r
being the recoil energy) versus the quasi-momentum k (in units of k
L
)
in the repeated-zone scheme (left panels) and in the reduced-zone scheme (right panels). The well
depth V
0
/h of the potential is (a)0,(b)40kHz,and(c) 200 kHz
be estimated by first-order degenerate perturbation theory. The eigenenergies of the
coupled system are
E
1,2
=
2
k
2
L
2M
±
1
2
V
0
. (8.25)
The energy splitting for the first crossing and therefore the width of the first band gap
is,tofirstorderinV
0
, equal to V
0
itself. The coupling term cos(2k
L
x) connects only
states with a difference in momentum of 2 k
L
. For the calculation of the splitting
at higher crossing points, we therefore need to resort to perturbation expansions of
higher order.
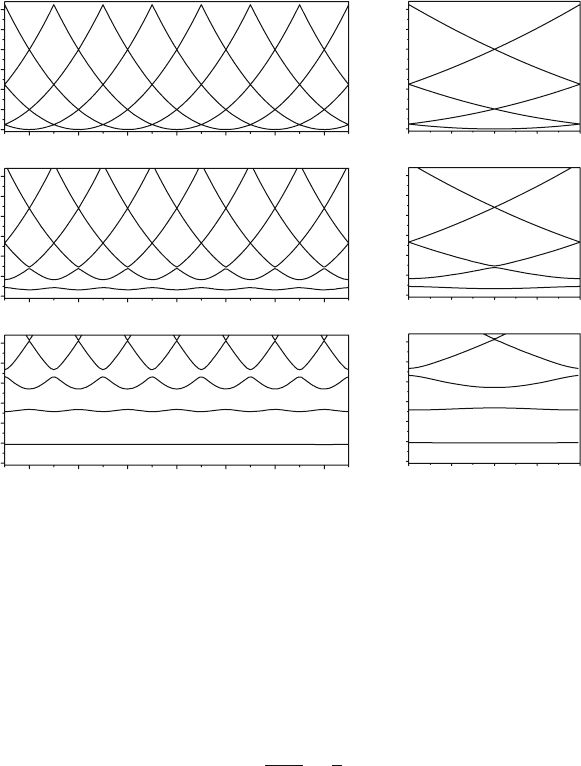
The energy values evaluated at the band edges as a function of the well depth V
0
have been determined numerically and are displayed in Fig. 8.5. From this figure
one can see that the energy bands evolve from a continuum of allowed energies, for
a vanishing well depth, into the linearly spaced discrete energy levels of a harmonic
oscillator, in the limit of large well depth.
216 M.C. Fischer and M.G. Raizen
0 100 200 300 400 500
0
200
400
600
800
E/h [kHz]
V
0
/h [kHz]
Fig. 8.5 Regions of allowed (gray) and restricted (white) energy in the periodic potential as a
function of the well depth. The energy is measured relative to the bottom of the well. Indicated as
a dashed line is the top edge of the potential (2V
0
)
8.4.2 Accelerating Lattice
For the system of electrons in a crystal lattice, the most commonly encountered
perturbation is an applied static electric field. This seemingly simple perturbation
leads to a very rich system, whose properties were controversial for quite some time.
Experimental tests in the field of solid state physics were hindered by decohering
processes such as scattering of the electrons on impurities in the crystal lattice or
scattering among themselves. These effects are negligible in our atom optics sys-
tem and we were able to contribute to this field by studying some of the effects
previously inaccessible to experiment.
8.4.2.1 Semiclassical Equations of Motion
A static electric field, which exerts a strong force on the electrons in a crystal, does
not have the desired effect on a neutral atom in an optical potential. However, we can
simulate the corresponding force by introducing an appropriate time dependence of
the optical lattice. Let us consider an optical lattice composed of two counterpropa-
gating light beams of unequal frequencies. A constant acceleration of the “standing”
wave pattern is generated by linearly chirping the frequency difference of these
counterpropagating beams. This is described by φ(t) = k
L
at
2
in Eq. (8.12), where
a is the acceleration. Inserting this into the Hamiltonian yields
H =
p
2
2M
+ V
0
cos
2k
L
x −
1
2
at
2
. (8.26)

8 Experiments on Quantum Transport of Ultra-Cold Atoms in Optical Potentials 217
To make the connection to the solid state system, one can transform Eq. (8.26) to
the frame of reference accelerated with the potential by applying a unitary transfor-
mation, following Peik et al. [36], resulting in
˜
H =
p
2
2M
+ V
0
cos(2k
L
x) + Ma x . (8.27)
The last term containing the mass M of the atom is an inertial term, resulting from
the transformation to an accelerating frame of reference. It mimics the role of the
interaction potential U
el
= Eex between an electric field E and the electron of
charge e. Having established this connection, we can directly apply the results for
the solid state system to an atom in the accelerated optical potential. A derivation
of the semiclassical equations of motion for small electric fields can be found in
standard textbooks [2, 30] and are simply stated here without proof. They express
the relationship of the state’s quasi-momentum k, band index n, energy E
n
(k), and
mean velocity v
n
(k). By replacing the force F = e E with F = Ma, we obtain the
following statements:
1. The band index n is a constant of motion.
2. The expression for the velocity in Eq. (8.24) remains unchanged and the evolu-
tion of the quasi-momentum is described by
˙
k
n
(t) =−
1
Ma . (8.28)
3. The form of the band structure E
n
(k) is unchanged.
The restriction of small fields deserves special attention. The statement that the
band index is a constant of motion indicates that inter-band transitions are being
neglected. However, for larger fields electrons can tunnel across the band gap. An
estimate for a “small” field strength is given by Ashcroft and Mermin as E
E
2
g
ev
F
,
with v
F
being the typical electron velocity in the originating band and E
g
being the
minimum energy separation of the perturbed levels [2]. In our system this transforms
to a condition for the acceleration
a
E
2
g
2
k
L
, (8.29)
where v
r
= k
L
/M serves as the typical velocity at the edge of the Brillouin zone.
Since for higher band indices the gaps get smaller and the velocity gets higher, a
dramatic increase in the tunneling probability is to be expected. A more detailed
study of tunneling across band gaps will be provided in Sect. 8.5.

218 M.C. Fischer and M.G. Raizen
8.4.2.2 Bloch Oscillations and Wannier–Stark States
One remarkable consequence of the equations of motion stated above is that parti-
cles exposed to a static field are predicted to oscillate in space rather than increase
their velocity steadily. As can be seen by integrating Eq. (8.28), the quasi-momentum
increases linearly with time as
k(t) = k
0
−
Mat
. (8.30)
The velocity of the particle with a given quasi-momentum k is given by Eq. (8.24)
as the derivative of the dispersion curve at the point k. Since E
n
(k) is oscillatory in
reciprocal space and k varies linearly with time, the velocity v
n
(t) is oscillatory in
time. The period of oscillation τ
B
is the time it takes for a particle to traverse the
Brillouin zone of width K = 2k
L
and calculates to
τ
B
=
2k
L
Ma
=
2v
r
a
. (8.31)
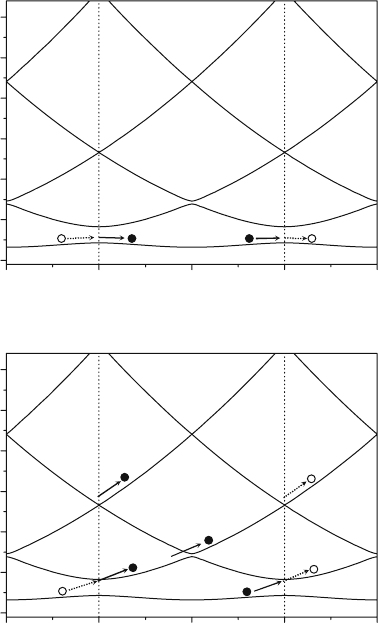
A sketch of these Bloch oscillations is graphically depicted in Fig. 8.6(a). An atom
starting in the lowest band of the potential will increase its quasi-momentum k due to
the applied force, as given by Eq. (8.30). As it approaches the edge of the Brillouin
zone at a constant rate ∂
t
k, the velocity decreases as the slope of the dispersion curve
decreases. At k = k
L
the derivative ∂
k
E
0
(k) is zero and according to Eq. (8.24) the
particle is at rest. It will then reverse its velocity and continue its motion, until the
velocity is reversed again at the next minimum of the dispersion curve. The reversal
of its velocity at k = k
L
can be viewed as a first-order Bragg reflection of the
particle wave by the periodic potential. The arguments above also hold for atoms
in higher bands. They oscillate at the same Bloch frequency. However, the velocity
reversal in higher bands corresponds to a higher order Bragg scattering process. It
is important to note that this reversal of the atomic velocity occurs relative to the
accelerated frame. In the laboratory frame the constant acceleration of the potential
is superimposed on the oscillation of the atom.
For a higher field strength (or acceleration, in the atom optics system) the particle
might not be able to follow the dispersion curve adiabatically as it approaches the
edge of the Brillouin zone. It can cross the band gap and continue its motion in
a higher band, as indicated in Fig. 8.6(b). This corresponds to a tunneling process
through the band gap, in which case the semiclassical equations stated above no
longer hold. For a particle undergoing tunneling, the transformation back to the
laboratory frame reveals no change of velocity at all. The particle is simply lost out
of the potential and can no longer track the acceleration.
The Bloch bands of an atom in a stationary potential are, by definition, con-
tinuous regions in the energy spectrum. Bloch oscillations in an accelerated lattice
reveal themselves in the energy spectrum as discrete peaks with an energy separation
of hν
B
, where ν
B
= 1/τ
B
. This is a consequence of the Bloch bands splitting up
into discrete Wannier–Stark states. A physical interpretation of these states can be
8 Experiments on Quantum Transport of Ultra-Cold Atoms in Optical Potentials 219
0.0
0.5
1.0
1.5
2.0
2.5
3.0
E/E
0
k/k
L
(a)
–2 –1 0 2
1
0.0
0.5
1.0
1.5
2.0
2.5
3.0
E/E
0
k/k
L
(b)
–2 –1 0 21
Fig. 8.6 Sketch of a particle trajectory in reciprocal space. In the upper panel (a) the rate of change
of the quasi-momentum is slow enough for the particle to follow the dispersion curve adiabatically
across the Brillouin zone boundary. This is equivalent to discontinuing the motion at one edge
of the Brillouin zone and emerging from the other side in the same band. The lower panel (b)
illustrates a case for a larger force, where the particle cannot follow the curve and tunnels through
the band gap
obtained by regarding the transition between bands as a temporal interference effect.
Quantum mechanically, atoms can tunnel between bands at all positions within the
Brillouin zone. Since Bloch oscillations lead to multiple passes through the Brillouin
zone, transition amplitudes can interfere constructively or destructively, depending
on the rate at which the particle traverses the Brillouin zone. This is in analogy to the
optical interference pattern generated by a plane wave of light illuminating an array
of slits or a grating. The temporal interference produces sharp resonances spaced
at the (temporal) grating period τ
B
. The more traversals of the Brillouin zone the
220 M.C. Fischer and M.G. Raizen
particle completes, the sharper the resonance becomes. If the particle tunnels out
of the band quickly, the resonances are broad, indicating a short lifetime of the
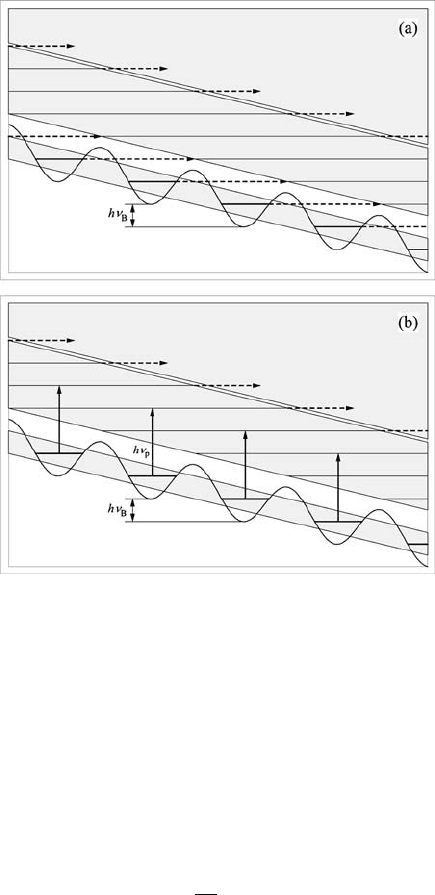
associated state. The tunneling out of a bound state is enhanced by the presence of a
Wannier–Stark state of the same energy, but in a higher band and displaced by one
or more lattice sites. This situation is depicted in Fig. 8.7(a).
Fig. 8.7 Schematic of the Wannier–Stark ladder within the bands. In (a) the tunneling process is
indicated. The presence of a Wannier–Stark state in the continuum of the higher band enhances
the tunneling probability across the gap. In (b) a weak spectroscopic drive couples the states and
introduces transitions. In either case, once an atom is in the second band, it can easily tunnel across
successive band gaps into higher bands
Krieger and Iafrate [23] also consider the possibility of driving transitions between
bands with an external alternating probe field. Assuming that the transition due to
the probe drive is the dominant loss process from the first band (neglecting tunnel-
ing), they obtain a resonance condition for the drive frequency ν
p
ν
p
=
¯
E
g
h
+nν
B
, (8.32)
8 Experiments on Quantum Transport of Ultra-Cold Atoms in Optical Potentials 221
where
¯
E
g
is the average band separation. Here, the driving field provides a direct
spectroscopic tool to probe the lattice structure of the Wannier–Stark states by allow-
ing transitions between the states, as indicated in Fig. 8.7(b).
8.4.3 Band Spectroscopy and Wannier–Stark Ladders
In our experiments the initial atomic distribution was approximately Gaussian with
a width of σ
x
= 0.3 mm in position and σ
p
= 6 k
L
in momentum. However, to
be able to study tunneling and transitions between single bands, an initial condition
with only one populated band, preferably the lowest, was desired. If we suddenly
turn on the optical potential within the atomic distribution, only a fraction of the
atoms are transferred into the lowest band [35]. Most atoms will be projected into
higher index bands. The location of the bands relative to the potential is indicated in
Fig. 8.5. For a typical well depth of V
0
/h = 70 kHz, we can see that atoms in the
lowest band are trapped within the potential wells, whereas atoms in the second band
are only partially trapped. Atoms in even higher bands have energies well above the
potential and hence are effectively free. The location of the bands with respect to the
potential well can be regarded as an indicator for the tunneling rates between bands
when an acceleration is applied. Bands that lie entirely within the wells have a much
smaller tunneling rate than bands outside the range of the potential. To empty all
but the lowest band, we took advantage of this difference in tunneling rates across
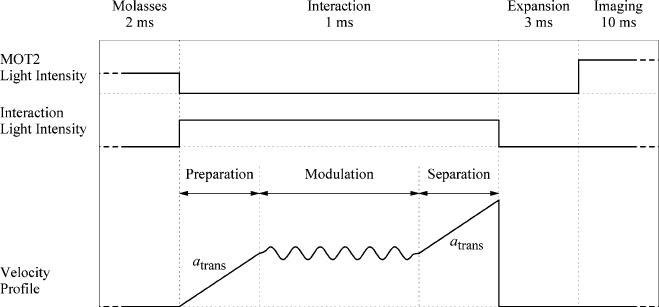
successive band gaps. After turning on the standing wave, it was accelerated to a
velocity of v
0
= 40 v
r
, as indicated in Fig. 8.8. During this acceleration the atoms
in the first band performed a sequence of Bloch oscillations within the potential
and were accelerated in the laboratory frame. Atoms in higher bands could tunnel
through the successively smaller band gaps and were lost out of the potential. The
transport acceleration a
trans
was chosen to maximize tunneling out of the second
band while minimizing losses from the first trapped band. For typical experimental
parameters of V
0
/h = 70 kHz and a
trans
= 2000 m/s
2
, the Landau–Zener expres-
sion derived in Sect. 8.5 for the lifetime of the first and second band yields 24 ms
and 40 μs, respectively. This ensured that after 600 μs of acceleration only the first
band still contained a significant number of atoms.
For band spectroscopy experiments the frequency chirp was stopped after reach-
ing the velocity v
0
and the frequency difference was held constant. At that point,
a phase modulation at the frequency of ν
p
was added to one of the two counter-
propagating beams forming the standing wave, as indicated in Fig. 8.8. This phase
modulation could drive transitions between bands, if the band separation for some
value of k was close to E = hν
p
. The modulation typically lasted for 500 μs and
was switched on and off smoothly over 16 μs to avoid any discontinuous phase
changes in the potential that could induce transition to higher bands. The amplitude
of the modulation was chosen to be small enough to not perturb the band structure.
In order to study Wannier–Stark states experimentally a constant acceleration of
the optical potential was necessary. Therefore the frequency chirp was not stopped
222 M.C. Fischer and M.G. Raizen
Fig. 8.8 Interaction beam timing diagram for the band spectroscopy experiments. After the
molasses stage the resonant light is turned off and the optical lattice was turned on. A subset
of atoms is projected into the fundamental band and separated in velocity by an acceleration a
trans
.
After this preparation stage, the optical lattice position and amplitude are varied to realize the
potential under study. This step is followed by separating the atoms in the lowest band from those
in higher bands by the same acceleration a
trans
. The atoms are then allowed to expand freely in the
dark and the spatial distribution is illuminated with the resonant molasses light
during the modulation time but was adjusted to yield the desired value of the accel-
eration a. To spectroscopically investigate the states, we superimposed the phase
modulation at frequency ν
p
onto this frequency chirp.
After a fixed time interval the modulation was turned off and the frequency chirp-
ing resumed at a rate corresponding to a
trans
. This separated in momentum space the
remaining trapped atoms in the lowest band from those having made the transition
into higher bands. After reaching a final velocity v
final
= 80 v
r
, the interaction beams
were switched off suddenly.
In the detection phase we needed to distinguish three classes of atoms: (1) atoms
that were not initially trapped in the lowest band and immediately tunneled out of
the well during the initial acceleration, (2) atoms which were trapped in the first
band at the beginning of the interaction but were driven out by the modulation,
and (3) atoms that remained in the first band during the entire sequence. Since
the atoms in different classes had left the trapping potential at different stages of
the experimental sequence, they were accelerated to different velocities. Therefore,
after drifting in the dark for 3 ms, these classes separated in space and could be
distinguished by recording their position. For this purpose the atoms were imaged
in the “freezing molasses” as described in Sect. 8.2. A typical fluorescence image of
the atoms is shown in Fig. 8.9(a). The two-dimensional image was then integrated
in the direction perpendicular to the axis of the interaction beams to obtain a one-
dimensional distribution along the beam direction, containing all three classes of
atoms. The corresponding integrated distribution is shown in Fig. 8.9(b). In order to
reduce sensitivity to fluctuations of the number of atoms in the MOT, the number of
survivors (atoms in class (3)) was normalized by the total number of atoms initially