Navarra Antonio, Simoncini Valeria. A Guide to Empirical Orthogonal Functions for Climate Data Analysis
Подождите немного. Документ загружается.


3.4 Estimating the Mean State and Variance 27
In addition, how does the situation change when we take a sample of a correlation
coefficient over 30 years? The question we are trying to answer by taking that sam-
ple is: if the same background climate state were to continually operate and generate
an infinite number of years of interannual variability, what would the correlation
between the two variables be? In other words, the population is an imaginary in-
finite set of realizations generated from a given background climate state. For the
purposes of making inferences (see statistical significance section below), we must
assume that the correlation coefficient was stationary over the 30 year period itself.
3.4 Estimating the Mean State and Variance
A critical step in climate analysis is nearly always the estimation of the background
mean state. Given the data x
1
; :::; x
n
, the mean, or average, is given by
Nx D
1
n
n
X
iD1
x
i
:
The computation of the mean is crucial to allow estimation of climate anomalies,
given by the deviation from the mean, that is,
x
0
i
D x
i
Nx:
The climate anomaly represents the departure from the assumed population mean at
a given time for a given time series. If there is a systematic bias in the estimation of
the mean from one location to another, this can introduce bias in the covariance of
anomalies between the two series; see later chapters for a more detailed discussion.
Most widely available datasets have given careful consideration to the estimation of
the mean from which anomalies are calculated.
For the background mean state for a dataset, the dataset creator will have con-
sidered such features as the period with best data coverage. If one is working
with the subsequent anomaly dataset, one still has to make a choice over which
years to run your analysis. This requires careful consideration and some experi-
mentation, because of multi-year (decadal and beyond) variability in the climate
system. Choice of period can greatly impact the amount of variance represented
by a decadal mode of variation. For example, an analysis over West Africa for
1971–2000 contains little decadal variability, whereas 1950–1980 is dominated by
a decadal fluctuation.
The sample variance of the observed data is defined as
s
2
D
1
n 1
n
X
iD1
.x
i
Nx/
2
:

28 3 Basic Statistical Concepts
In particular, we note the multiplicative factor
1
n1
, as opposed to the more intu-
itive factor
1
n
. The new factor allows the variance defined above to represent an
unbiased estimator of the population variance; see Clarke and Cooke (1998). To in-
tuitively explain this fact, we note that in s
2
there are n 1 degrees of freedom,
rather than n, because x
1
; :::; x
n
are related via the mean Nx. Therefore, roughly
speaking, the division by n 1 takes into account the actual number of degrees of
freedom in the data.
The variance provides a measure of dispersion of data around the mean. The
larger the variance, the more spread the data. It is important to remark that the
variance is expressed in the square of the data measure unit. For this reason, its
square root s, called the standard deviation, is also referenced. Both statistics in-
troduced above are dimensional quantities. To be able to perform a meaningful
comparison among data expressed in different measure units, observational data
are usually standardized to adimensional numbers. This is achieved by using the
following transformation:
z
i
D
x
i
Nx
s
: (3.1)
The standardized variable has mean zero and standard deviation equal to one.
Exercises and Problems
1. Given the data f1:2; 1:0; 1:1; 0:8; 0:4; 0:95; 0:2g, determine their mean,
variance and standard deviation. Then, standardize the variables by means
of (3.1).
We have n D 7. Simple computation gives Nx D 0:35, s
2
D 0:75583 and
s D 0:86939. Standardization using (3.1) provides the following new data (final
results rounded to the first five decimal digits),
f0:97770; 1:5528; 0:86268; 0:51761; 0:86268; 0:69014; 0:63263g;
for which we obtain Nz D 0 and s.z/ D 1.
2. Given the data f1:2; 19; 2:68; 0:8 3:0; 20:0; 0:2g, compute mean, variance,
standard deviation. Compare the results with those of the previous exercise.
We have n D 7. Simple computation gives Nx D 0:3542, s
2
D 129:7 and s D
11:39. Although the mean is basically the same as for the previous data, the
variance and the standard deviation are much larger in this case. This shows
that these data are more spread around the mean, as it can be clearly noticed by
directly inspecting the data.
3.5 Associations Between Time Series 29
3.5 Associations Between Time Series
The basis for applying EOF methods derives from the realization that the evolution
of climate processes in time leads to relationships between time series of differ-
ent atmospheric variables at nearby and remote locations. There are many ways to
measure the nature and extent of a relationship between two time series. One of the
most common is the Pearson correlation coefficient. This is closely related to the
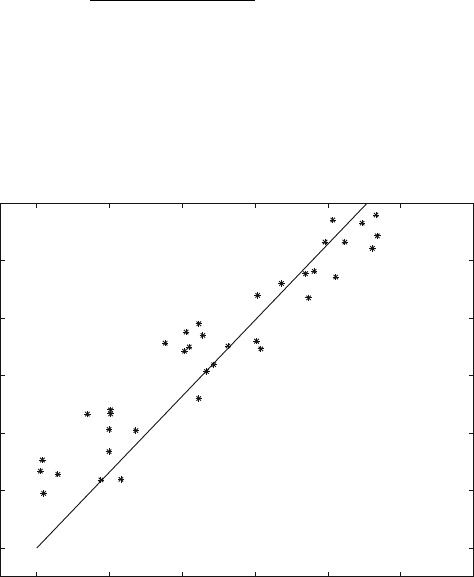
concept of least squares linear regression. To illustrate this concept, we first do the
simplest thing possible to explore the relationship between two time series – we
make a scatter plot of the observation pairs .x
i
;y
i
/ (see the symbols “”inFig.
3.1).
Making an assumption of a linear relationship, we try to draw a straight line
through the data points. We can fit the line to minimize the sum of squared errors
in the Y variable. This line captures some of the variance in the independent series.
In mathematical terms, this line yields the “best approximation” straight line, in the
least squares sense, and it is given by the equation y D b
1
x C b
0
, with
b
1
WD
X
i
.x
i
Nx/.y
i
Ny/
X
i
.x
i
Nx/
2
;b
0
DNy b
1
Nx:
The fraction of variance represented, corresponds to the degree of association (cf.
Fig. 3.1). Analogously, the line x D c
1
y C c
0
can be drawn to minimize the sum
of squared errors in the X variable. The fraction of variance explained is the same
as for the Y variable. The combination of the two coefficients b
1
and c
1
yields the
0 0.2 0.4 0.6 0.8 1 1.2
0
0.2
0.4
0.6
0.8
1
Fig. 3.1 Scatter plot of observations and fitting line

30 3 Basic Statistical Concepts
correlation coefficient r, which provides a measure of association among the two
variables, and it is defined as
r
2
D b
1
c
1
D
X
i
.x
i
Nx/.y
i
Ny/
!
2
X
i
.y
i
Ny/
2
X
i
.x
i
Nx/
2
:
To generalize this concept to multidimensional data, assume now that a set of m n
data x
1;1
;x
1;2
; :::; x
1;n
; :::; x
m;n
is given. Here we are considering m variables
and n observations (time series of length n for each of the m variables). Let Nx
j
; Nx
k
be the means associated with the time series j and k. Analogously, we define the
standard deviations s
j
, s
k
. For each pair of variables, the associated correlation
coefficient is given by
r
j;k
D
1
n 1
n
X
iD1
.x
j;i
Nx
j
/.x
k;i
Nx
k
/
s
j
s
k
:
For the ith observation, i D 1; :::; n, the sum above multiplies the standardized
j th and kth variables. The coefficient associated with these two variables is small
(large) in absolute value, if both standardized variables are small (large), in all n
observations. The normalization operates such that the correlation takes values be-
tween 1 (all points would lie on a backward sloping line) and 1 (all points would
fall on a forward sloping line, cf. Fig. 3.1). Note that r
j;j
D 1 for all j . In case
standardization is not used, a related measure of association between deviations is
the covariance coefficient, which can be viewed as a non-normalized correlation:
s
j;k
D
1
n 1
n
X
iD1
.x
j;i
Nx
j
/.x
k;i
Nx
k
/: (3.2)
Here s
j;j
D s
2
j
is the variance of the j th variable. The matrix S D .s
j;k
/ of all
coefficients above is called the (cross-)covariance matrix and is symmetric, that is
the covariance between the j th and kth variables is the same as the covariance
between the kth and j th variables. The total variance of the field is then given by
T D
1
n 1
m
X
iD1
n
X
j D1
.x
i;j
Nx
i
/
2
D
m
X
iD1
s
ii
D trace.S/; (3.3)
showing that the total field variance is just the trace of the covariance matrix.
Both the above are related to the squared error departures from a linear relation.
There are other ways to measure association. An example is the rank order
Spearman correlation coefficient; see, e.g., Clarke and Cooke (1998).
3.5 Associations Between Time Series 31
Other measures could be determined based on absolute error. For instance, the
Linear Error in Probability Space (LEPS) works on the mean absolute difference in
the ranking, or cumulative probability. Associations could be measured in terms of
the extent to which variance is explained by some specified non-linear relationship,
such as quadratic or log linear. The correlation coefficients introduced above can
be collected in one matrix, that more clearly visualizes the association of each time
series with all others.
For instance, the correlation matrix is given by
R D
0
B
B
B
@
r
1;1
r
1;2
r
1;m
r
2;1
r
2;2
r
2;m
:
:
:
:
:
:
:
:
:
:
:
:
r
m;1
r
m;2
r
m;m
1
C
C
C
A
:
As will be shown, there are special properties of correlation and covariance matri-
ces that can be uncovered by a Principal Component Analysis. Matrix properties
of other measures of association have not been as much investigated; they will be
alluded to in the following chapters.
Exercises and Problems
1. Given the data x Df1:1; 0:8; 1:2g and y Df0:6; 0:9; 2:4g, determine the co-
variance and correlation matrices.
We have m D 2 variables, and n D 3 observations. Therefore, Nx D 0:3,
Ny D 1:3, s.x/ D 1:2288 and s.y/ D 0:9643, so that the standardized variables
are z.x/ Df1:1393; 0:40689; 0:73241g and z.y/ Df0:72587; 0:41478;
1:1406g. The correlation coefficient is given by r
1;2
D 1=2.z.x/
1
z.y/
1
C
z.x/
2
z.y/
2
C z.x/
3
z.y/
3
/ D 0:74 (note that the computation of r
1;2
is actu-
ally done with full accuracy and only the first 2 decimals are reported). Hence,
the corresponding matrix is
R D
10:74
0:74 1
:
The value of r
1;2
shows a significant positive correlation between the two vari-
ables. Analogously, the covariance is given by s
1;2
D 0:885.
2. Given the data x Df1:1; 0:8; 1:2g, y Df0:6; 0:9; 2:4g and z Df4:2;1:1;
6:8g, determine the covariance and correlation matrices.
We have m D 3 variables, and n D 3 observations. The first two sets are as in the
previous example. We have, z D 3:3, s.z/ D 4:0262, so that the new standardized
variable is z.x/ Df0:22354; 1:0929; 0:86931g. We obtain r
1;3
D0:00313
and r
2;3
D0:64. The correlation between the y and z variables is significant,
whereas that between x and z is negligible. Analogously, we obtain s
3;3
D 16:21,
s
1;3
D0:155 and s
2;3
D 2:49.
32 3 Basic Statistical Concepts
3. Given the data x Df1:1; 0:8; 1:2g, y Df0:6; 0:9; 2:4g and z Df104:2;
100:1; 126:8g, determine the covariance coefficients. Comment on the role of
dimensionality.
Only the third variable has changed. We have s
3;3
D 1562:2, s
1;3
D40:90 and
s
2;3
D 53:29. Note that the larger variability is due to the significantly different
unit of z, which is also reflected in the covariance coefficients.
3.6 Hypothesis Testing
In an attempt to infer conclusions on an unobservable population, we can set about
estimating the extent to which our available sample can tell us something about
that population. Let us consider the simple example of testing whether the popula-
tion mean is zero. Statistical significance is estimated by formally expressing two
possibilities that we need to choose between. Here, the first one is that the popu-
lation mean is zero. As an alternative possibility, we can say that the population
mean is not zero (other options may be more significant in some cases, such as
“mean greater than zero”). Formally, the original hypothesis is termed the null hy-
pothesis (H
0
), whereas the second one is called the alternative hypothesis (H
1
), and
these are written as
H
0
W D 0; H
1
W ¤ 0:
We want to distinguish between these two possibilities in a way that allows us to
know the likelihood that our choice is in fact wrong (i.e. how surprised we should
be if our decision turns out to be the wrong one). We start out by assuming that H
0
is true. If H
0
is true, then the sample should obey certain statistical properties. If the
sample does not reflect these properties, then we start to doubt H
0
. For example, we
can define a test statistic whose distribution we know under the assumption that H
0
is true and we explore to what extent our sample obeys this distribution.
A particularly popular distribution is the normal distribution, as it represents an
effective model for data stemming from a variety of applications. Data following
a normal distribution distribute around their mean with a probability that decreases
significantly as data move away from the mean. The set of normally distributed vari-
ables with mean and variance
2
is usually denoted by N.;
2
/. The probability
of normal data distributes along a bell-shaped curve, as described in the plots of
Fig. 3.2 for various values of and . In other words, the probability that a sample
taken from an N.;
2
/ normal population has mean in the interval Πd; C d
equals the area of the region below the bell-shaped curve, with extremes on the
ascissa at d and C d . A normally distributed variable x with mean and
variance
2
can be transformed into a standardized normally distributed variable
in N.0; 1/ by means of the change of variable z D .x /=. Reference values
for a variable z in N.0; 1/ are tabulated and can be used for hypothesis tests. Most

3.6 Hypothesis Testing 33
−10 −8 −6 −4 −2 0 2 4 6 8 10
0
0.05
0.1
0.15
0.2
0.25
0.3
0.35
0.4
N(0,1)
N(0,(1.8)
2
)
−10 −8 −6 −4 −2 0 2 4 6 8 10
0
0.05
0.1
0.15
0.2
0.25
0.3
0.35
0.4
N(0,1)
N(2,1)
Fig. 3.2 Normal distributions for various values of and
statistical computer software provides a pretty accurate evaluation of the probability
and other quantities associated with the normal distribution.
The trick in hypothesis testing is to define powerful test statistics, such as the
standardized statistic
z D
x
se
;
where se is the standard error of x,givenby
se D
p
n
;
is the population standard deviation and n is the sample size. The standard error
represents the standard deviation of the sample mean distribution. In other words,
34 3 Basic Statistical Concepts
imagine estimating the mean of the population ten times, each time taking a sample
of n individuals from the population. The ten resulting sample means will all be
slightly different. The expected standard deviation of the sampled means is what
we refer to as the standard error of the estimated mean.
Assume that H
0
is true. If the sample is sufficiently large, namely if n is suffi-
ciently large, then z approximately behaves as if it were normally distributed with
mean 0 and standard deviation 1.
Now, if the distribution of z departs substantially from 0, then we may start to
doubt H
0
.Ifthevariablez were exactly normally distributed with zero mean and
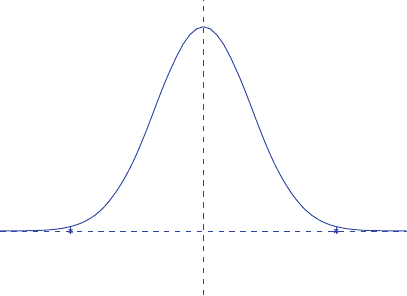
unit variance, then only on 2:5% of occasions z would take a value of C1:96 or
higher. Likewise, on a further 2:5% of occasions, z would take a value not greater
than 1:96 (cf. Fig. 3.3). That is, there is a 5% chance of the absolute value of z be-
ing greater than 1.96. So, if z takes an absolute value greater than 1.96, such a result
is certainly quite surprising if in fact, the true mean is zero (surprising because we
only expect it to happen on 5% of occasions when we sample a population mean
with mean 0). Note that we can never be certain that H
0
is wrong. For statistical
significance, we may decide that something that would only happen by chance on
5% of occasions is just too surprising, and that the wisest choice to make in this
situation is to conclude that the available evidence does not support H
0
.Thatis,at
the 5% level of significance, we reject H
0
and accept the alternative hypothesis H
1
,
that the mean is not equal to zero. However, in terms of acquiring clues about the
overall functioning of the environment, we may prefer not to work in the discrete
terms of rejection or acceptance of H
0
. Rather, acknowledging that using statis-
tics alone, we can never distinguish between the two hypotheses with certainty, we
may prefer to note the likelihood that H
0
can be rejected based on statistics alone,
and absorb this information into broader evidence based on physical theories and
physically based models.
The above approach estimates the probability of rejecting H
0
by starting with
the assumption that H
0
is actually true. This is the usual way to frame a statistical
−1.96 1.96
Fig. 3.3 Normal distribution. The area of the region below the curve and absissas in Œ1:96; 1:96
is equal to 0.95

3.6 Hypothesis Testing 35
significance test, on the premise that the analyst is usually interested in whether H
0
can be rejected, such as with whether a correlation coefficient is non-zero. Here, if
we choose to reject the idea that the true correlation is zero, what is the probability
that we are wrong (and in fact, there is a linear association between the two vari-
ables). This probability of wrongly rejecting H
0
is often termed the probability of
making a Type I error, and is the statistical significance probability, alpha. However,
there is another error type that can be made, usually referred to as Type II error,
that of accepting H
0
when in fact H
0
should be rejected. This probability can also
be estimated assuming the distribution of test statistics. However, it is generally not
considered as useful as the Type I error probability, that focuses on whether we can
reject H
0
.
The distribution of the reference statistic z is easy to derive and work with. In
many instances the test statistic is more complex. A typical complication appears
when the standard deviation of the population is not known (of course, this is usually
the situation we find ourselves in). In this situation, we can use the Student statistics,
or t-statistic, in which the population standard deviation is replaced by the sample
standard deviation, that is
t
0
D
x
Ns
p
n (3.4)
The new variable t
0
depends on n, more precisely on n 1, and for each value of n,
t
0
follows a specific distribution. Is it important to stress that to be able to employ
the Student distribution as test statistic, we need to assume that the given sample
comes from a normal distribution.
As n grows, the Student distribution increasingly resembles the normal distri-
bution. The likelihood of t
0
exceeding a reference value is tabulated, for different
values of n 1, called the degrees of freedom, Df ; which is related to the size
of the available sample. The degrees of freedom is a complicated issue for many
climate analyses. The above holds if each term in the sample is independent. How-
ever, in many climate time series, adjacent observations are correlated in time, and
this reduces the effective degrees of freedom (and can complicate the distribution
of the test statistic). This is particularly a challenge for estimating the significance
of the relationship between two variables. The correlation coefficient significance is
very difficult to estimate because of this effect; see vonStorchandZwiers(1999).
This problem transfers into the estimation of significance for EOFs, since they them-
selves are summaries of the cross-correlations/covariances in datasets.
Exercises and Problems
1. Assume that a sample of 100 units is taken from a population which was in
the past known to have mean D 12:3 and standard deviation D 15.The
computed sample mean is x D 14:2. Carry out a hypothesis test with 5% level
of significance, to analyze whether the population mean has changed.
36 3 Basic Statistical Concepts
We set H
0
: D 12:3 and H
1
W ¤ 12:3. We have z D .x /= D 0:12.
The critical region for 5% level of significance would be jzj >1:96, therefore
the new variable z is well away from the critical region. We do not reject the null
hypothesis.
2. What would happen in the example above if the standard deviation were D
0:9? What if the significance level were 1%?
With the same framework as before, we have z D .x /= D 2:11, hence
this variable falls within the critical region jzj >1:96. We have to reject the null
hypothesis in favor of the alternative hypothesis H
1
for a 5% level of signifi-
cance. For a significance level equal to 1%, the corresponding critical region is
jzj >2:57, so that the null hypothesis would not be rejected.
The inherent difficulty associated with the effective number of degrees of freedom
in the Student statistics is one of the reasons why alternatives such as Monte Carlo
estimates of significance are attractive. To illustrate the concept, consider that we
have two time series of length 30 years. Each time series has serial correlation and
can be represented by an autoregressive process:
x
t
D ax
t1
C z
t
: (3.5)
We can use random number generators in combination with the above model to
simulate 500 pairs of time series with the same serial correlation properties as the
original two series. The distribution of the 500 correlations between each randomly
generated pair of series is now constructed empirically. We expect the mean of the
correlations calculated to be zero, but the spread will depend on the degree of au-
tocorrelation in the two series. If the pair of series are highly auto-correlated, the
location of the correlation magnitude that occurs on 5% of occasions will be much
higher than if the pair of series were uncorrelated. Now we are using the correlation
itself as the test statistic, knowing the distribution of the sample correlations under
the assumption that the true population correlation is 0. The correlation magnitude
corresponding to the 5% significance level can be found by identifying the thresh-
old above which were found only 5% of the sample correlations. The temporal d.f.
problem is also present for methods devised to estimate the statistical significance of
EOFs. Higher percentage of variance explained are expected by chance, when time
series used in the EOF analysis contain serial correlation. Thus caution is needed
not to place excessive weight on significance estimates of EOFs when series have
serial correlation.
3.7 Missing Data
Dealing with missing data is an important aspect for application of EOF methods.
In some datasets, the fields will have been made complete for the analyst, in which
case the analyst should investigate carefully the way the data were interpolated and