Neamen D. Microelectronics: Circuit Analysis and Design
Подождите немного. Документ загружается.


Test Your Understanding
TYU 12.13 Consider the circuit in Figure 12.44(a) with parameters described in
Example 12.15. Determine the percentage change in the loop gain
T
as
h
FE
increases
from
h
FE
= 100
to
h
FE
= 150
. (Ans.
+17.3%
change)
TYU 12.14 Consider the circuit in Figure 12.16 with the equivalent circuit in Figure
12.17. Assume
A
v
= 10
4
,
R
i
= 50
k
,
R
1
= 5
k
,
R
2
= 20
k
and
R
o
= 0
. Calcu-
late the loop gain
T.
(Ans.
T = 1.85 ×10
3
)
12.9 STABILITY OF THE FEEDBACK CIRCUIT
Objective: • Determine the stability criteria of feedback circuits.
In negative feedback, a portion of the output signal is subtracted from the input signal
to produce the error signal. However, as we found in the last section, this subtraction
property, or the loop gain, may change as a function of frequency. At some frequen-
cies, the subtraction may actually be addition; that is, the negative feedback may
become positive, producing an unstable system. In this section, we will examine the
stability of feedback circuits.
The Stability Problem
The basic feedback configuration is shown in Figure 12.1, and the ideal closed-loop
transfer function is given by Equation (12.5), which is repeated here:
A
f
=
S
o
S
i
=
A
(1 + β A)
(12.5)
The open-loop gain is a function of the individual transistor parameters and
capacitances, and is therefore a function of frequency. The closed-loop gain can then
be written as
A
f
(s) =
A(s)
(1 + β A(s))
=
A(s)
1 + T (s)
(12.100)
where T(s) is the loop gain. For physical frequencies,
s = jω
, and the loop gain is
T ( jω)
, which is a complex function. The loop gain can be represented by its magni-
tude and phase, as follows:
T ( jω) =|T ( jω)|
φ
(12.101)
The closed-loop gain can be written
A
f
( jω) =
A( jω)
1 + T ( jω)
(12.102)
The stability of the feedback circuit is a function of the loop gain
T ( jω)
. If the
loop gain magnitude is unity when the phase is 180 degrees, then
T ( jω) =−1
and
the closed-loop gain goes to infinity. This implies that an output will exist for a
12.9.1
908 Part 2 Analog Electronics
nea80644_ch12_851-946.qxd 6/23/09 1:45 PM Page 908 pmath DATA-DISK:Desktop Folder:23/06/09:MHDQ134-12:
zero input, which means that the circuit will oscillate. If we are trying to build a
linear amplifier, an oscillator is considered an unstable circuit. We will show that
if
|T ( jω)| < 1
when the phase is 180 degrees, the system is stable, whereas if
|T ( jω)|≥1
when the phase is 180 degrees, the system is unstable. To study the sta-
bility of feedback circuits, we must therefore analyze the frequency response of the
loop gain factor.
Bode Plots: One-, Two-, and Three-Pole Amplifiers
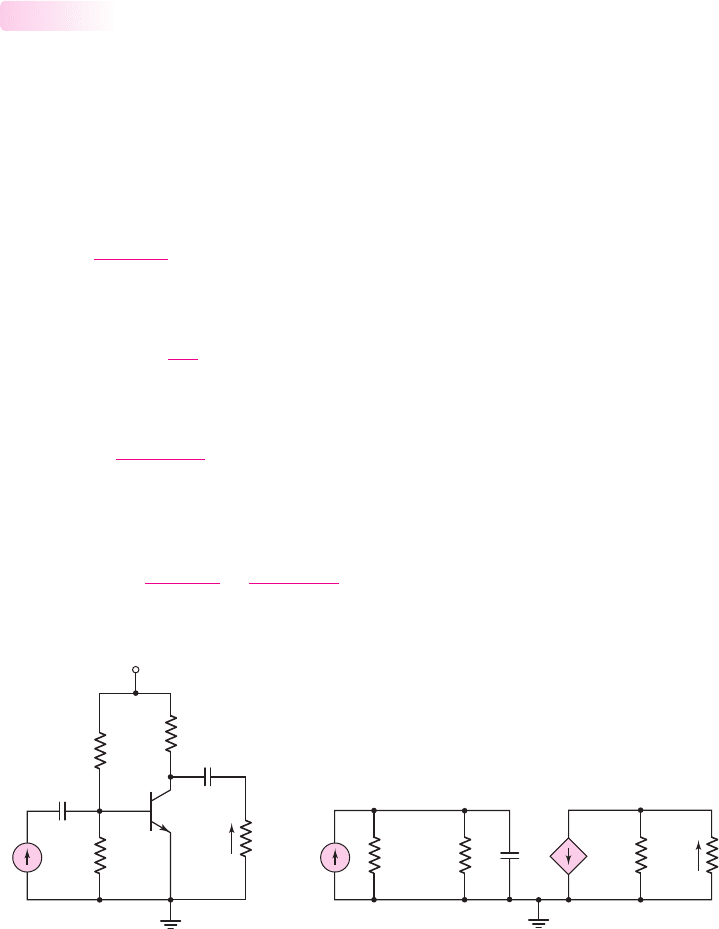
Figure 12.48(a) shows a simple single-stage common-emitter current amplifier. The
high-frequency small-signal equivalent circuit is shown in Figure 12.48(b). The
capacitance C
1
includes the forward-biased base-emitter junction capacitance as
well as the effective Miller capacitance. The Miller capacitance and Miller effect
were discussed in Chapter 7. The equivalent circuit shown in Figure 12.48(b) is
identical to that developed in Figure 7.46. The output current in Figure 12.48(b)
is given by
I
o
=
R
C
R
C
+ R
L
g
m
V
π
(12.103)
and the voltage
V
π
is
V
π
= I
i
R
π
1
sC
1
(12.104)
where
R
π
= r
π
R
B
= r
π
R
1
R
2
. Equation (12.104) can be expanded to
V
π
= I
i
R
π
1 + sR
π
C
1
(12.105)
Substituting Equation (12.105) into (12.103), we get an expression for the small-
signal current gain,
A
i
= g
m
R
π
R
C
R
C
+ R
L
1
1 + sR
π
C
1
(12.106)
12.9.2
Chapter 12 Feedback and Stability 909
(a) (b)
I
i
R
L
R
C
I
o
R
B
=
R
1
⎪⎪
R
2
C
1
+
–
g
m
V
p
V
p
r
p
i
i
C
C1
→ ∞
C
C2
→ ∞
V
CC
R
2
R
L
R
C
R
1
i
o
Figure 12.48 (a) Single-stage common-emitter amplifier and (b) small-signal equivalent
circuit, including input capacitance
nea80644_ch12_851-946.qxd 6/23/09 1:45 PM Page 909 pmath DATA-DISK:Desktop Folder:23/06/09:MHDQ134-12:
(a)
(b)
Phase
f
f
1
0
–90°
–45°
A
io
f
f
1
–6 dB/octave
or
–20 dB/decade
|A
i
|
dB
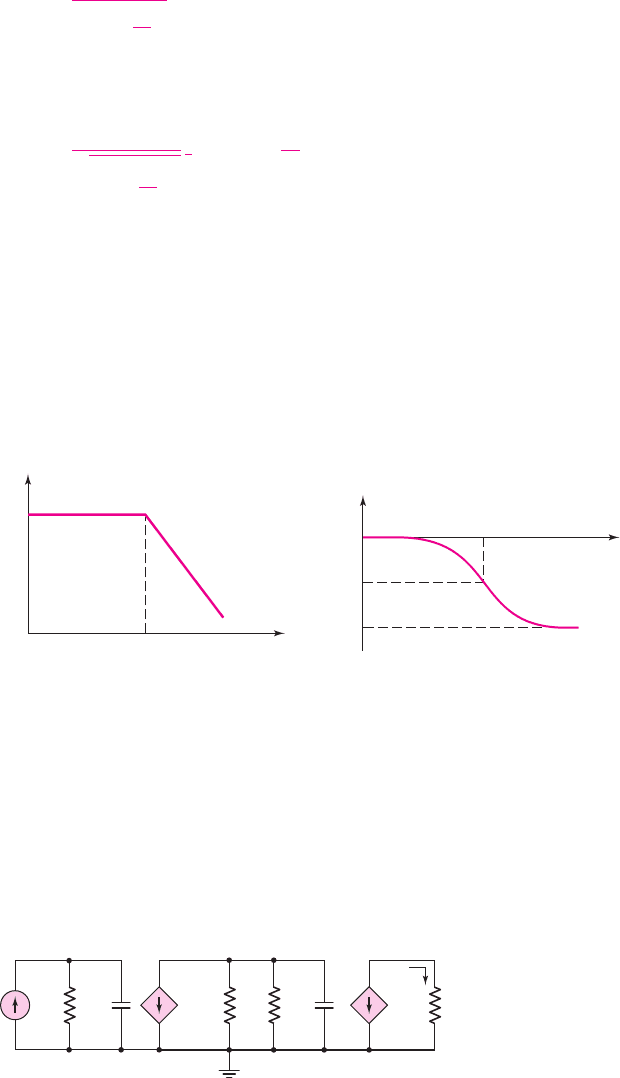
Figure 12.49 Bode plots of current gain for single-stage common-emitter amplifier:
(a) magnitude and (b) phase
I
i
R
L1
R
L2
I
o
g
m
1
V
p
1
g
m
2
V
p
2
C
1
+
–
V
p
1
+
–
V
p
2
C
2
R
p
1
R
p
2
Figure 12.50 Small-signal equivalent circuit, two-stage amplifier including
input capacitances
When we set
s = jω = j(2π f )
, Equation (12.106) can be written as
A
i
=
A
io
1 + j
f
f
1
(12.107)
where
A
io
is the low-frequency or midband gain and f
1
is the upper 3 dB frequency.
The gain is a complex function that can be written
A
i
=
A
io
1 +
f
f
1
2
−tan
−1
f
f
1
(12.108)
Figure 12.49(a) is a Bode plot of the current gain magnitude, and Figure 12.49(b)
is a Bode plot of the current gain phase. Note that, from the definition of the directions
of input and output currents, the output current is in phase with the input current at
low frequencies. At high frequencies, the output current becomes 90 degrees out of
phase with respect to the input current. This single-stage circuit is an example of a
one-pole amplifier. As we have previously shown, similar expressions can be ob-
tained for voltage gain, the transresistance transfer function, and the transconduc-
tance transfer function.
910 Part 2 Analog Electronics
Figure 12.50 shows the small-signal equivalent circuit of a two-stage amplifier,
using the same hybrid-
π
configuration for the transistors. The capacitance C
2
is the
input capacitance of the second transistor, including the effective Miller capacitance.
The output current is
I
o
=−g
m2
V
π2
(12.109)
nea80644_ch12_851-946.qxd 6/23/09 1:45 PM Page 910 pmath DATA-DISK:Desktop Folder:23/06/09:MHDQ134-12:
and
V
π2
is
V
π2
=−g
m1
V
π1
R
L1
R
π2
1
sC
2
(12.110)
The voltage
V
π1
is
V
π1
= I
i
R
π1
1
sC
1
(12.111)
Combining Equations (12.109), (12.110), and (12.111) yields an expression for
the small-signal current gain, as follows:
A
i
=
I
o
I
i
= (g
m1
g
m2
)(R
π1
)(R
L1
R
π2
)
1
1 + sR
π1
C
1
1
1 + s(R
L1
R
π2
)C
2
(12.112)
Setting
s = jω = j(2π f )
, we can write Equation (12.112)
A
i
=
A
io
1 + j
f
f
1
1 + j
f
f
2
(12.113)
where
f
1
= 1/2π R
π1
C
1
and
f
2
= 1/2π(R
L1
R
π2
)C
2
. Frequency f
1
is the upper
3 dB frequency of the first stage, and f
2
is the upper 3 dB frequency of the second
stage. This two-stage circuit is an example of a two-pole amplifier.
Equation (12.113) can be written
A
i
=
A
io
1 +
f
f
1
2
1 +
f
f
2
2
−
tan
−1
f
f
1
+tan
−1
f
f
2
(12.114)
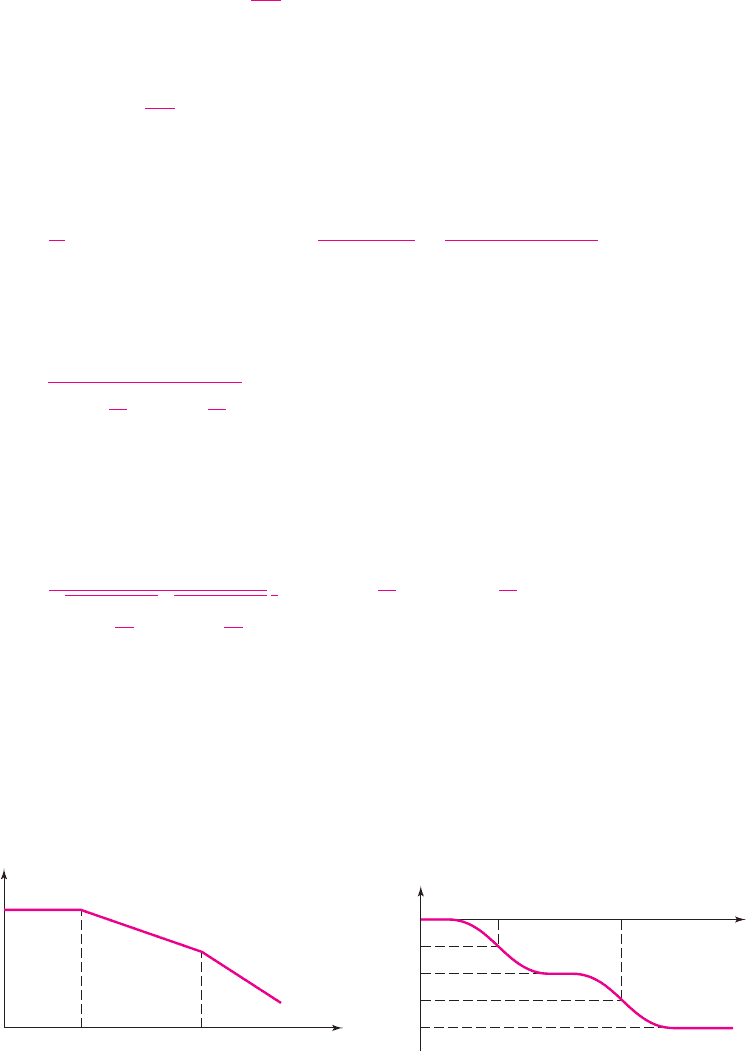
Figure 12.51(a) is a Bode plot of the current gain magnitude, assuming
f
1
f
2
.
This assumption implies that the two poles are far apart. The Bode plot of the current
gain phase is shown in Figure 12.51(b). Again the phase of the output current is in
phase with the input current at low frequency. This phase relation is a direct result of
the way the directions of current were defined. At high frequencies, the output cur-
rent becomes 180 degrees out of phase with respect to the input current.
Chapter 12 Feedback and Stability 911
(a)
(b)
Phase
f
f
2
0
–135°
–180°
–45°
–90°
f
1
A
io
f
f
1
f
2
–6 dB/octave
or
–20 dB/decade
–12 dB/octave
or
–40 dB/decade
|A
i
|
dB
Figure 12.51 Bode plots of current gain for two-stage amplifier: (a) magnitude and
(b) phase
nea80644_ch12_851-946.qxd 6/23/09 1:45 PM Page 911 pmath DATA-DISK:Desktop Folder:23/06/09:MHDQ134-12:
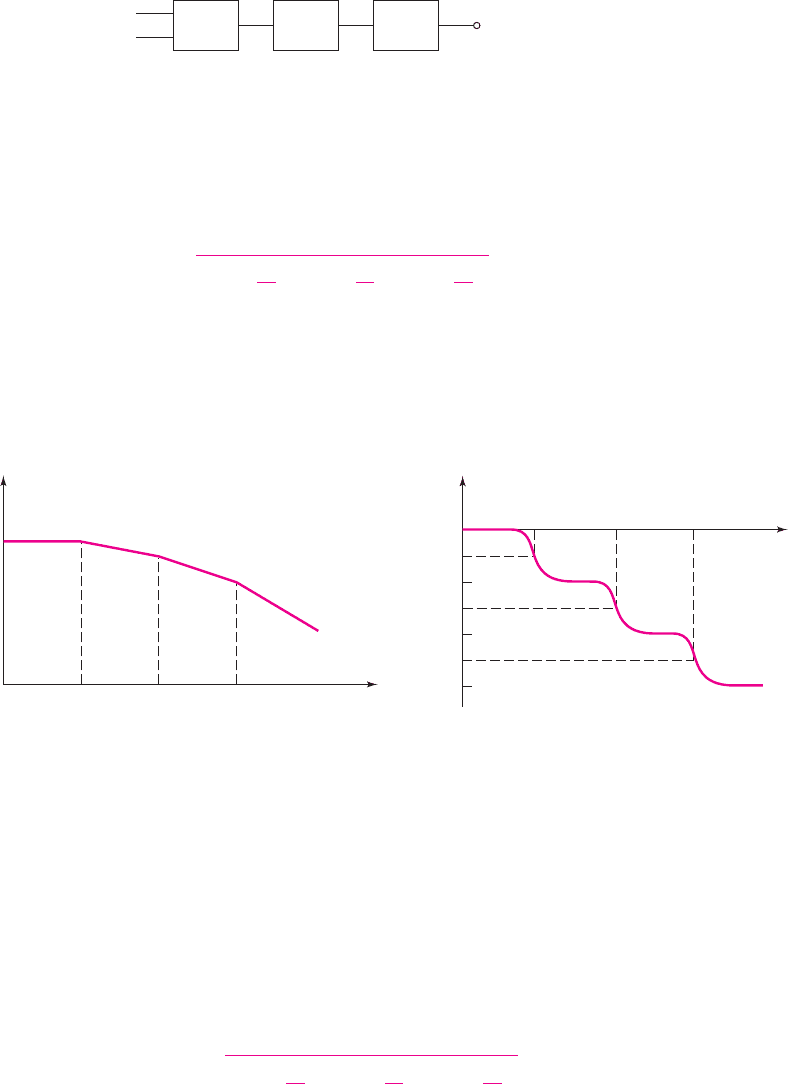
An op-amp is a three-stage amplifier, as shown in Figure 12.52. Since each stage
has an equivalent input resistance and capacitance, this circuit is an example of a
three-pole amplifier. The overall gain can be expressed as
A =
A
o
1 + j
f
f
1
1 + j
f
f
2
1 + j
f
f
3
(12.115)
where A
o
is the low-frequency gain factor. Assuming the poles are far apart (let
f
1
f
2
f
3
), the Bode plots of the gain magnitude and phase are shown in Fig-
ure 12.53. At very high frequencies, the phase difference between the output and
input signals is
−270
degrees.
v
1
v
2
v
o
Diff-amp
stage
Gain
stage
Output
stage
Figure 12.52 Three-stage amplifier
|A
i
|
dB
A
io
f
f
1
f
2
f
3
–6 dB/octave
or
–20 dB/decade
–18 dB/octave
or
–60 dB/decade
–12 dB/octave
or
– 40 dB/decade
Phase
f
f
1
f
2
f
3
0
–180°
–270°
–90°
(a) (b)
Figure 12.53 Bode plots of three-stage amplifier gain: (a) magnitude and (b) phase
If we assume an ideal feedback amplifier, the loop gain is
T ( jω) = β A( jω)
(12.116)
where the feedback transfer function
β
is assumed to be independent of frequency.
For op-amp feedback circuits, we can determine the feedback transfer function
β
, as
previously shown, and the basic amplifier characteristics are assumed to be known.
For a three-stage amplifier, the loop gain is therefore
T ( f ) =
β A
o
1 + j
f
f
1
1 + j
f
f
2
1 + j
f
f
3
(12.117)
Both the magnitude and phase of the loop gain are functions of frequency. For
the three-stage amplifier, the phase will be
−180
degrees at some particular
frequency, which means that the amplifier may become unstable.
912 Part 2 Analog Electronics
nea80644_ch12_851-946.qxd 6/23/09 1:45 PM Page 912 pmath DATA-DISK:Desktop Folder:23/06/09:MHDQ134-12:
Chapter 12 Feedback and Stability 913
Nyquist Stability Criterion
In the last section, we saw that a feedback system can become unstable. Several
methods can be used to determine whether a system is stable or unstable. The method
we will consider is called the Nyquist stability criterion. This method not only
determines if a system is stable, it also indicates the degree of system stability.
To apply this method, we must plot a Nyquist diagram, which is a polar plot
of the loop gain factor
T ( jω)
. The loop gain, which is a complex function, can be
written in terms of its magnitude and phase,
T ( jω) =|T ( jω)|
φ
, as shown in Equa-
tion (12.101). The Nyquist diagram is a plot of the real and imaginary components of
T ( jω)
as the frequency
ω
varies from minus infinity to plus infinity. Although nega-
tive frequencies have no physical meaning, they are not mathematically excluded in
the loop gain function. The polar plot for negative frequencies, as we will see, is the
complex conjugate of the polar plot for positive frequencies.
The loop gain for a two-pole amplifier is, from Equation (12.113),
T ( jω) =
β A
io
1 + j
ω
ω
1
1 + j
ω
ω
2
(12.118)
where
ω
1
and
ω
2
are the upper 3 dB radian frequencies of the first and second stages,
respectively. We can also write Equation (12.118) in the form
T ( jω) =
β A
io
1 +
ω
ω
1
2
1 +
ω
ω
2
2
−
tan
−1
ω
ω
1
+tan
−1
ω
ω
2
(12.119)
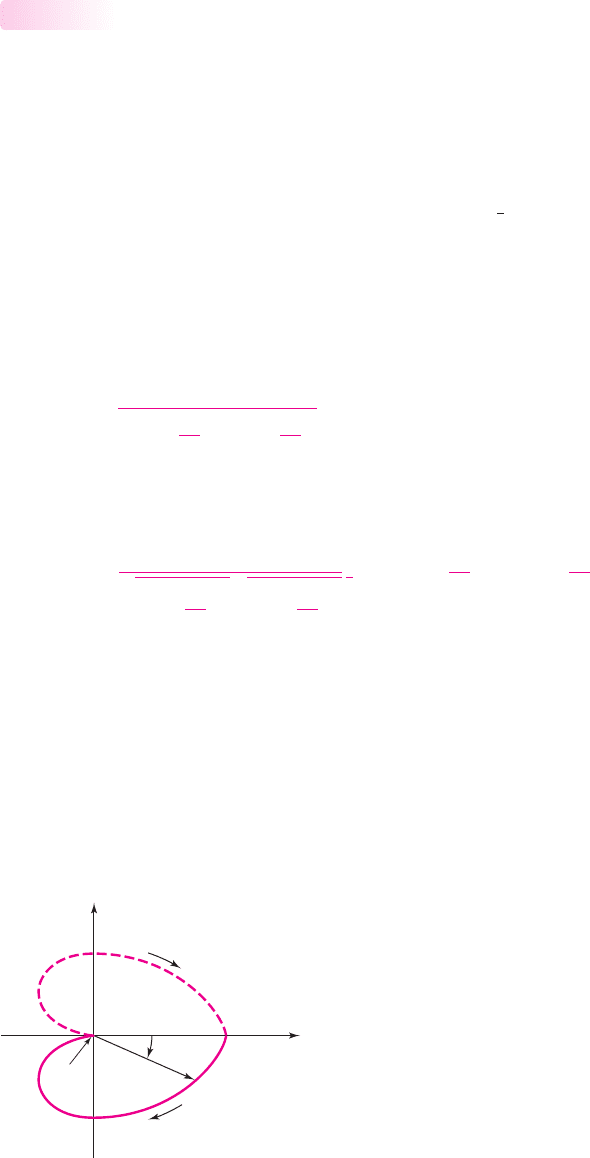
The Nyquist plot of Equation (12.119) is shown in Figure 12.54. At
ω = 0
, the
magnitude of
T ( jω)
is
β A
io
and the phase is zero. As
ω
increases, the magnitude
decreases and the phase is negative. From Equation (12.119), we see that for nega-
tive values of
ω
, the magnitude also decreases, but the phase becomes positive. This
means that the loop gain function for negative frequencies is the complex conjugate
of the loop gain function for positive frequencies, and the real axis is the axis of
symmetry. As
ω
approaches
+∞
, the magnitude approaches zero and the phase
approaches
−180
degrees.
12.9.3
Imag. T( j
w
)
Real T( jw)
|T( jw)|
–90°
–180°
+180°
0
–
∞
+90°
w = –∞
–f
w = 0
–
w = 0
+
w
w = +∞
w
Figure 12.54 Nyquist plot, loop gain for two-stage amplifier
nea80644_ch12_851-946.qxd 6/23/09 1:45 PM Page 913 pmath DATA-DISK:Desktop Folder:23/06/09:MHDQ134-12:
The loop gain for a three-pole amplifier is, from Equation (12.117),
T ( jω) =
β A
o
1 + j
ω
ω
1
1 + j
ω
ω
2
1 + j
ω
ω
3
(12.120)
This loop gain function can also be written in the form
T ( jω) =
β A
o
1 +
ω
ω
1
2
1 +
ω
ω
2
2
1 +
ω
ω
3
2
φ
(12.121(a))
where
φ
is the phase, given by
φ =−
tan
−1
ω
ω
1
+tan
−1
ω
ω
2
+tan
−1
ω
ω
3
(12.121(b))
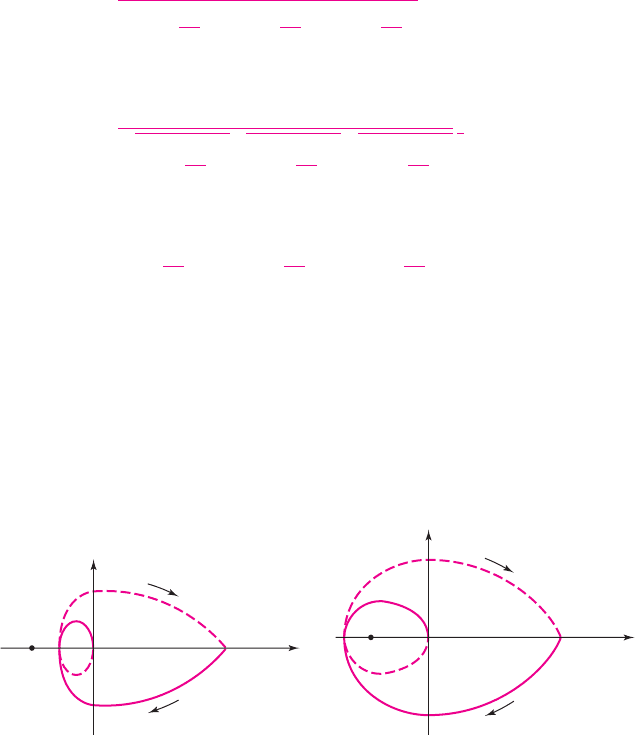
Figure 12.55(a) shows one possible Nyquist plot. For
ω = 0
, the magnitude is
β A
o
and the phase is zero. As
ω
increases in the positive direction, the magnitude decreases
and the phase becomes negative. As the Bode plot in Figure 12.53 shows, the phase goes
through
−90
degrees, then through
−180
degrees, and finally approaches
−270
degrees
as the magnitude approaches zero. This same effect is shown in the Nyquist diagram.
The plot approaches the origin and is tangent to the imaginary axis as
ω →∞
. Again,
the plot for negative frequencies is the mirror image of the positive frequency plot about
the real axis.
(a) (b)
Imag. T(jw)
Real T( jw)
–1, 0
∞
w = +∞
w = –∞
w = 0
+
w = 0
–
0
–
w
w
Imag. T( j
w)
Real T(jw)
–1, 0
w = +∞
w = – ∞
w = 0
+
w = 0
–
∞
w
0
–
w
Figure 12.55 Nyquist plot, loop gain for three-stage amplifier, for: (a) stable system and
(b) unstable system
914
Part 2 Analog Electronics
Another possible Nyquist plot for the three-pole loop gain function is shown in
Figure 12.55(b). The basic plot is the same as that in Figure 12.55(a), except that the
position of the point (
−1
, 0) is different. At the frequency at which the phase is
−180
degrees, the curve crosses the negative real axis. In Figure 12.55(a),
|T ( jω)| < 1
when
the phase is
−180
degrees, whereas in Figure 12.55(b),
|T ( jω)| > 1
when the phase is
−180
degrees. The Nyquist diagram encircles the point (
−1
, 0) in Figure 12.55(b), and
this has particular significance for stability. For this treatment of a three-pole amplifier,
the Nyquist criterion for stability of the amplifier can be stated as follows: “If the
Nyquist plot encircles or goes through the point (
−1
, 0), the amplifier is unstable.”
Using the criterion, a simpler test for stability can be used in most cases. If
|T ( jω)|≥1
at the frequency at which the phase is
−180
degrees, then the amplifier
is unstable. This simpler test allows us to use the Bode plots considered previously,
instead of explicitly constructing the Nyquist diagram.
nea80644_ch12_851-946.qxd 6/23/09 1:45 PM Page 914 pmath DATA-DISK:Desktop Folder:23/06/09:MHDQ134-12:

Chapter 12 Feedback and Stability 915
EXAMPLE 12.18
Objective: Determine the stability of an amplifier, given the loop gain function.
Consider a three-pole feedback amplifier with a loop gain given by
T ( f ) =
β(100)
1 + j
f
10
5
3
In this case, the three poles all occur at the same frequency. Determine the stability
of the amplifier for
β = 0.20
and
β = 0.02
.
Solution: The loop gain can be written in terms of its magnitude and phase,
T ( f ) =
β(100)
⎡
⎣
1 +
f
10
5
2
⎤
⎦
3
−3 tan
−1
f
10
5
The frequency f
180
at which the phase becomes
−180
degrees is
−3 tan
−1
f
180
10
5
=−180
◦
which yields
f
180
= 1.73 ×10
5
Hz
The magnitude of the loop gain at this frequency for,
β = 0.20
, is then
|T ( f
180
)|=
(0.20)(100)
8
= 2.5
For
β = 0.02
, the magnitude is
|T ( f
180
)|=
(0.020)(100)
8
= 0.25
Comment: The loop gain magnitude at the frequency at which the phase is
−180
degrees is 2.5 when
β = 0.20
and 0.25 when
β = 0.02
. The system is therefore un-
stable for
β = 0.20
and stable for
β = 0.02
.
EXERCISE PROBLEM
Ex 12.18: The loop gain function of a feedback amplifier is given by
T
(
f
)
=
β
(
3000
)
1 + j
f
10
3
1 + j
f
10
5
2
Determine the value of
β
at which the amplifier becomes unstable. (Ans.
β = 0.0667)
We can also consider the stability of the feedback system in terms of Bode plots.
The Bode plot of the loop gain magnitude from the previous example is shown in
Figure 12.56(a), for
β = 0.20
and
β = 0.02
. The low-frequency loop gain magni-
tude is dependent on
β
, but the 3 dB frequency is the same in both cases. Since
the three poles all occur at the same frequency, the magnitude of T( f ) decreases at
the rate of
−18
dB/octave at the higher frequencies. The frequencies at which
|T ( f )|=1
are indicated on the figure.
nea80644_ch12_851-946.qxd 6/23/09 1:45 PM Page 915 pmath DATA-DISK:Desktop Folder:23/06/09:MHDQ134-12:
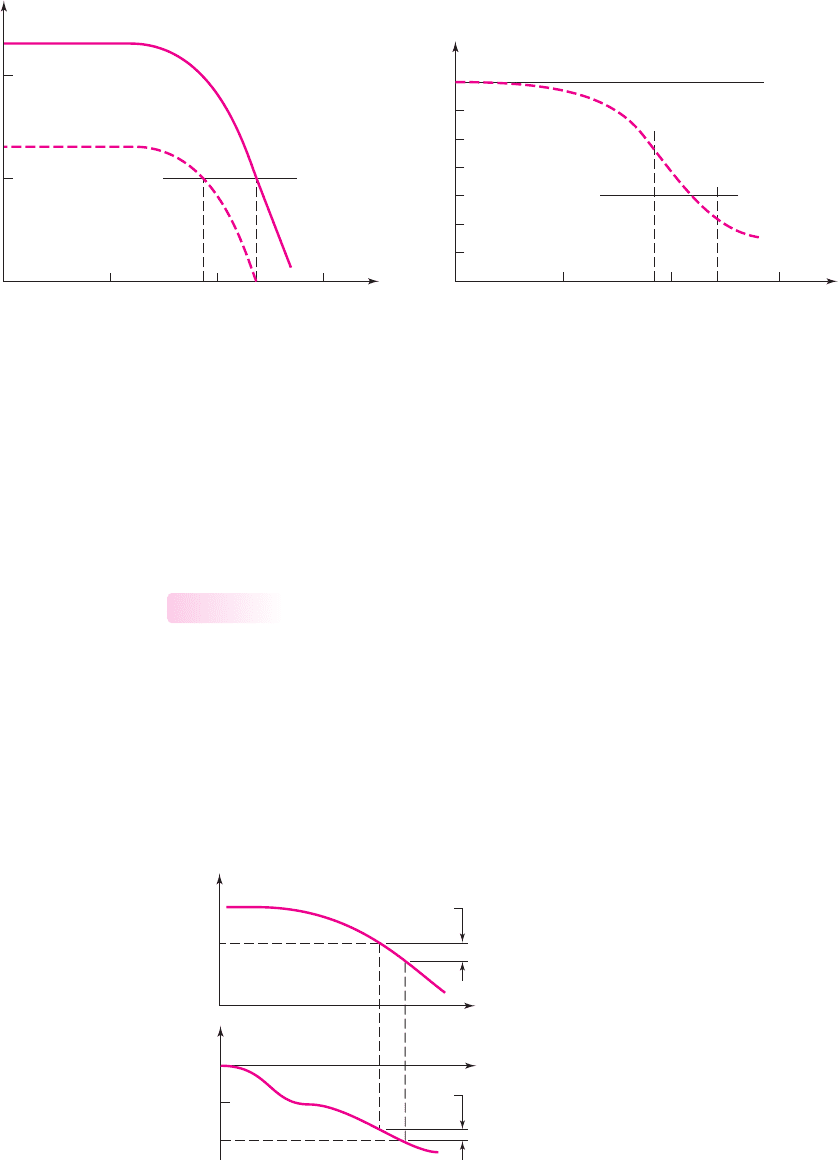
The phase of the loop gain function is shown in Figure 12.56(b). The two
frequencies at which
|T ( f )|=1
, for the two values of
β
, are also indicated. We see
that
|φ| > 180
◦
at
|T ( f )|=1
, when
β = 0.20
. This is equivalent to
|T ( f )| > 1
when
φ =−180
◦
, which makes the system unstable. However,
|φ| < 180
◦
at
|T ( f )|=1
,
when
β = 0.02
, so the feedback circuit is stable for this feedback transfer factor.
Phase and Gain Margins
From the discussion in the previous section, we can determine whether a feedback
amplifier is stable or unstable by examining the loop gain as a function of frequency.
This can be done from a Nyquist diagram or from the Bode plots. We can also use
this technique to determine the degree of stability of a feedback amplifier.
At the frequency at which the loop gain magnitude is unity, if the magnitude of the
phase is less than 180 degrees, the system is stable. This is illustrated in Figure 12.57.
The difference (magnitude) between the phase angle at this frequency and 180 degrees
is called the phase margin. The loop gain can change due, for example, to temperature
12.9.4
|T( f )|
f (Hz)
f
A
10
5
f
B
10
3
0.1
1.0
10
20
10
4
10
6
b = 0.20
b = 0.020
(a)
Phase
10
4
10
6
10
3
–270
–225
–180
–135
–90
–45
0
f (Hz)
f
A
10
5
f
B
(b)
Figure 12.56 Bode plots of loop gain of function described in Example 12.18, for two
values of feedback transfer function: (a) magnitude and (b) phase
|T( j
w
)|
f
f
Phase
0
–90°
–180°
1
Gain
margin
Phase
margin
Figure 12.57 Bode plots of loop gain magnitude and phase, indicating phase margin
and gain margin
916
Part 2 Analog Electronics
nea80644_ch12_851-946.qxd 6/23/09 1:45 PM Page 916 pmath DATA-DISK:Desktop Folder:23/06/09:MHDQ134-12:

Chapter 12 Feedback and Stability 917
variations, and the phase margin indicates how much the loop gain can increase and still
maintain stability. A typical desired phase margin is in the range of 45 to 60 degrees.
A second term that describes the degree of stability is the gain margin, which is
also illustrated in Figure 12.57. This function is defined to be
|T ( jω)|
in decibels at
the frequency where the phase is
−180
degrees. This value is usually expressed in dB
and also gives an indication of how much the loop gain can increase and still main-
tain stability.
EXAMPLE 12.19
Objective: Determine the required feedback transfer function
β
to yield a specific
phase margin, and determine the resulting closed-loop low-frequency gain.
Consider a three-pole feedback amplifier with a loop gain function given by
T ( f ) =
β(1000)
1 + j
f
10
3
1 + j
f
5 × 10
4
1 + j
f
10
6
Determine the value of
β
that yields a phase margin of 45 degrees.
Solution: A phase margin of 45 degrees implies that the phase of the loop gain is
−135
degrees at the frequency at which the magnitude of the loop gain is unity. The
phase of the loop gain is
φ =−
tan
−1
f
10
3
+tan
−1
f
5 × 10
4
+tan
−1
f
10
6
Since the three poles are far apart, the frequency at which the phase is
−135
degrees
is approximately equal to the frequency of the second pole, as shown in Figure 12.53.
In this example,
f
135
∼
=
5 × 10
4
Hz
, so we have that
φ =−
tan
−1
5 × 10
4
10
3
+tan
−1
5 × 10
4
5 × 10
4
+tan
−1
5 × 10
4
10
6
or
φ =−
[
88.9
◦
+45
◦
+2.86
◦
]
∼
=
−135
◦
Since we want the loop gain magnitude to be unity at this frequency, we have
|
T ( f )
|
= 1 =
β(1000)
1 +
5 × 10
4
10
3
2
1 +
5 × 10
4
5 × 10
4
2
1 +
5 × 10
4
10
6
2
or
1
∼
=
β(1000)
(50)(1.41)(1)
which yields
β = 0.0707
.
The closed-loop low-frequency gain for this case is
A
fo
=
A
o
1 + β A
o
=
1000
1 + (0.0707)(1000)
= 13.9
Comment: For this value of
β
, if the frequency is greater than
5 × 10
4
Hz
, the loop
gain magnitude is less than unity. If the frequency is less than
5 × 10
4
Hz
, the phase
of the loop gain is
|
φ
|
< 135
◦
(phase margin of 45 degrees). These conditions imply
that the system is stable.
nea80644_ch12_851-946.qxd 6/23/09 1:45 PM Page 917 pmath DATA-DISK:Desktop Folder:23/06/09:MHDQ134-12: