Nelson V. Wind Energy. Renewable Energy and the Environment
Подождите немного. Документ загружается.

250 Wind Energy: Renewable Energy and the Environment
and fuel costs for conventional power plants. Since the cost of fuel for wind energy is zero, that term
will be left out:
COE
I
C
F
C
RLR
C
A
O
M
AEP
(* )
(12.4)
where LRC levelized replacement cost ($/year) and AEP net annual energy production (MWh
or kWh/year).
The COE can be calculated for $/kWh or $/MWh, and the last term could be separate as AOM/
AEP, $/kWh or $/MWh. With histogram data and power curves to calculate annual energy produc-
tion, the cost of energy can be calculated. A rst estimate for levelized replacement costs could be
4–5% of the installed cost.
EXAMPLE 12.6
Wind turbine, 1 MW, IC $1,600,000, FCR 0.07, AEP 3,000 MWh/year, LRC $80,000/year,
AOM $8/MWh $0.008/kWh.
COE
(1,600,000* 0.08) 80,000
3000
8 $77/MWh $
00.077/kWh
That cost of energy needs to be compared to all expected net income from the wind farm, which
includes any incentives, depreciation, and expected rate of return.
Levelized replacement cost distributes the costs for major overhauls and replacements over the
life of the system. For example, in a village power system, storage batteries will need to be replaced
every 5 to 7 years. The levelized replacement cost can be calculated with the following information.
Again, it is an estimate for future replacement costs based on today’s costs of components.
1. Year in which the replace is required, n
2. Replacement cost, including parts, supplies, and labor, RC
3. Present value of each year’s replacement cost, PV
The present value for replacement costs is given by
PV(n) PV(n) * RC(n) (12.5)
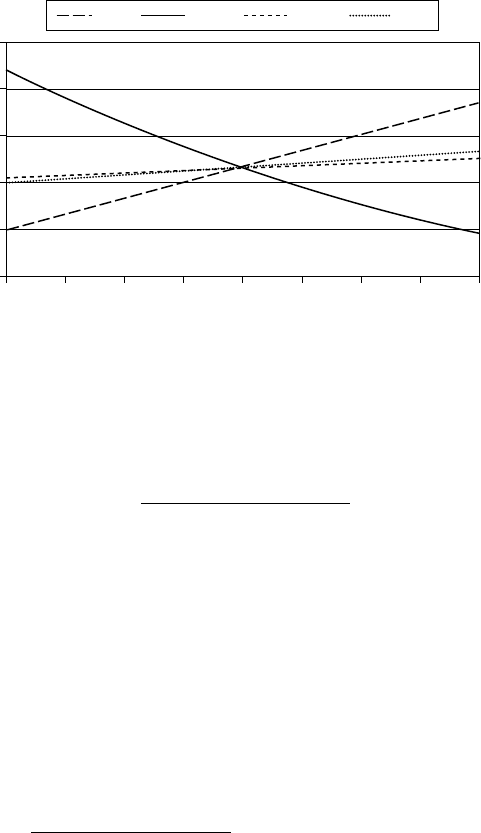
120
110
100
90
80
70
Cost of Energy, $/MWh
–20 –15 –10–5 0 510 15 20
Percent Change
IC AEPAOMLRC
FIGURE 12.1 Sensitivity analysis for cost of energy for wind turbine.
© 2009 by Taylor & Francis Group, LLC

Economics 251
where PVF(n) present value factor for year n (1 I)
n
; I discount rate 0.07, and RC(n)
replacement cost in year n.
The levelized replacement cost is the sum of the present values multiplied by the capital recovery
factor (CRF):
LRC CRF PV
*()n
n 1
20
£
(12.6)
where CRF 0.093.
EXAMPLE 12.7
Calculation of levelized replacement cost for 50 kW turbine. Work done in a spreadsheet.
LRC Calculation
Component Year, n RC(n) I PVF(n) PV(n)
Bearings 10 6,500 0.07 0.508 3,304
Blades 10 5,000 0.07 0.508 2,542
Subtotal 5,846
LRC, $/year 544
Now the COE (120,000 * 0.08 544)/120,000 0.01 $0.095/kWh. This value can be com-
pared with the value in Example 12.5. The problem is the determination of major repairs, year, and
replacement cost.
12.3.3 VALUE OF ENERGY
Another formula [3] for estimating the value of energy is
f
c
rrL
r
o
L
LL
q
()
()()
1
111
§
©
¶
¸
§
©
¶
¸
A
A
(12.7)
where f
o
value of energy saved per year, $; c initial installed cost, $; L years to payback; ]
fuel ination rate; and r interest rate.
Because there is not a factor for operation and maintenance, the interest rate should be increased
by 1–2%. Equation 12.7 can be solved by iteration by using different values of L to calculate the
right-hand side and then comparing that to the left-hand side of the equation. As interest rates
increase, payback times increase; as fuel ination factors increase and cost of electricity increases,
payback times decrease.
12.4 LIFE CYCLE COSTS
A life cycle cost (LCC) analysis gives the total cost of the system, including all expenses incurred
over the life of the system and salvage value, if any [1, 4, 5]. There are two reasons to do an LCC
analysis: (1) to compare different power options, and (2) to determine the most cost-effective system
designs. The competing options to small renewable energy systems are batteries or small diesel
© 2009 by Taylor & Francis Group, LLC

252 Wind Energy: Renewable Energy and the Environment
generators. For these applications the initial cost of the system, the infrastructure to operate and
maintain the system, and the price people pay for the energy are the main concerns. However, even
if small renewable systems are the only option, a life cycle cost analysis can be helpful for compar-
ing costs of different designs or determining whether a hybrid system would be a cost-effective
option. An LCC analysis allows the designer to study the effect of using different components with
different reliabilities and lifetimes. For instance, a less expensive battery might be expected to last
4 years, while a more expensive battery might last 7 years. Which battery is the best buy? This type
of question can be answered with an LCC analysis.
LCC IC M
PV
E
PV
R
PV
S
PV
(12.8)
where LCC life cycle cost, IC initial cost of installation, M
PV
sum of all yearly O&M costs,
E
PV
energy cost, sum of all yearly fuel costs, R
PV
sum of all yearly replacement costs, and S
PV
salvage value, net worth at end of nal year, 20% for mechanical equipment.
Future costs must be discounted because of the time value of money, so the present worth is
calculated for costs for each year. Life spans for wind turbines are assumed to be 20 to 25 years;
however, replacement costs for components need to be calculated. Present worth factors are given
in tables or can be calculated. Life cycle costs are the best way of making purchasing decisions. On
this basis, many renewable energy systems are economical.
The nancial evaluation can be done on a yearly basis to obtain cash ow, break-even point,
and payback time. A cash ow analysis will be different in each situation. Cash ow for a business
will be different from a residential application because of depreciation and tax implications. The
payback time is easily seen, if the data are graphed.
EXAMPLE 12.8
Residential application with rebate, IC $25,000, down payment $7,000, loan $18,000 at 10%
(payment $4,000/year), O&M 2.5% * IC $500/year, energy production 50,000 kWh/year (75%
consumed directly, displacing 8 cents/kWh electricity, and 25% sold to the utility at 4 cents/kWh, with
utility escalation at 3%/year). Cash ow done in a spreadsheet.
Year 0–1 2 3 4 5 6 7 8 9
Down payment 7,000
Principal left 18,000 15,800 13,380 10,718 7,790 4,569 1,026 0
Principal paid 2,200 2,420 2,662 2,928 3,221 3,543 3,897 1,128
Interest 1,800 1,580 1,338 1,071.8 778.98 457 103 0
O&M 500 500 500 500 500 500 500 500 500
Insurance 50 50 50 50 50 60 60 60 60
Property tax 70 70 70 70 70 70 70 70 70
Costs 7,620 4,620 4,620 4,620 4,620 4,630 4,630 1,758 630
Value energy used 3,000 3,090 3,183 3,278 3,377 3,478 3,582 3,690 3,800
Value energy sold 500 515 530 546 563 580 597 615 633
Rebate 4,000
Income 7,500 3,605 3,713 3,825 3,939 4,057 4,179 4,305 4,434
Cash ow –120 –1,015 –907 –795 –681 –573 –451 2,546 3,804
Cumulative –1,135 –1,922 –1,702 –1,476 –1,253 –1,023 2,096 6,350
In this analysis the payback time is in year 8. There are a number of assumptions about the future in
such an analysis. A more detailed analysis would include ination and increases on costs for operation
and maintenance as the equipment becomes older.
© 2009 by Taylor & Francis Group, LLC
Economics 253
A cash ow analysis for a business with $0.02/kWh tax credit on electric production and depre-
ciation of the installed costs would give a different answer. Also, all operating expenses are a busi-
ness expense. The economic utilization factor is calculated from the ratio of the costs of electricity
used at the site to that of the electricity sold to the utility.
The core of the RETScreen tools [6] consists of a standardized and integrated renewable energy
project analysis software that can be used to evaluate the energy production, life cycle costs, and
greenhouse gas emission reductions for the following renewable energy technologies: wind, small
hydro, PV, passive solar heating, solar air heating, solar water heating, biomass heating, and ground-
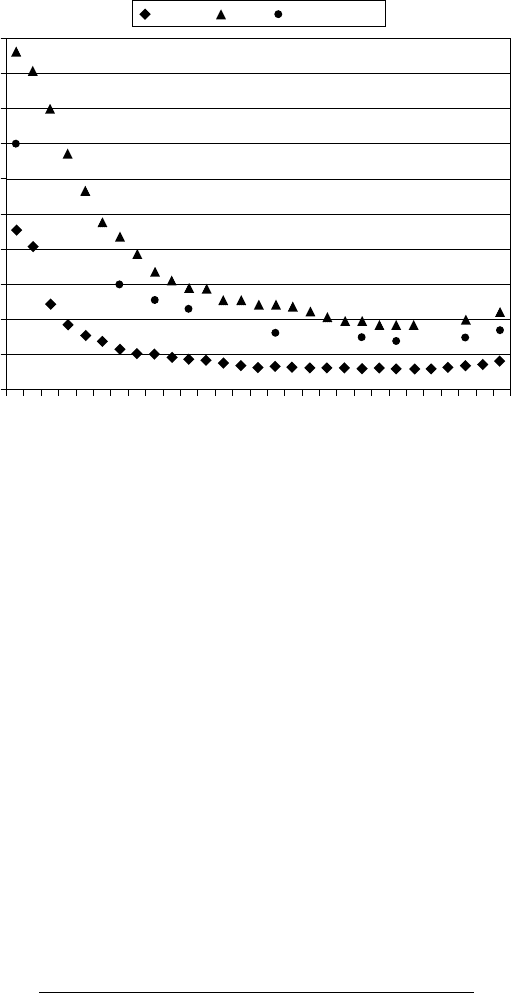
source heat pumps. The Hybrid2 software package [7] includes economic analysis. The cost of energy
for wind, photovaltic, and solar thermal have decreased dramatically since 1980 (Figure 12.2).
12.5 PRESENT WORTH AND LEVELIZED COSTS
Money increases or decreases with time, depending on interest rates for borrowing or saving and
ination. Many people assume energy costs in the future will increase faster than ination. The
same mechanism of determining future value of a given amount of money can be used to move
money backward in time. If each cost and benet over the lifetime of the system were brought back
to the present and then summed, the present worth can be determined:
PW
S
(cost total for year ) (financial benefiit total for year )
1
S
d
M
(12.9)
where cost total negative cash ow, S specic year in the wind system lifetime, M years from
the present to year S, and d discount rate.
The discount rate determines how the money increases or decreases with time. Therefore, the
proper discount rate for any life cycle cost calculation must be chosen with care. Sometimes the cost
of capital (interest paid to the bank, or alternately, lost opportunity cost) is appropriate. Possibly
the rate of return on a given investment perceived as desirable by an individual may be used as the
100
90
80
70
60
50
40
30
20
10
0
Cents/kWh
80 82 84 86 88 90 92 94 96 98 00 02 04 06 08
Wind PV Solar thermal
FIGURE 12.2 Cost of energy for generation of electricity: wind, photovoltaic, and solar thermal ($ 2008).
© 2009 by Taylor & Francis Group, LLC

254 Wind Energy: Renewable Energy and the Environment
discount rate. Adoption of unrealistically high discount rates can lead to unrealistic life cycle costs.
The cost of capital can be calculated from
CC
1 l n interest rate
1 inflation rate
1
oa
If the total dollars are spread uniformly over the lifetime of the system, this operation is called
levelizing.
annualized cost
(1 )
(1 ) 1
PW d d
d
P
P
(12.10)
where P number of years in the lifetime.
One further step has been utilized in assessing renewable energy systems versus other sources
of energy such as electricity. This is the calculation of the annualized cost of energy from each
alternative. The annualized cost calculated from Equation 12.8 is divided by the net annual energy
production of that alternative source;
COE annualized cost/AEP
It is important that annualized costs of energy calculated for renewable energy systems are com-
pared to annualized costs of energy from the other sources. Direct comparison of annualized cost
of energy to current cost of energy is not rational. Costs of energy calculated in the above manner
provide a better basis for the selection of the sources of energy.
RETFinance is an internet-based cost of electricity model [8] that simulates a 20-year nominal
dollar cash ow for a variety of renewable energy power projects. It is difcult to compare cost and
COE for different years without taking into account the effects of ination. There are a number of
sites on the Web for calculating ination from past years to the present [9]. As an example, installed
costs for wind farms in 2003 were $1,000/kW, which is equivalent to $1,160/kW in 2008. Of course,
the amount of ination in the future is a guess.
12.6 EXTERNALITIES
Externalities are now playing a role in integrated resource planning (IRP), as future costs for pol-
lution, carbon dioxide, etc., are added to the life cycle costs. Values for externalities range from
zero (past and present value assigned by many utilities) to as high as $0.10/kWh for steam plants
red with dirty coal. Again, values are being assigned by legislation and regulation (public utility
commissions).
As always, there is and will be litigation by both sides. The Lignite Energy Council petitioned
the Minnesota Public Utilities Commission to reconsider its interim externality values. The coun-
cil represents major producers of lignite, investor-owned utilities, rural electric cooperatives, and
others. They focused their protest on values assigned to CO
2
emissions, as their position was that
there was an acknowledged lack of reliable science that CO
2
emissions are harmful to society. In
Europe, different values have been assigned to CO
2
emissions, which makes wind energy more
cost-competitive.
Wind turbines have three main benecial externalities: local source of energy, the generation
of electricity does not require water, and they do not emit greenhouse gasses. In Texas, fossil fuel
power plants use 1,670 L/MWh [10], so the 4,500 MW of wind power in Texas (2007) will save
water, 23 * 10
6
m
3
/year. An average of 700 kg of CO
2
/MWh is emitted from coal and natural gas
power plants. That 4,500 MW of wind in Texas will reduce CO
2
emissions by 9 * 10
6
metric tons
© 2009 by Taylor & Francis Group, LLC
Economics 255
per year. The present value for CO
2
trading in Europe is $30/metric ton, which is equivalent to $20/
MWh, and to around $30/MWh if replacing coal plants.
12.7 WIND PROJECT DEVELOPMENT
The three most important considerations for development of wind farms are:
1. Land with good to excellent wind resource
2. Contract to sell electricity produced
3. Access to transmission lines (proximity and carrying capacity)
The American Wind Energy Association [11, 12] and Wind Powering America [13] also have
information on project development. The project development list covers many areas; however, it
was placed in economics, as that is the nal decision on a project. Much of the information was
from Disgen [14].
PROJECT DEVELOPMENT
1. Site selection
1.1. Evidence of signicant wind resource
1.2. Preferably privately owned remote land
1.3. Proximity to transmission lines 69 kV (up to 25 miles for good site and 135 kV).
Note possibility of future transmission lines.
1.4. Reasonable road access
1.5. Few environmental concerns
1.6. Receptive community
2. Land
2.1. Term: Expected life of the turbine (early, 20–30 years, 10-year option; later, 30–50 years,
multiple 10-year options)
2.2. Rights: Wind rights, ingress/egress rights, transmission right-of-way for wind farm
2.3. Owner compensation: Percentage of revenue, per turbine, or combination
2.4 Assignable: Financing requirement
2.5 Indemnication
2.6 Reclamation provision
2.7 Bond to remove wind turbines at end of project
2.8 Wind energy easements, legal issues
3. Wind resource assessment
3.1. Lease, $/acre, 1–5 years, or at fee
3.2. Corollary data: Wind maps (national, state, other), NWS data, other
3.3. Install meteorological tower(s), hub height or at least 50 m
3.4. Collect 10 min or an hour of wind speed and direction data, 1–2 years, minimum
1 year
3.5. Quality report on meteorology
3.6. Output projections for several turbine types
3.7. Landowner receives data, meteorology report, and output projections if developer
does not exercise option for installation of project.
4. Environmental
4.1. Cursory review for endangered species
4.2. Biological resources
4.2.1. Wildlife habitat
4.2.2. Loss of vegetation
© 2009 by Taylor & Francis Group, LLC
256 Wind Energy: Renewable Energy and the Environment
4.3. Avian studies
4.3.1. Raptors
4.3.2. Migratory birds
4.3.3. Review with interested parties: Audubon, federal, state, local
4.3.4. Required studies and reports
4.4. Bats
4.5. Archeological sites
4.6. Noise
4.7. Visual
4.8. Soil erosion and water quality
4.9. Solid and hazardous wastes
4.10. Active compliance monitoring
5. Economic modeling
5.1. Output projections (see Section 3.6)
5.2. Turbine costs
5.3. Turbine installation
5.4. Roads, substations, transmission
5.5. Communication and control
5.6. Taxes: Sales, income, property (depreciation schedule), tax abatement
5.7. O&M estimates
5.8. Finance assumptions: Production tax credit, accelerated depreciation, equity rate of
return, incentives (local, state), debt rate and term (coverage ratios), debt/equity ratio
5.9. Other: Insurance, legal
6. Interconnection studies
6.1. Interconnection request, electric reliability council
6.2. Capacity limitation
6.3. Load ow analysis
6.4. Voltage controls
6.5. System protection
7. Permits
7.1. Local, state, federal
7.2. Public involvement at early stage
7.3. Public land, private land
7.3.1. Land use permit
7.3.2. Building permit
8. Sale of energy/power
8.1. Energy/power purchase agreement
8.1.1. Long-term contract with utility
8.1.2. Green power market
8.1.3. Market, avoided cost
8.1.4. Renewable energy credits
8.1.5. Future income, emission trading
8.2. Kilowatt hour: Real or nominal levelized
8.3. Capacity: Kilowatts
8.4. Term
8.5. Credit-worthy buyer
8.6. Facility sales agreement
8.7. Turnkey price, complete project
9. Financing
9.1. Source of equity; rate of return, 15–18%
9.2. So
urce of debt
© 2009 by Taylor & Francis Group, LLC
Economics 257
9.3. Market rates
9.4. Term of debt
9.5. Assignable documents
9.6. Third-party due diligence
10. Turbine purchase
10.1. Power curve (output projection)
10.2. Turbine cost
10.3. Turnkey construction cost
10.4. Warranties, equipment and maintenance
10.5. Const r uct ion na nci ng
10.6. Past history of manufacturer
10.7. Availability of turbines, date
11. Construction (turnkey)
11.1. Roads
11.2. Water and gravel
11.3. Turbine foundations (excavation, concrete)
11.4. Interconnection to utility (substations, transformers, wire)
11.5. Turbine assembly and erection (cranes)
11.6. Commissioning
11.7. Environmental restoration
11.7.1. Reduce road width?
11.7.2. Grass
11.7.3. Control of noxious weeds
11.7.4. Assembly area
12. Maintenance
12.1. Fixed cost per turbine per year
12.2. Availability warranties
12.3. Penalties for nonperformance
12.4. Types of costs
12.5. Labor
12.6. Management
12.7. Insurance, taxes
12.8. Maintenance equipment: cranes, vehicles, other
12.9. Parts on hand
12.10. Nonrecurring costs, major repairs
12.11. Roads, maintenance and access for landowner
The following example shows the main points of a contract signed by the Permanent University
Fund, State of Texas, for a Woodward Mountain wind farm (32 MW) near McCamey (year
2000).
Area: 602 ha (1,487 acres); period, 20 years, with option to terminate early
Installation bonus: $2,000/MW security deposit
Royalty: 4% years 1–10, 6% years 11–20, minimum annual royalty projected income stream
Turbine: 48, Vesta V47, 660 kW
RECs: Royalty paid if any value realized
Removal bond: Mutual agreement
Hunting: Company indemnied
University audits, independent outside auditor
Meter calibration required every 3 years
Curtailment shared by all landowners
© 2009 by Taylor & Francis Group, LLC
258 Wind Energy: Renewable Energy and the Environment
For wind farms, the landowner may receive one or more offers, and the leases (Table 12.2) will
differ by region, wind resource, and access to transmission. Some landowners are forming associa-
tions for dealing with wind farm developers. In the United States, wind turbines can be installed on
land currently under the Conservation Reserve Program (CRP); however, there may be a penalty or
reimbursement, which is decided by the CRP district.
Other considerations for the landowner are: Who certies the energy meter? And when? If there is
future revenue from pollution credits, the landowner should share in that return. In countries where
the national or state governments control the land, the question concerns present occupants, who and
when receives payment (once or annual), and how much is paid for land removed from previous use.
The construction phase of a wind farm project will take from 6 months to a year, while the total
development time from selection of land to commission may take up to 6 years (Table 12.3). Wind
farms can be installed much faster than transmission lines can be built. Besides the production tax
credits, a limiting factor that began in 2008 was that the demand for wind turbines was larger than
production, which means lead times for delivery are 2 to 3 years after purchase orders.
12.7.1 COSTS
The installed costs have increased from around $1.2 million/MW in 2003 to $1.6–2 million in 2008
(both in $ 2008), because of the increase in the price of steel, copper, and cement. Also, the price
TABLE 12.2
Representative Lease for Wind Farm
Resource
Flat fee
$/acre/year
1–3 year
$10,000
$1–4
Contract
Option
30 year
2 (10 year)
Construction, road, etc.
Flat fee
$3–4/month
$4,000/MW
Income/year
Royalty Per turbine (minimum)
4%
$4,000/MW
Escalation 0.5% every 5 years
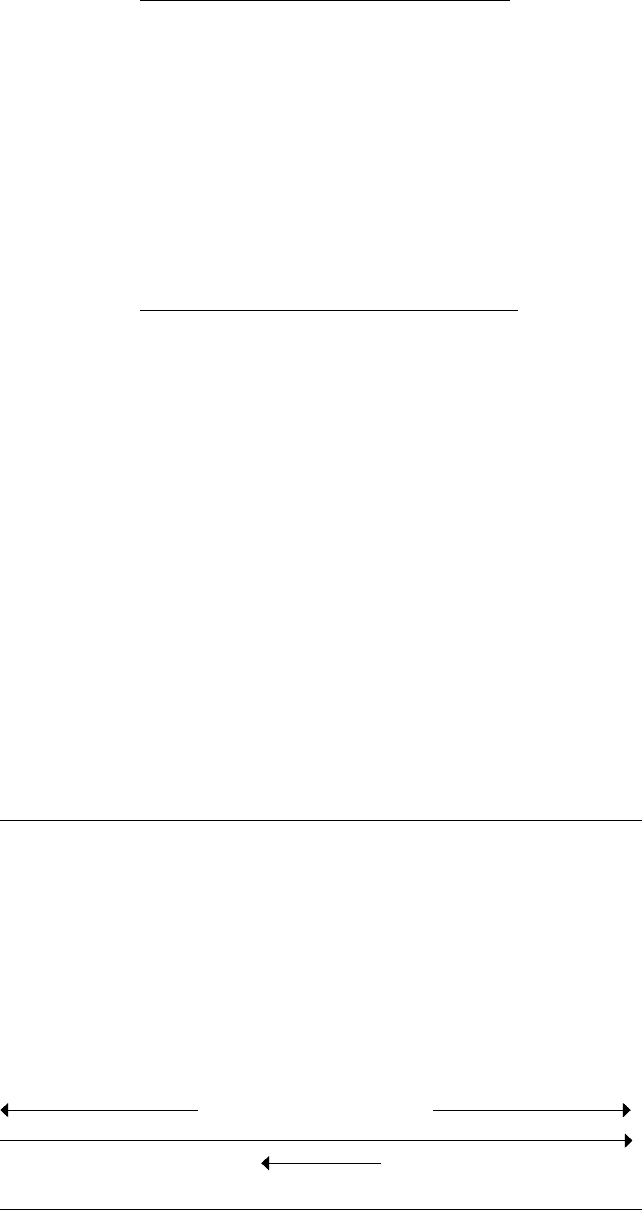
TABLE 12.3
Representative Wind Farm Project Timeline
Site Evaluation Permitting and Negotiation Construction, Commission
Identify site, conduct
preliminary evaluation, secure
land options
5–8 months
Permits, land use, transmission
Negotiate power purchase
agreement, interconnect
12–36 months
Construction
4–12 months
Install anemometers, collect
and analyze data
12–24 months
Turbine purchase agreement
12–36 months
Commission
1–2 months
Developer (36–72 months)
Turbine supplier (24–36
months)
© 2009 by Taylor & Francis Group, LLC

Economics 259
is higher because the world demand for wind turbines is higher than production. A comparison of
the estimated components of the cost of energy shows, as expected, that capital cost is the major
component [15], and the primary installed cost is for the wind turbine (Table 12.4). The installed
cost for offshore wind farms is around 1.5 times that for wind farms on land.
12.7.2 BENEFITS
Wind farms represent rural economic development with the primary benet of long-term stable
income (no uctuations compared to commodity prices) to the landowner. Representative num-
bers are for a wind farm (30 MW or greater) using capacity factors of 30% in wind class 3 and
35% in wind class 4. A 50 MW wind farm would require 1,200 ha (1 ha 2.5 acres), which can
include ten to thirty landowners. Around 1–3% of the land is removed from production, primar-
ily for roads. The return on land removed from previous use is around $10,000–16,000/ha/year,
a much greater return per hectare than farming or ranching. In contrast to oil and gas leases, the
return to the landowner is less from wind farms; however, there is the big advantage of a nonde-
pletable resource.
The rural economic development also includes construction and then operation. During con-
struction there will be 100–200 jobs for 4–8 months, around 1 man-year per MW. The administra-
tion and operation and maintenance of wind farms results in ten to fourteen full- time jobs per 100
MW. This shows why state legislatures and local entities are now promoting wind power, and also
promoting the manufacturing of turbines and components in their state.
The Colorado Green Wind Power Project near Lamar, Colorado, is an example. Construction
started in the summer of 2003. The 162 MW project consists of 108 GE wind turbines (1.5 MW)
on a lease of 4,450 ha from fourteen landowners. The footprint from the wind farm is about 2%
of the land. During construction there were 200 to 300 jobs, and after completion, there were
around 15 local jobs. The wind farm pays around $2 million per year in property taxes. After
construction, the project was purchased for $212 million by Shell Wind and PPM Energy from
GE Wind.
12.7.3 SALE OF ELECTRICITY
The crunch number for a project is the sale price of electricity generated by the wind farm. For
some older contracts for wind farms in Texas, the sale price was below $0.025/kWh for a 15-year
contract. The only way this could happen was with the production tax credit, accelerated deprecia-
tion, tax abatements, and renewable energy credits (RECs). For wind farms being installed today
TABLE 12.4
Percent Component Costs for Wind Farm Installation
%
Turbine 74–82
Foundation 1–6
Electric 1–9
Connection to the grid 2–9
Finance 1–5
Land 1–3
Roads 1–5
Consultants 1–3
© 2009 by Taylor & Francis Group, LLC