Poole Ch.P., Jr. Handbook of Superconductivity
Подождите немного. Документ загружается.

626 Chapter 14: Phase Diagrams
A
Introduction
Investigation of high-temperature superconductor materials has become an
exciting and extensive research area in the past 10 years. Since the initial
report of the 30 K superconductor by Bednorz and Miiller (1986), a large
number of multicomponent oxide materials have been discovered (Cava, 1995);
most of these compounds exhibit complex chemistry, including nonstoichiometry,
defects, and incommensuracy. International efforts in superconductivity research
have led to many alternative methods of processing as well as novel applications.
The developments of coated conductors utilizing the BazYCu306+ x and
Ba2RCu306+x (R=lanthanides) phases with ion beam assisted deposition
(IBAD) and rolling assisted biaxially textured substrate (RABiTS) techniques
have prompted the intensive investigations of these systems in thin- and thick-
film forms (Goyal
et al.,
1996; Wu
et al.,
1995; Paranthaman
et al.,
1997). In the
BizO3-PbO-SrO-CaO-CuO systems (BSCCO), the Bi-containing materials
were found to show promising superconducting and other properties that are
appropriate for wire and tape applications using the powder-in-tube (PIT)
techniques (Balachandran
et al.,
1994; Sandhage
et al.,
1991; Sato
et al.,
1991; Malosemoff
et al.,
1997; Zhou
et al.,
1995) for fabrication. These novel
processes have brought superconducting technology closer to reality. Presently,
high-quality high-temperature superconducting materials are still relatively diffi-
cult to prepare. Challenging problems have to be overcome for large-scale
commercial processing to be successful (Wong-Ng, 1999). At a more basic
level, the underlying principles governing the superconducting properties are not
totally understood.
Phase diagrams are critical research tools for many scientific disciplines,
including materials science, ceramics, geology, physics, metallurgy, chemical
engineering, and chemistry. These diagrams contain important information for
the development of new materials, control of structure and composition of critical
phases, and improvement of properties of technologically important materials.
Phase diagrams can be thought of as "road maps" for processing; they provide
the theoretical basis for synthesis of high-T c materials. Applications of phase
diagrams range from preparation of high-quality single crystals and single-phase
bulk materials to deliberate precipitation of second phases as flux pinning sites
(Majewski, 1996; Majewski
et al.,
1995a; Tiefel
et al.,
1990) and the formation of
melts. The presence of melts can have a beneficial effect on superconductor
processing. For example, melts were found to be essential during PIT processing
of Bi-2223 and 2212 wires, and during the production of textured or crystal-
lographically aligned material in tapes or thin films (Aksenova
et al.,
1993; Zhang
and Hellstrom, 1993).
The aim of this chapter is to provide experimental phase diagrams of high-
T c superconductors representative of systems undergoing research. Among
B. General Discussion and Scope 627
current systems, the BaO-Y203-CuO (BYC), BaO-R203-CuO (BRC), and
BSCCO systems have been studied most extensively. A brief description of
some of the frequently encountered terms used in phase equilibrium work, as well
as a few experimental techniques involved in determining some of these
diagrams, are also presented prior to the discussion of the diagrams.
In the following description of the multicomponent systems, a numerical
code is used to indicate the stoichiometry of compounds in the order in which the
cations are listed. For example, the symbol 213 (or 2:1:3) is used to represent
the compound BazYCu306+x, and the symbol 2212 (or 2:2:1:2) is used to
represent the compound BizSrzCaCu20 x and its solid solution.
General Discussion and Scope
a. Information Provided
Before any research and development is conducted on material synthesis or
processing, it is logical to first study the relevant phase diagrams to obtain
information about the phase relationships and other characteristics of the material.
Phase diagrams can be used to depict a wide range of information, such as (1)
identity of compounds formed from specific end members, (2) stability range,
composition, and temperature range of a specific phase, (3) the optimum
conditions for synthesis, (4) the impurities likely to be present with a phase
prepared under specific conditions, (5) the region of homogeneity of solid
solutions, (6) polymorphism of a phase, (7) temperature and composition range
suitable for glass formation, (8) melting temperature (or temperature range) of a
compound, (9) primary phase field (crystallization composition field) of a phase,
(10) effect of admixture on the melting point or stability of a phase, (11) effect of
temperature and pressure on processing, and (12) prediction of properties of the
final products, based on the phase assemblage.
b. Key Terms Used
The frequently encountered nomenclature and the general terms discussed in the
following sections are briefly described next. For a more complete set of
definitions and a glossary, refer to Volume 1 of Phase Diagrams for Ceramists
(Levin et al., 1964).
A solidus is the locus of temperature-composition points in a system at
temperatures above which solid and liquid are in equilibrium and below which the
system is completely solid. In binary diagrams without solid solutions, it is a
straight line, or a combination of straight lines representing constant tempera-
628
Chapter
14:
Phase Diagrams
tures, and with solid solutions, it is a curved line or a combination of curved and
straight lines. Likewise, in ternary systems, the solidus is represented by flat
planes or by curved surfaces.
A phase
is any portion, including the whole, of a system that is physically
homogeneous within itself and bounded by a surface that mechanically separates
it from any other portions.
The
components
(of a system) are the smallest number of independently
variable chemical constituents necessary and sufficient to express the composi-
tion of each phase present in any state of equilibrium. Zero and negative
quantities of the components are permissible in expressing the composition of
a phase.
The
phase rule
states that, for a system in equilibrium, the sum of the
number of phases (P) plus a number of degress of freedom (F) must equal the sum
of the number of components (C) plus 2, or P + F = C + 2.
The number of
degrees of freedom
of a system is the number of intensive
variables that can be altered independently or arbitrarily without bringing about
the disappearance of a phase or the formation of a new one. Intensive variables
are those that are independent of mass, such as pressure, temperature, and
composition.
A join
(tie-line) is the region of a phase diagram representing all mixtures
that can be formed from a given number of selected compositions. A join may be
a line (binary), a surface (ternary), etc., depending on the number of selected
compositions, which need not be compounds. Each selected composition,
however, must be incapable of formation from the others.
The
lever rule
(or center of gravity principle) states that when a particular
composition separates into only two phases, the given composition and that of the
two phases are colinear; furthermore, the amounts of the two separated phases are
inversely proportional to their distances from the given composition. Thus, if A
and B represent the compositions of two phases formed from composition C, then
the amount of A times the length AC equals the amount of B times the length BC,
or A/B = BC/AC:
X ...... X .......... X
A C B
The
composition (or compatibility) triangle
in the phase diagram of a
condensed ternary system is the area bounded by three tie-lines (joins) connecting
the composition points of three phases that are in equilibrium within the triangle.
The
composition (or compatibility) tetrahedron
in the phase diagram of a
condensed quaternary system constitutes the four triangular planes connecting the
compositions of four solid phases that can coexist in equilibrium with liquid. The
composition of the liquid is represented by a
quaternary invariant point,
which
may be either a eutectic point within the composition tetrahedron or a peritectic or
reaction point outside the tetrahedron.
B. General Discussion and Scope 629
A solid solution is a single crystalline phase that may be varied
in composition within finite limits without the appearance of an additional
phase.
A liquidus is the locus of temperature-composition points representing the
maximum solubility (saturation) of a solid phase in the liquid phase. In a binary
system, it is a line; in a ternary system, it is a surface, usually curved. At
temperatures above the liquidus, the system is completely liquid. A point on the
liquidus represents equilibrium between liquid and, in general, one crystalline
phase (the primary phase).
The primary phase is the only crystalline phase in equilibrium with a liquid
of a given composition. It is the first crystalline phase to appear on cooling a
composition from the liquid; or conversely, it is the last crystalline phase to
disappear on heating a composition to melting.
The primary phase region (or primary phase field) is the locus of all
compositions in a phase diagram having a common primary phase.
The invariant points are the particular conditions within a system, in terms
of pressure, temperature, and composition, for which the system possesses no
degrees of freedom. An example is the triple point of a gas.
A eutectic represents an invariant (unique temperature, pressure, composi-
tion) point for a system at which the phase reaction on the addition or removal of
heat results in an increase or decrease of the proportion of liquid to solid phases,
without change of temperature. At a eutectic point the composition of the liquid
phase in equilibrium with the solid phases can always be expressed in terms of
positive quantitatives of the solid phases.
The eutectic composition is that combination of components in a simple
system having the lowest melting temperature at any ratio of the components and
is located at the intersection of the two solubility curves in a binary system and of
the three solubility surfaces in a ternary system.
A peritectic point is an invariant point at which the composition of the
liquid phase in equilibrium with the solid phases cannot be expressed in terms of
positive quantities of the solid phases. Whereas the composition of a eutectic
point always lies between or within the composition limits of the solid phases in
equilibrium with the liquid, the composition of a peritectic point always lies
outside the composition limits.
A congruent melting point is a specified pressure and temperature at which
a solid subtance changes to a liquid of identical chemical composition.
An incongruently melting point is a specified pressure and temperature at
which one solid phase transforms into another solid phase plus a liquid phase,
both of different chemical compositions than the original substance.
A boundary line is the intersection of adjoining liquidus surfaces in a
ternary phase diagram. The area enclosed by a series of boundary lines is termed
a primary phase area.
An isothermal section is a phase equilibrium diagram constructed at a given
specific temperature.
630 Chapter 14: Phase Diagrams
Liquid immiscibility
refers to two or more distinct liquid phases coexisting
in equilibrium.
c. Phase Diagram Compilations
Various sources of information are needed for users for pursuing phase diagram
studies. For more than 60 years, a long-standing cooperative effort between NIST
and the American Ceramics Society (ACerS) has resulted in an extensive set of
compilations of Phase Diagrams for Ceramists (PDFC) (NIST,
Phase Diagrams
for Ceramists.
To date, these compilations include 12 volumes of oxides, salts,
and refractory materials, three annual volumes of diagrams published in 1991,
1992 and 1993. In addition, two volumes containing high-temperature super-
conductor data, including diagrams, write-ups and biblographic information, were
also published in 1991 and 1997
(Superconductors,
Vol. I and II) (Whitler and
Roth, 1991; Vanderah
et al.,
1991). These phase diagrams are mostly from the
literature, and the data have been edited by experts in the field. Under this
NIST/ACerS phase diagram effort, technical expertise in the compilation of
phase diagrams is provided by NIST researchers and by various university,
industry, and government collaborations. The ACerS assumes the responsibility
for the production aspects of the work and for all means of data dissemination.
The PDFC series have also been computerized and published in the form of
a CD-ROM database (version 2.1). This database contains more than 13,000
diagrams published in the
Phase Diagrams for Ceramists,
Vol. I through X,
Annuals 1991, 1992, and 1993, and
High-T c Superconductors,
Vol. I. Future
supplements will also include
High-T c Superconductors,
Vol. II. Computer search
capabilities include authors, system components, year of publication, biblio-
graphic reference, and location in the PDFC series. On-screen manipulations of
the diagrams are also possible, which include plotting of the diagrams, magni-
fication of selected regions, conversion from mole fraction (%) to weight % (or
vice versa), lever rule calculations, overlay of related diagrams, display of the
cursor position in real units, reverse function for binary diagrams (permits
switching of left and fight end members), and a curve follow feature to track
curve coordinates.
Computer and software developments have prompted increased applica-
tions of databases for materials analysis. If the phase diagram information of a
specific system is not complete, one can search through other sources of
databases in conjunction with the phase diagram database for providing addi-
tional phase information. These databases include the Powder Diffraction file
(PDF) produced by ICDD, 1 the Crystal Data database (NIST), the Crystal
Structure Series (Wyckoff), the Inorganic Crystal Structural Database (ICSD),
IlCDD, International Center for Diffraction Data, Newton Square; 12 Campus Blvd, Newton Squares,
PA 19073-3273.
C. Experimental Methods 631
Structural Data on Intermetallic Phases (CRYSTMET) (Toth Information
Systems), and the NIST/Sandia/ICDD Electron Diffraction Database (NIST).
ICDD has identified a subtile of high-T c superconductors and related phases
(such as those found in phase diagrams, products of reaction with container
materials, with thin film substrates and conventional superconductors) (Wong-Ng
et al.,
1996).
C
Experimental Methods
A phase diagram is usually constructed using a combination of methods. For
subsolidus phase diagrams, a number of compositions are prepared in the region
of interest, followed by the determination of the phase assemblages present. Tie-
lines connecting phases in equilibrium are determined in this way. When a new
phase is discovered, the structure can be studied either by using single crystals, or
by
ab initio
structural determination using the powder sample. The experimental
methods for determining phase diagrams are generally divided into two types:
static and dynamic. In the static methods, the temperature of the sample is held
constant until equilibrium is attained. The most widely used of these is the
quenching method (air quench or quench into a medium such as water bath, oil,
liquid nitrogen cooled helium). Quenching studies in combination with powder
X-ray diffraction and petrographic microscopy for phase identification are
essential for obtaining subsolidus phase diagrams. Liquidus phase diagrams
require further experiments for determining the melting temperatures of phases
or assemblages, and the estimation of liquid compositions. Dynamic techniques,
including differential thermal analysis (DTA) and thermogravimetric analysis
(TGA), are needed to obtain an indication of phase transitions, reactions, and
associated loss of volatiles, such as oxygen. Scanning electron microscopy (SEM)
techniques are used to study the microstructures of the experimental products,
particularly of the primary crystals. Quantitative microanalysis techniques,
including energy dispersive x-ray analysis (EDX) or wavelength dispersive
methods, are used for the determination of the compositions of the residual
grains (primary crystals) and of the quenched liquid.
a. Quenching Methods
For relatively fast quenching, experiments are generally carried out using a
vertical tube furnace. Upon achieving equilibrium, the sample is dropped into the
quenching medium (Wong-Ng and Cook, 1995). The goal of this type of
experiment is to capture the phase assemblages and microstructure by cooling
from high temperature to room temperature in a few seconds. The sample is
632
Chapter 14: Phase Diagrams
contained in a small crucible suspended from the thermocouple assembly by thin
wires (such as Pt). After insertion of the sample, the vertical-tube furnace is
valved off and flushed with desired gas. The sample is then equilibrated in the hot
zone of the furnace in the presence of flowing gas of the desired atmosphere. At
the conclusion of the experiment, current is passed through the thin suspension
wires, causing them to melt. For controlled atmospheric quenching, the sample
drops into a liquid nitrogen (LN2)-cooled copper cold well, with helium flowing
at a rapid rate. This prevents reaction of the sample with atmospheric constituents
during the quench.
b. X-ray Powder Diffraction
X-ray diffraction is a very convenient and nondestructive method for phase
identification. Results can show if the composition is a single phase, a mixture of
phases that correspond to the compositional tie-line of a two-phase system, or an
aggregate of higher component regions. In order to study lattice parameters for
establishing or confirming the formation of solid solution, the powder x-ray
diffraction method can also be used. In these methods instrumental (external) and
internal calibrations can be achieved by using standard reference materials (SRM)
produced by NIST (Hubbard
et al.,
1987; Hubbard, 1982). For atmospherically
sensitive materials, a special cell with an O-ring seal can be employed to avoid
reaction with atmospheric CO2 and H20 during analysis (Ritter, 1988). Signal
absorption can be minimized by employing an X-ray transparent window.
c. Differentiation Thermal Analysis and Thermogravimetric
Analysis
Thermal analysis is a technique that measures a physical property of a substance
as a function of temperature, generally under a controlled temperature program.
In the case of the TGA experiment, the weight of a specimen is measured as a
function of time (or temperature). The changes of the weight before and after the
experiment can be determined. In a DTA experiment, a sample and a reference
material (usually alumina in the high-T c superconductor experiments) are heated
(or cooled) at a uniform rate and the difference in temperature between the two is
plotted as a function of the temperature of the reference sample or furnace
temperature. From the characteristic of the peak observed along the DTA curve,
an exothermic or endothermic event involving the sample can be determined.
C. Experimental Methods
633
d. Scanning Electron Microscopy
During the SEM experiment, a focused electron beam is swept over the surface of
a specimen in a raster pattern, and various resulting emissions from the sample
(backscattered electrons, secondary electrons, or X-rays) are detected. An image
is formed on a cathode ray screen by mapping the intensity of the detected signal
as a function of position. Combining this technique with an X-ray spectrometer
allows chemical analysis of a microvolume of the sample.
e. Determination of Liquid Compositions
In general, after a sample is melted and solidified, the liquid will assume the form
of an amorphous state and one can easily distinguish the amorphous regions from
the primary crystals after melting. In the case of high-temperature superconduct-
ing oxides, often the melts recrystallize instantaneously as crystals. This is
particularly true in Ba-Cu-O and related systems, where relatively large
barium cuprates form and it is difficult to distinguish between primary crystals
and crystals crystallized from liquid. In this situation a wicking technique can be
used (Wong-Ng and Cook, 1995). To capture liquid free of any primary crystal-
line phases for SEM/EDX analysis, a sintered ceramic wick with open porosity
(i.e., MgO) can be placed in the crucible with the appropriate sample. During the
heat treatment, liquid is drawn into the wick by capillary action. Because of the
filtering action of the small (<5-10 l~m) openings in the wick, primary solid
phases do not enter the capillary. During the quench, the liquid is retained in the
wick, thus making a representative sample of the melt available for analysis.
The liquid composition can be obtained most directly by using electron
probe microanalysis. This method measures the intensity of characteristic X-rays
emitted from a specimen and relates this intensity to the concentration of the
elements involved. Standardization using samples of known composition is
essential. Corrections for the atomic number Z, the absorption A, and the
fluorescence F (ZAF method) must be applied to the intensity ratios. A detailed
description of quantitative microanalysis is given by Heinrich and Newbury
(1991). Modem software such as DTSA (Fiori
et al.,
1991) facilitates the
application of these methods.
fi Vapor Pressure Measurements
For the equilibrium study of vapor pressure of T120 in the Tl-containing
superconducting systems, an efficient method is the two-zone technique (Aselege
634 Chapter 14: Phase Diagrams
et al.,
1994), which utilizes a condensed thallium oxide source to supply a
constant partial pressure of T120 vapor through the vaporization reaction
2 T120 x(c) < > 2 T12 O(v) + (x - 1)O
2 (V).
(1)
Using this procedure, the sample, which is in powder form, and the condensed
thallium oxide (T1203) are each held typically in high-purity A1203 boats, and in
turn are held within an A1203 tube. The source boat is held in the closed end and
the sample boat in the open end. The open end is then wrapped tightly with
several layers of thin gold foil.
The equilibrium constant
K(T)
for reaction (1) is expressed by
K(T) = p(T120)22p(O2)(x-1)/a(T120x) 2.
(2)
The activity of T120 x in the denominator of Eq. (2) is unity if the condensed
thallium oxide exists as a pure phase. With source temperature and p(O2) fixed,
p(T120 ) may be determined from the equilibrium constant
K(T).
D
Representative Phase Diagrams
In the two volumes of
Phase Diagrams for High-T c Superconductors
(Whittler
and Roth, 1991; Vanderah
et al.,
1991), a total of 542 diagrams have been
collected and edited. As superconductor research is a highly active field, many
systems have been investigated extensively in various laboratories. Inevitably,
there are repetitions and inconsistencies. The following is a group of selected
diagrams that represent either the major industrial activities of high-T c systems
today, or systems that have attracted considerable attention. This compilation
emphasizes the BYC, BRC, and the BSCCO systems that contain the actual high-
temperature superconductors, and not the subsystems or systems containing only
related phases.
a. Ba-Y-Cu-O Systems
Extensive international research efforts since 1987 have led to the accumulation
of a large body of information concerning the crystal chemistry and phase
equilibria of the BYC system; this is particularly true for the subsolidus
relationships, as they are essential for the preparation of the high-T c compound
Ba2YCu306+ x in single-phase, crystalline form. Phase diagrams of this high-T c
system vary significantly depending on the annealing atmosphere (and the
presence of CO2).
D. Representative Phase Diagrams 63S
1. Prepared in Air
Roth
et al.,
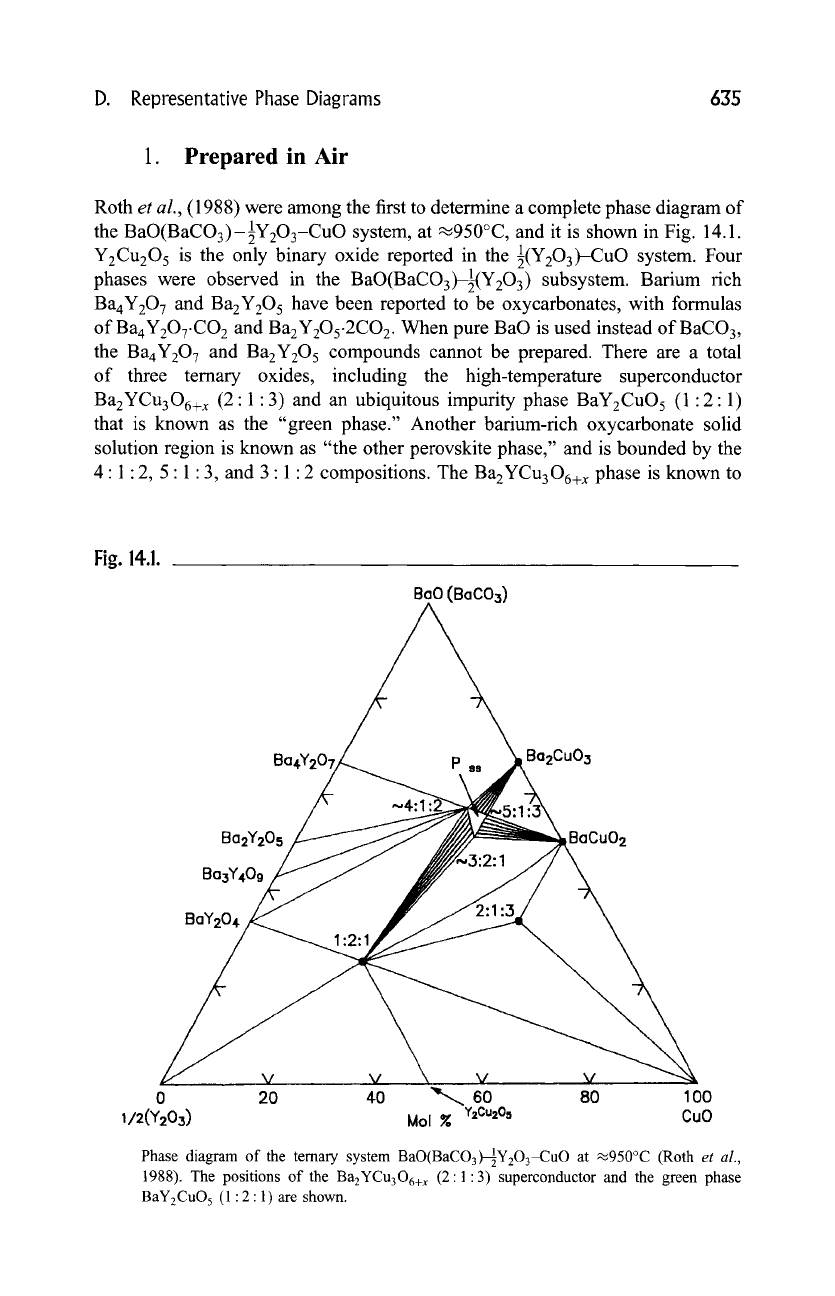
(1988) were among the first to determine a complete phase diagram of
the BaO(BaCO3)-IY203-CuO system, at ~950~ and it is shown in Fig. 14.1.
YzCu205 is the only binary oxide reported in the I(yzO3)---CuO system. Four
phases were observed in the BaO(BaCO3)--~(Y203) subsystem. Barium rich
Ba4Y207 and Ba2Y205 have been reported to be oxycarbonates, with formulas
of Ba4Y207.CO2 and BazY2Os.2CO2. When pure BaO is used instead of BaCO3,
the Ba4Y207 and BazY205 compounds cannot be prepared. There are a total
of three ternary oxides, including the high-temperature superconductor
BazYCu306+ x (2:1:3) and an ubiquitous impurity phase BaYzCuO 5 (1:2:1)
that is known as the "green phase." Another barium-rich oxycarbonate solid
solution region is known as "the other perovskite phase," and is bounded by the
4:1:2, 5:1:3, and 3 : 1:2 compositions. The Ba2YCu306+ x phase is known to
Fig. 14.1.
BaO (BaC03)
Ba4Y207~..~ P .. ~t Ba2Cu03
Ba2Y205
Ba3Y40g /
BAY204
,,,4:1
,3:2:1
BGCu02
l -/ v v \ v ,v
0 20 40 "-,... 60 80 100
1/2(Y203) Mol ~ Y2Cu20s CuO
Phase diagram of the temary system BaO(BaCO3)-~zY203-CuO at ~950~ (Roth
et al.,
1988). The positions of the
BazYCu306+ x (2"
1"3) superconductor and the green phase
BaY2CuO 5 (1" 2"1) are shown.