Poole Ch.P., Jr. Handbook of Superconductivity
Подождите немного. Документ загружается.

636 Chapter 14: Phase Diagrams
exhibit an orthothomic-tetragonal phase transition depending on the oxygen
content (Wong-Ng
et al.,
1988; Jorgenson
et al.,
1987).
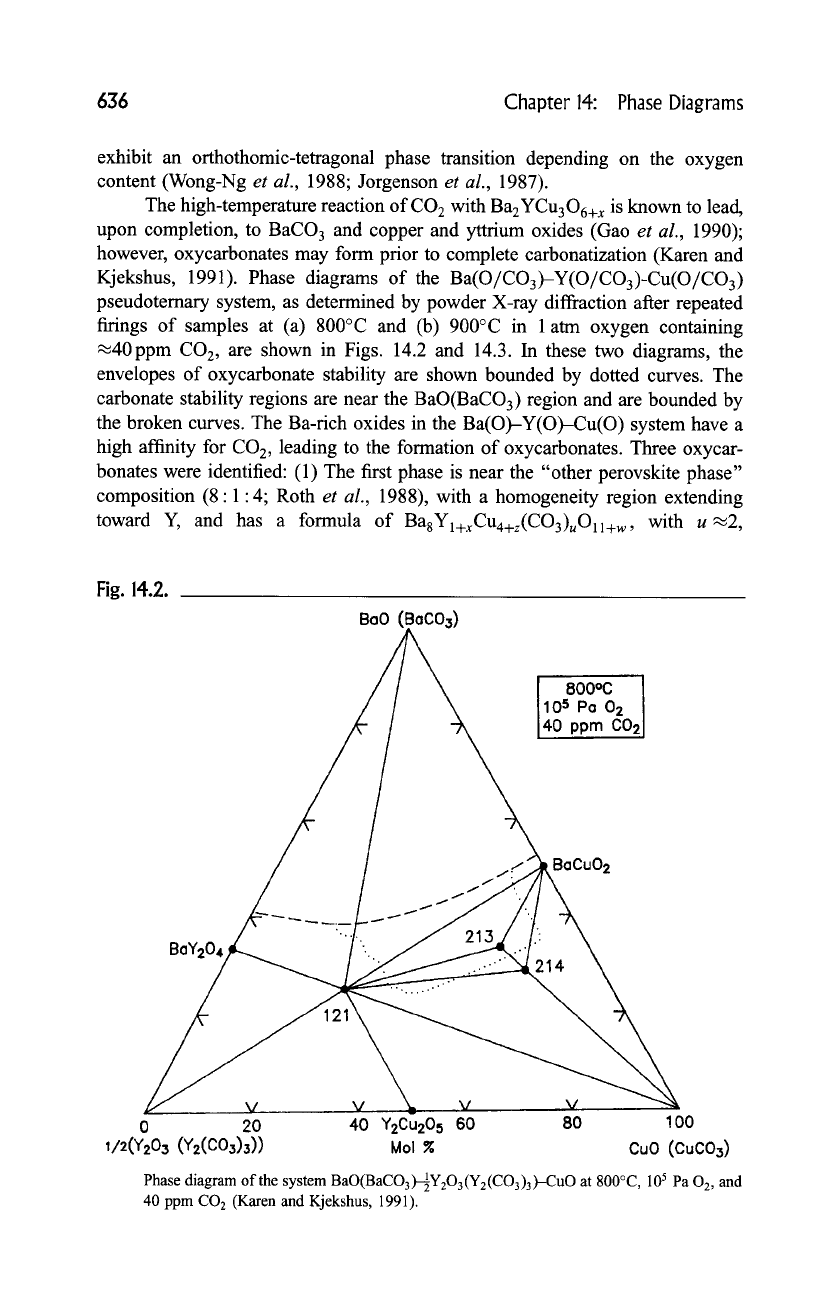
The high-temperature reaction of CO 2 with Ba2YCu306+ x is known to lead,
upon completion, to BaCO 3 and copper and yttrium oxides (Gao
et al.,
1990);
however, oxycarbonates may form prior to complete carbonatization (Karen and
Kjekshus, 1991). Phase diagrams of the Ba(O/CO3)-Y(O/CO3)-Cu(O/CO3)
pseudoternary system, as determined by powder X-ray diffraction after repeated
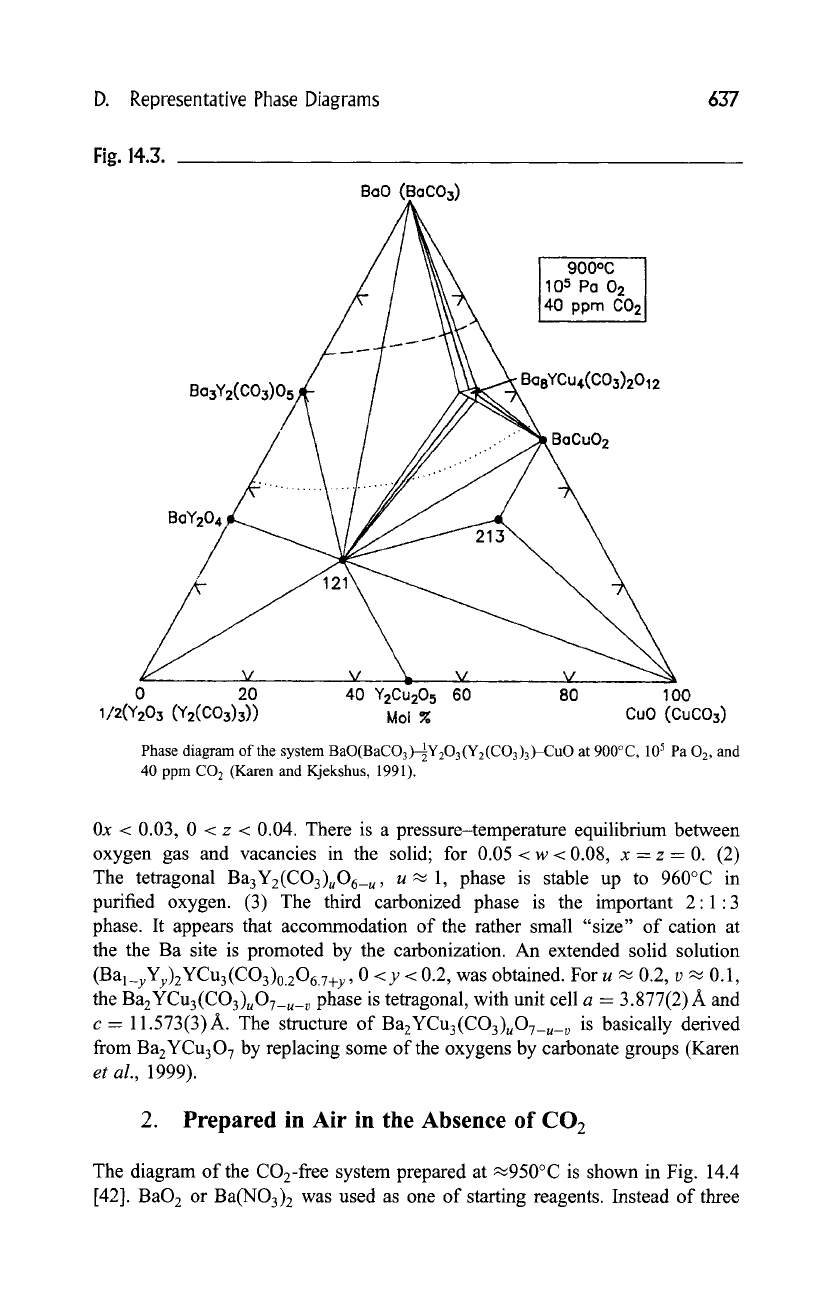
firings of samples at (a) 800~ and (b) 900~ in 1 atm oxygen containing
.~40ppm CO2, are shown in Figs. 14.2 and 14.3. In these two diagrams, the
envelopes of oxycarbonate stability are shown bounded by dotted curves. The
carbonate stability regions are near the BaO(BaCO3) region and are bounded by
the broken curves. The Ba-rich oxides in the Ba(O)-Y(O)-Cu(O) system have a
high affinity for CO 2, leading to the formation of oxycarbonates. Three oxycar-
bonates were identified: (1) The first phase is near the "other perovskite phase"
composition (8:1:4; Roth
et al.,
1988), with a homogeneity region extending
toward Y, and has a formula of
BagYl+xCu4+z(CO3),O11+w ,
with u~2,
Fig. 14.2.
BoO (EIoCOz)
80ooc
105 Po
02
40 ppm
C02
BAY204
-....-
f
f
/. ".,JR.
BaCu02
///" V. .... V ~, _V _ V ~'~
0 20 '40 Y2Cu205 60 80 100
1/2(Y203 (Y2(C03)3)) Mol ~ CuO (CuC03)
Phase diagram of the system
BaO(BaCO3)-~Y203(Y2(CO3)3)-CuO at 800~
105 Pa
02,
and
40 ppm CO2 (Karen and Kjekshus, 1991).
D. Representative Phase Diagrams
637
Fig. 14.3.
BaO (I
900~
105
P a
02
40 ppm C02
Bo3Y2(CO~)05
BasYCu4(C03)2012
BAY204
~__ .. V . V ~, V _V
0 20 40 V2c 205 60 80 .... -1-00
1/2(Y203 (Y2(C03)3)) Moi % CuO (CuC03)
Phase diagram of the system BaO(BaCO3)-~21Y203(Y2(CO3)3)-CuO at 900~ 105 Pa
02,
and
40 ppm CO 2 (Karen and Kjekshus, 1991).
0x < 0.03, 0 < z < 0.04. There is a pressure-temperature equilibrium between
oxygen gas and vacancies in the solid; for 0.05 < w < 0.08, x- z = 0. (2)
The tetragonal Ba3Yz(CO3)uO6_u, u~ 1, phase is stable up to 960~ in
purified oxygen. (3) The third carbonized phase is the important 2:1:3
phase. It appears that accommodation of the rather small "size" of cation at
the the Ba site is promoted by the carbonization. An extended solid solution
(Bal_yYy)zYCu3(CO3)0.zO6.y+y , 0 <y < 0.2, was obtained. For u -~ 0.2, v ~ 0.1,
the
BazYCu3(CO3)uO7_u_ v
phase is tetragonal, with unit cell a - 3.877(2) A and
c = 11.573(3)A. The structure of BazYCu3(CO3)uO7_u_ v is basically derived
from BazYCu307 by replacing some of the oxygens by carbonate groups (Karen
et al.,
1999).
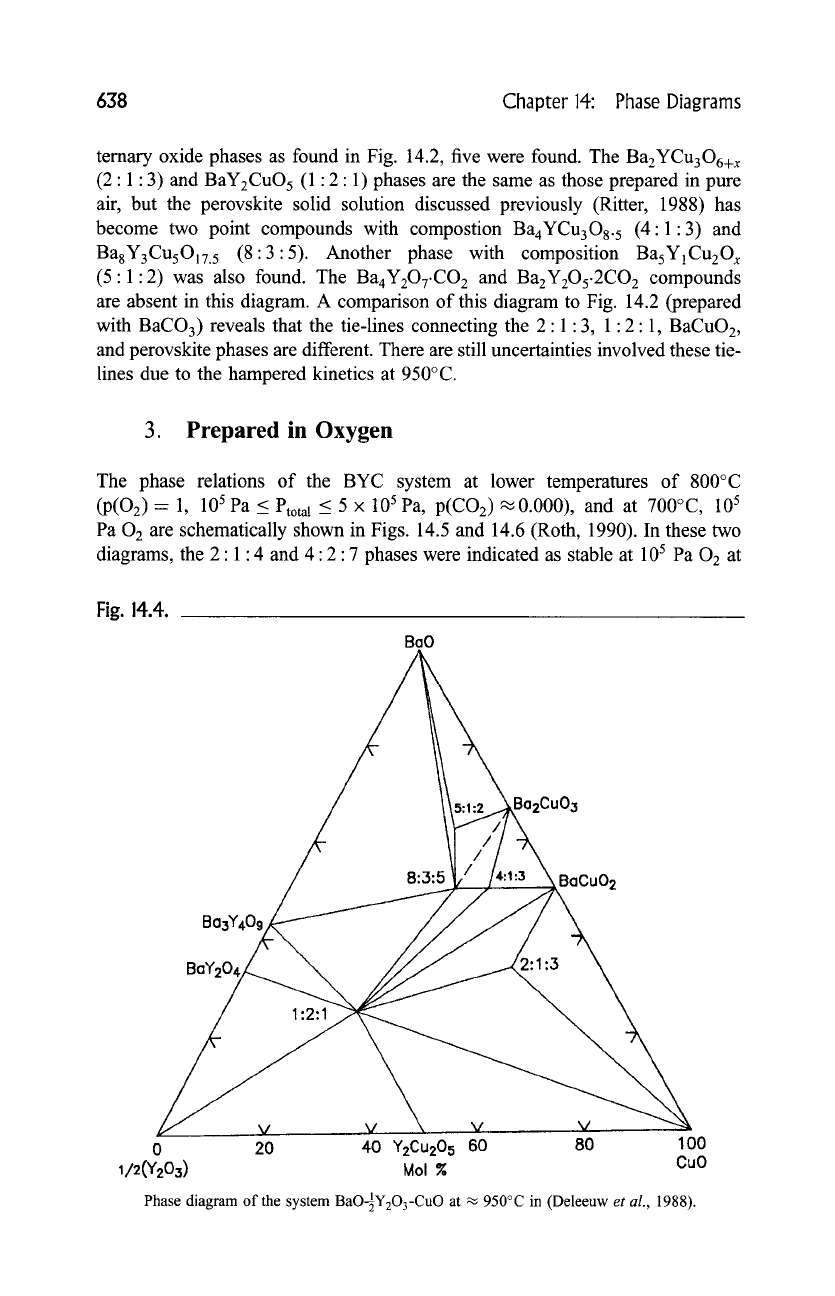
2. Prepared in Air in the Absence of CO 2
The diagram of the CO2-free system prepared at ~950~ is shown in Fig. 14.4
[42]. BaO 2 or Ba(NO3) 2 was used as one of starting reagents. Instead of three
638 Chapter 14: Phase Diagrams
temary oxide phases as found in Fig. 14.2, five were found. The Ba2YCu306+ x
(2:1:3) and BaY2CuO 5 (1:2:1) phases are the same as those prepared in pure
air, but the perovskite solid solution discussed previously (Ritter, 1988) has
become two point compounds with compostion Ba4YCu308. 5 (4:1:3) and
Ba8Y3CusO17.5 (8:3:5). Another phase with composition BasY1Cu20 x
(5:1:2) was also found. The Ba4Y207.CO 2 and Ba2Y2Os.2CO2 compounds
are absent in this diagram. A comparison of this diagram to Fig. 14.2 (prepared
with BaCO3) reveals that the tie-lines connecting the 2:1:3, 1:2:1, BaCuO2,
and perovskite phases are different. There are still uncertainties involved these tie-
lines due to the hampered kinetics at 950~
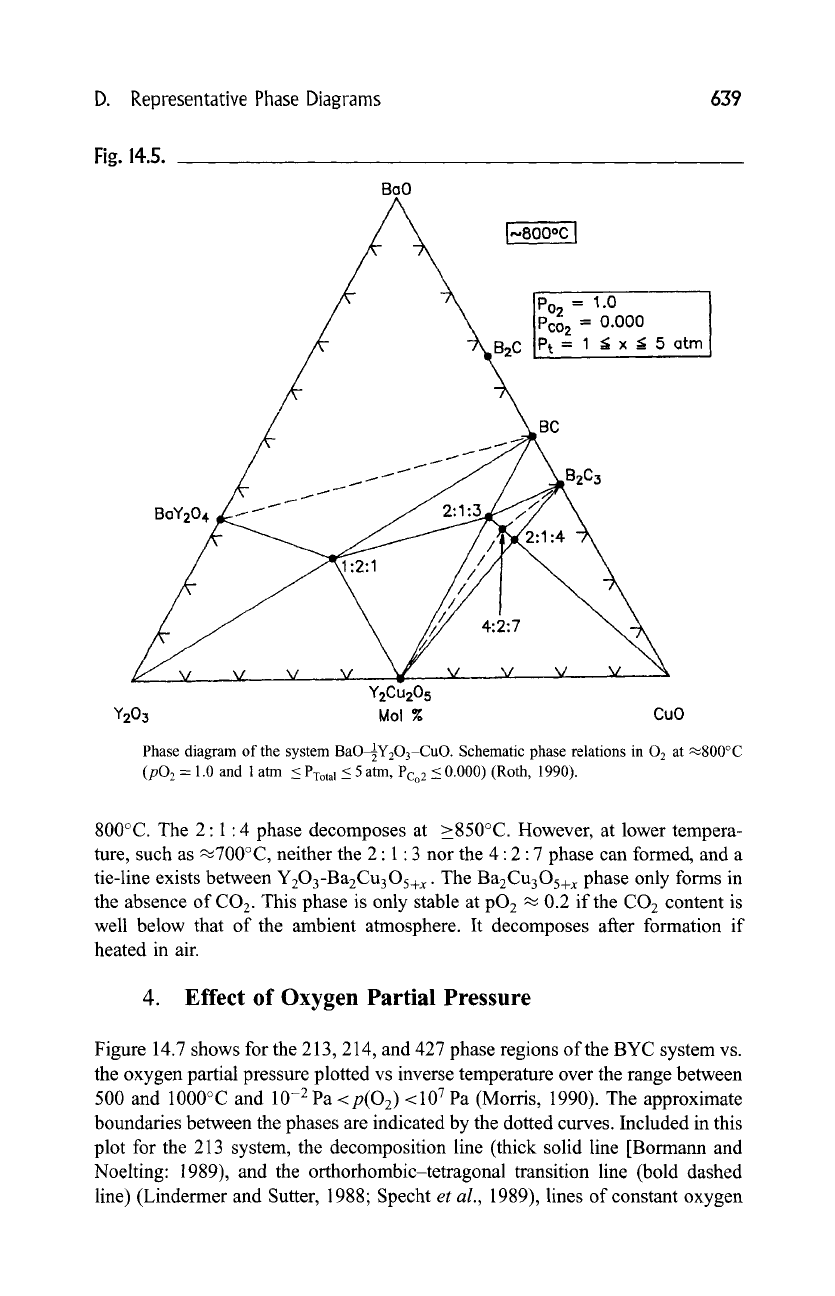
3. Prepared in Oxygen
The phase relations of the BYC system at lower temperatures of 800~
(P(O2)- 1, 105 Pa
< Ptotal -< 5 • 105
Pa, p(CO2)~ 0.000), and at 700~ 105
Pa 02 are schematically shown in Figs. 14.5 and 14.6 (Roth, 1990). In these two
diagrams, the 2" 1 9 4 and 4" 2" 7 phases were indicated as stable at 105 Pa 02 at
Fig. 14.4.
BaO
Cu03
Ba3Y409
8:3:5~ BaCuO 2
1"2:1
I V V X ~ V 9 I
0 20 40
Y2Cu205
60 80 100
1/2(Y203) Mol ~ CuO
Phase diagram of the system
BaO-~Y203-CuO at
~ 950~ in (Deleeuw
et al.,
1988).
D. Representative Phase Diagrams 639
Fig. 14.5.
BoO
IPo~_ =
~.0 .........
I
iPco~ = o.ooo
B2C IPt = I ~, .,x __,..5 at m
Be
BAY204
11
t I
i
IfI '''~ I I I
B2C3
:2:1
Y2o3
9
/ 4:2:7
,/
v v v .... v., v ,~__v, ,v
-
Y2Cu205
Mol
%
CuO
Phase diagram of the system BaO~Y203-CuO. Schematic phase relations in
0 2 at
~800~
(pO 2 = 1.0 and 1 atm < PYotal --< 5 atm, Pco2 -< 0.000) (Roth, 1990).
800~ The 2" 1" 4 phase decomposes at >850~ However, at lower tempera-
ture, such as ~700~ neither the 2" 1 9 3 nor the 4"2" 7 phase can formed, and a
tie-line exists between Y203-Ba2Cu3Os+x. The Ba2Cu3Os+x phase only forms in
the absence of CO2. This phase is only stable at pO 2 ~ 0.2 if the CO 2 content is
well below that of the ambient atmosphere. It decomposes after formation if
heated in air.
4. Effect of Oxygen Partial Pressure
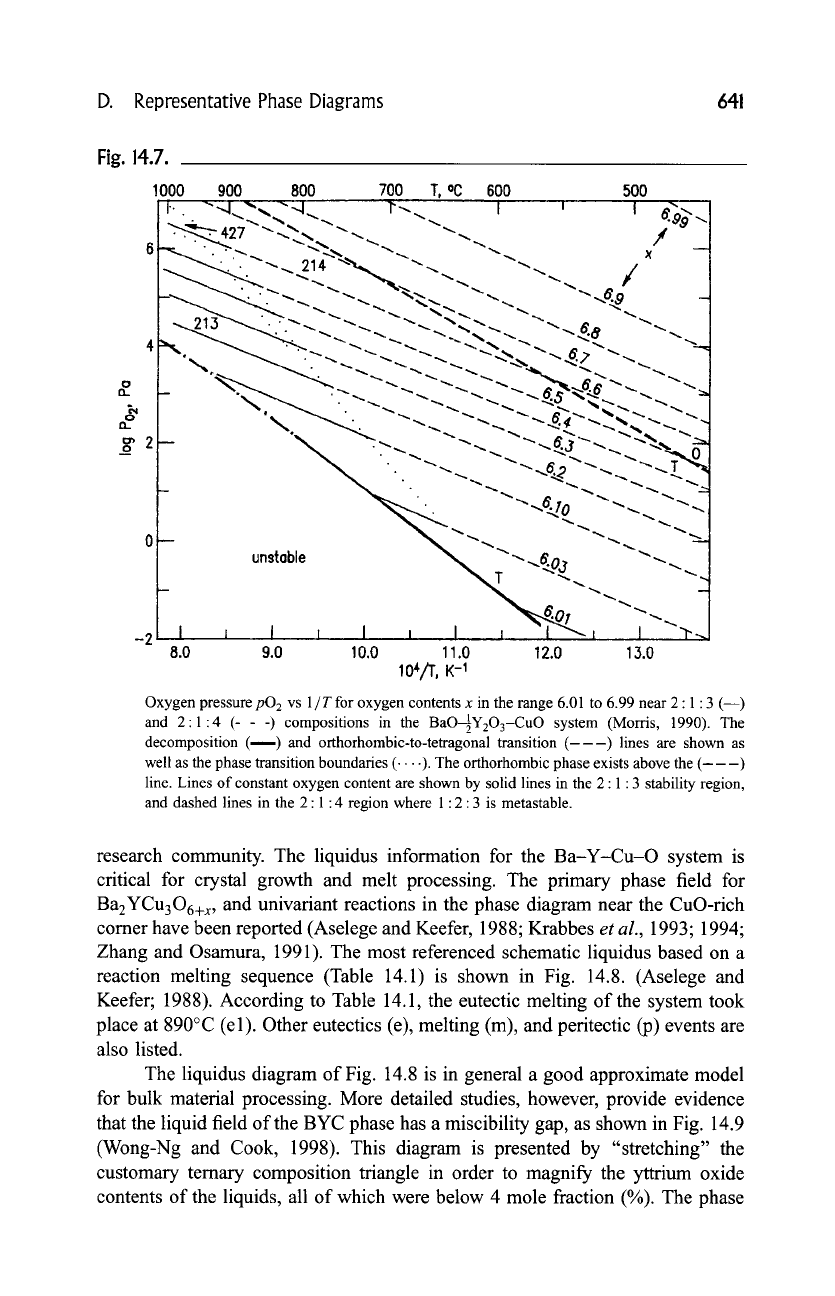
Figure 14.7 shows for the 213, 214, and 427 phase regions of the BYC system vs.
the oxygen partial pressure plotted vs inverse temperature over the range between
500 and 1000~ and 10 -2 Pa <p(O2) <107 Pa (Morris, 1990). The approximate
boundaries between the phases are indicated by the dotted curves. Included in this
plot for the 213 system, the decomposition line (thick solid line [Bormann and
Noelting: 1989), and the orthorhombic-tetragonal transition line (bold dashed
line) (Lindermer and Sutter, 1988; Specht
et al.,
1989), lines of constant oxygen
640
Chapter 14: Phase
Diagrams
Fig. 14.6.
BaO
i,-,7o0' I
Y203
BAY204
f
J
f
f
J
J
J
J
J
J
i
f
/ Ba~
f"
- j
..-
f ._..._.._..._- --- ---" --" --"
......
No 2:1:3
----~
f
f
J
i
11 t
t
I
v v v V V, v
Mol ~,
Po2 = 0.2 ~ x _~ 1.0
Pco2 - 0.000
Pt = 1.0
Ba2Cu30x
"4
..=(,2:1
\
\\
v v V
\\\
OuO
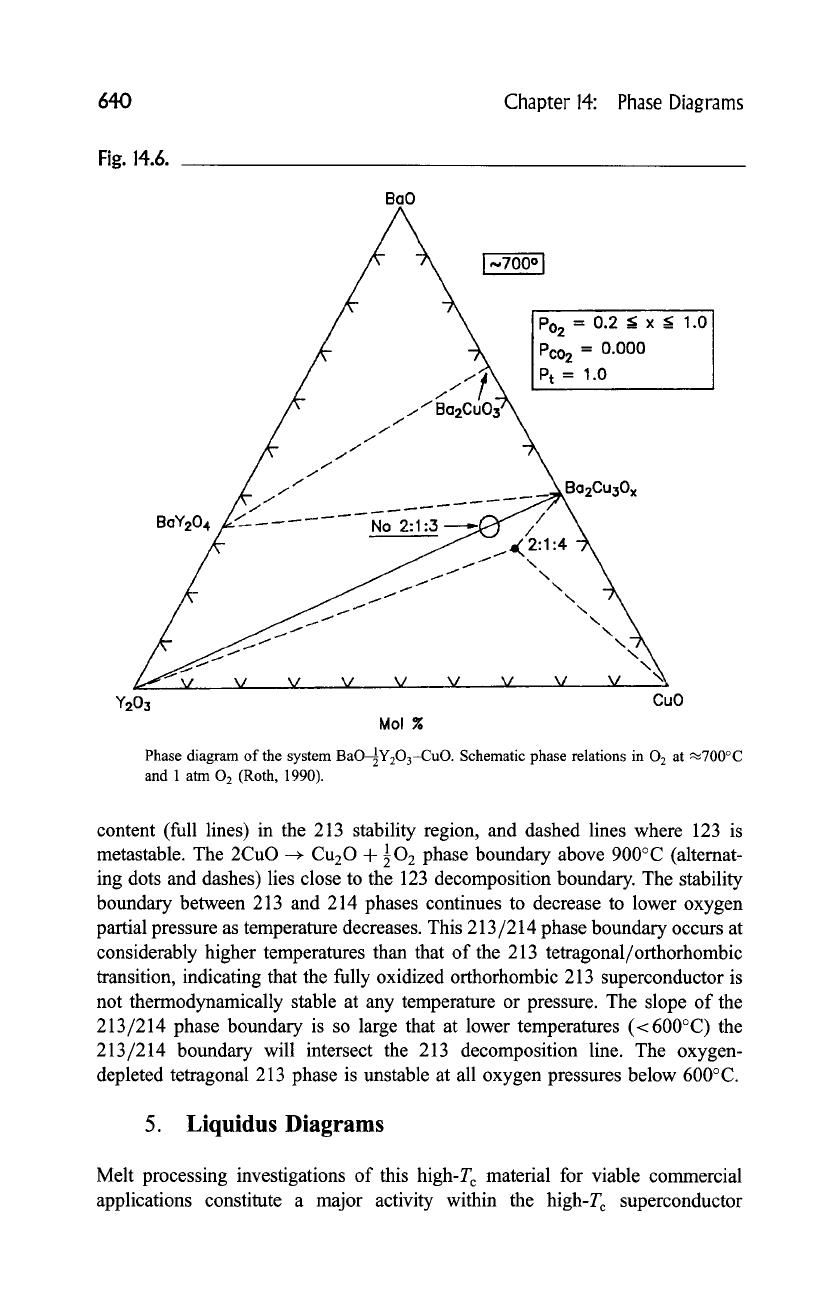
Phase diagram of the system BaO1Y203-CuO. Schematic phase relations in
0 2
at ~700~
and 1 atm O 2 (Roth, 1990).
content (full lines) in the 213 stability region, and dashed lines where 123 is
metastable. The 2CuO ~ Cu20 + 102 phase boundary above 900~ (alternat-
ing dots and dashes) lies close to the 123 decomposition boundary. The stability
boundary between 213 and 214 phases continues to decrease to lower oxygen
partial pressure as temperature decreases. This 213/214 phase boundary occurs at
considerably higher temperatures than that of the 213 tetragonal/orthorhombic
transition, indicating that the fully oxidized orthorhombic 213 superconductor is
not thermodynamically stable at any temperature or pressure. The slope of the
213/214 phase boundary is so large that at lower temperatures (<600~ the
213/214 boundary will intersect the 213 decomposition line. The oxygen-
depleted tetragonal 213 phase is unstable at all oxygen pressures below 600~
5. Liquidus Diagrams
Melt processing investigations of this high-T c material for viable commercial
applications constitute a major activity within the high-T c superconductor
D. Representative
Phase Diagrams
641
Fig. 14.7.
1000 900 800 700 T, ~ 600 500
i:.. "q..'-.. -'q~ r<.. I
,
.... I ~>
_
".~ ~ ~ ~, ~. z
6 ~
"...-,,, ~'~_ "~-~ "~,
x
-.~ "'-L. " "-. 214 ""~ ~'-~ ~'... /
-~ ---...~..-..
~.. "~.-~_ -~..
"-..%~
_
"-.4 '0 ~ ."
"-_ "~_
"-- ~ ~"'~ "~ 6=
"--
9
9 ~. ~.. i,-. -,~ ~ .Q
4 -'~ ~ '~--. _ "-._ "-_ "-.~__ ~'--. .~ "-..
9 , ,~ ~ ~. o/ "~
~_ ~ " .~
~ .~. ".4~_ ~-... -~
,
9 ~ -~ ~ ~. .,~
13-- -- -'~_ ~ 9 .~ "~ "--_ -~. O.R '~'~_ "~_ -~
o ~
"'--L.
"~ "~
"~"~'~ "~'~'~ "~. "4
c~ 2~
". "~ "-.~ "-~ "~--7 ~!
~. "~ ~.~ ~,. --,,
unstable ~
"~.~6_,.,. "~--.
~"
T
~ud "-...
-2 I i I 9 I ....... , I ~ .I ..... J ...... ,-.-~
8.0 9.0 10.0 11.0 12.0 13.0
104/T, K-1
Oxygen pressure
pO 2 vs
1 / T for oxygen contents x in the range 6.01 to 6.99 near 2 : 1 : 3 (--)
and 2:1:4 (- - -) compositions in the BaO--~21YzO3-CuO system (Morris, 1990). The
decomposition (----) and orthorhombic-to-tetragonal transition (---) lines are shown as
well as the phase transition boundaries ( .... ). The orthorhombic phase exists above the (---)
line. Lines of constant oxygen content are shown by solid lines in the 2 : 1:3 stability region,
and dashed lines in the 2:1:4 region where 1:2:3 is metastable.
research community. The liquidus information for the Ba-Y-Cu-O system is
critical for crystal growth and melt processing. The primary phase field for
Ba2YCu306+x, and univariant reactions in the phase diagram near the CuO-rich
comer have been reported (Aselege and Keefer, 1988; Krabbes
et al.,
1993; 1994;
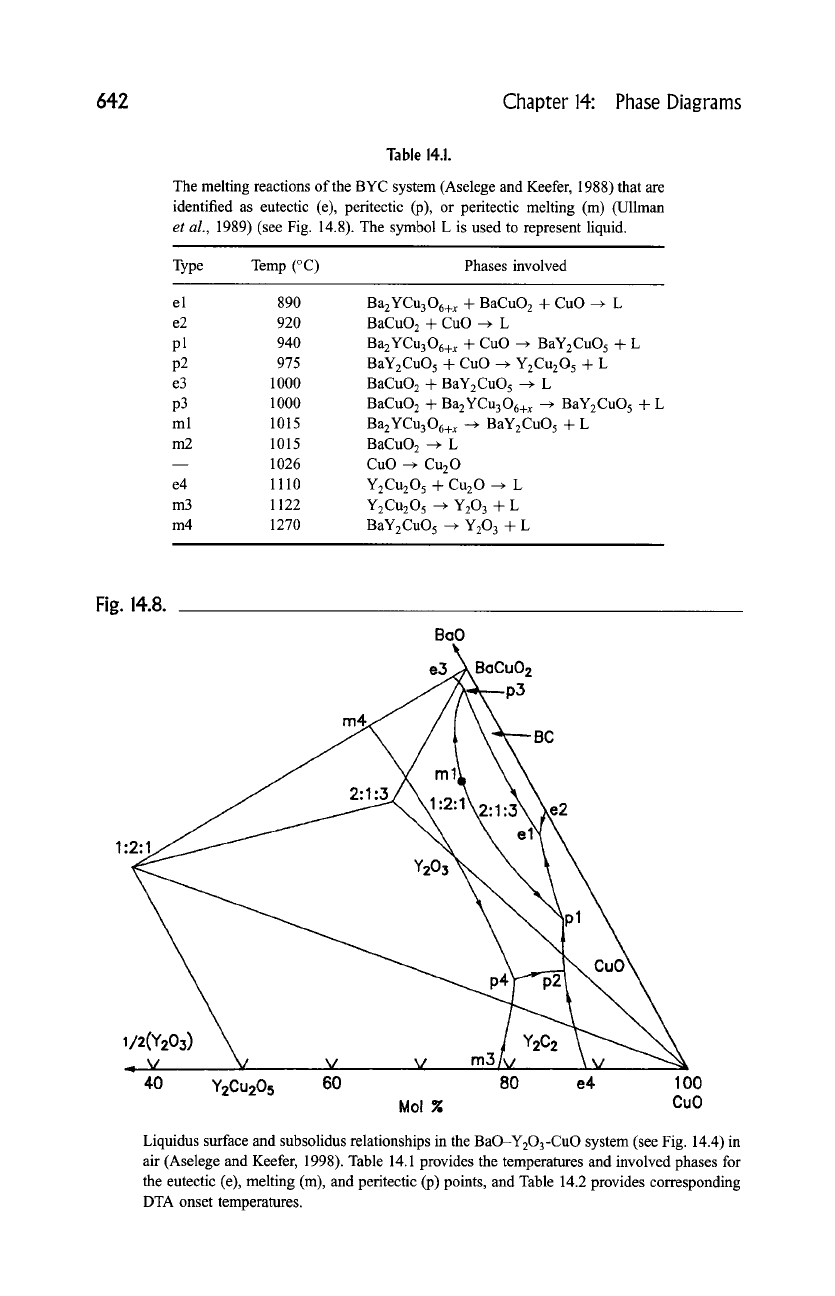
Zhang and Osamura, 1991). The most referenced schematic liquidus based on a
reaction melting sequence (Table 14.1) is shown in Fig. 14.8. (Aselege and
Keefer; 1988). According to Table 14.1, the eutectic melting of the system took
place at 890~ (el). Other eutectics (e), melting (m), and peritectic (p) events are
also listed.
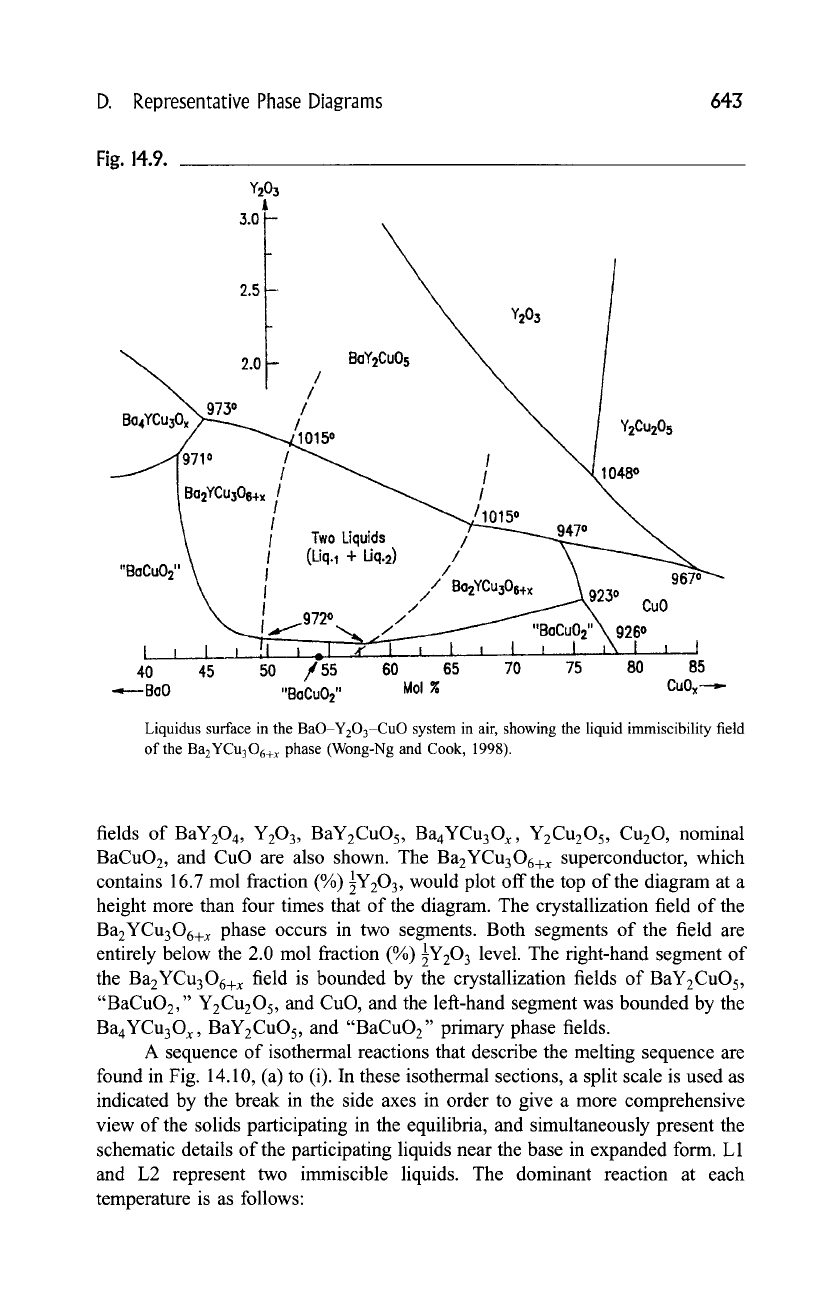
The liquidus diagram of Fig. 14.8 is in general a good approximate model
for bulk material processing. More detailed studies, however, provide evidence
that the liquid field of the BYC phase has a miscibility gap, as shown in Fig. 14.9
(Wong-Ng and Cook, 1998). This diagram is presented by "stretching" the
customary temary composition triangle in order to magnify the yttrium oxide
contents of the liquids, all of which were below 4 mole fraction (%). The phase
642 Chapter 14: Phase Diagrams
Table 14.1.
The melting reactions of the BYC system (Aselege and Keefer, 1988) that are
identified as eutectic (e), peritectic (p), or peritectic melting (m) (Ullman
et al.,
1989) (see Fig. 14.8). The symbol L is used to represent liquid.
Type Temp (~ Phases involved
el 890
e2 920
pl 940
p2 975
e3 1000
p3 1000
ml 1015
m2 1015
1026
e4 1110
m3 1122
m4 1270
Ba2YCu306+ x -t- BaCuO 2 + CuO --+ L
BaCuO 2 + CuO --+ L
Ba2YCu306+ x + CuO -+ BaY2CuO 5 + L
BaY2CuO 5 + CuO --+ Y2Cu205 + L
BaCuO 2 + BaY2CuO 5 --+ L
BaCuO 2 + Ba2YCu306+ x ~ BaY2CuO 5 + L
Ba2YCu306+ x ~ BaY2CuO 5 + L
BaCuO2 ~ L
CuO ~ Cu20
YzCu205 + Cu20 --+ L
YzCu205 --+ Y203 -k- L
BaY2CuO 5 --+ Y203 -k- L
Fig. 14.8.
BoO
e3~BoCuO2
p3
1:2:1
~/2(Y2O3)
..... .V __
40 Y2Cu205 60 80 e4 1 O0
Mol ~
CuO
Liquidus surface and subsolidus relationships in the BaO-Y203-CuO system (see Fig. 14.4) in
air (Aselege and Keefer, 1998). Table 14.1 provides the temperatures and involved phases for
the eutectic (e), melting (m), and peritectic (p) points, and Table 14.2 provides corresponding
DTA onset temperatures.
D.
Representative Phase Diagrams
643
Fig. 14.9.
Bo4u
"BoCu02"
Y203
A
3.0-
2.5-
2.0-
973 o
I
I
I
I
!1015 o
BaY2Cu05
Y2O3
Y2Cu205
)710 / ~ I
~/
/ ~ I N,~1048 o
Bo2YCu,O,+x / / ~ / ~x
I ~ 947 o
I Two Liquids / "~
! (Liq.l + Uq.2) / ~~
I / Bo2YCu
! / ~J23O
/
I
/
"BoCuO
I.~1972~ ./ ~ r q?R
967 o
CuO
40
-~---BoO
45 50
/#-55 60 65
70 75
80 85
"BaCu02" Mol ~ CuOx---,.-
Liquidus surface in the BaO-Y203-CuO system in air, showing the liquid immiscibility field
of the Ba2YCu306+ x phase (Wong-Ng and Cook, 1998).
fields of BaY204, Y203, BaY2CuOs, Ba4YCu3Ox, Y2Cu2Os,
Cu20 ,
nominal
BaCuO2, and CuO are also shown. The Ba2YCu306+ x superconductor, which
contains 16.7 mol fraction (%) 89 would plot off the top of the diagram at a
height more than four times that of the diagram. The crystallization field of the
Ba2YCu306+ x phase occurs in two segments. Both segments of the field are
entirely below the 2.0 mol fraction (%)
1Y203 level.
The fight-hand segment of
the Ba2YCu306+ x field is bounded by the crystallization fields of BaY2CuOs,
"BaCuO2," Y2Cu205, and CuO, and the left-hand segment was bounded by the
Ba4YCu3Ox, BaY2CuOs, and "BaCuO2" primary phase fields.
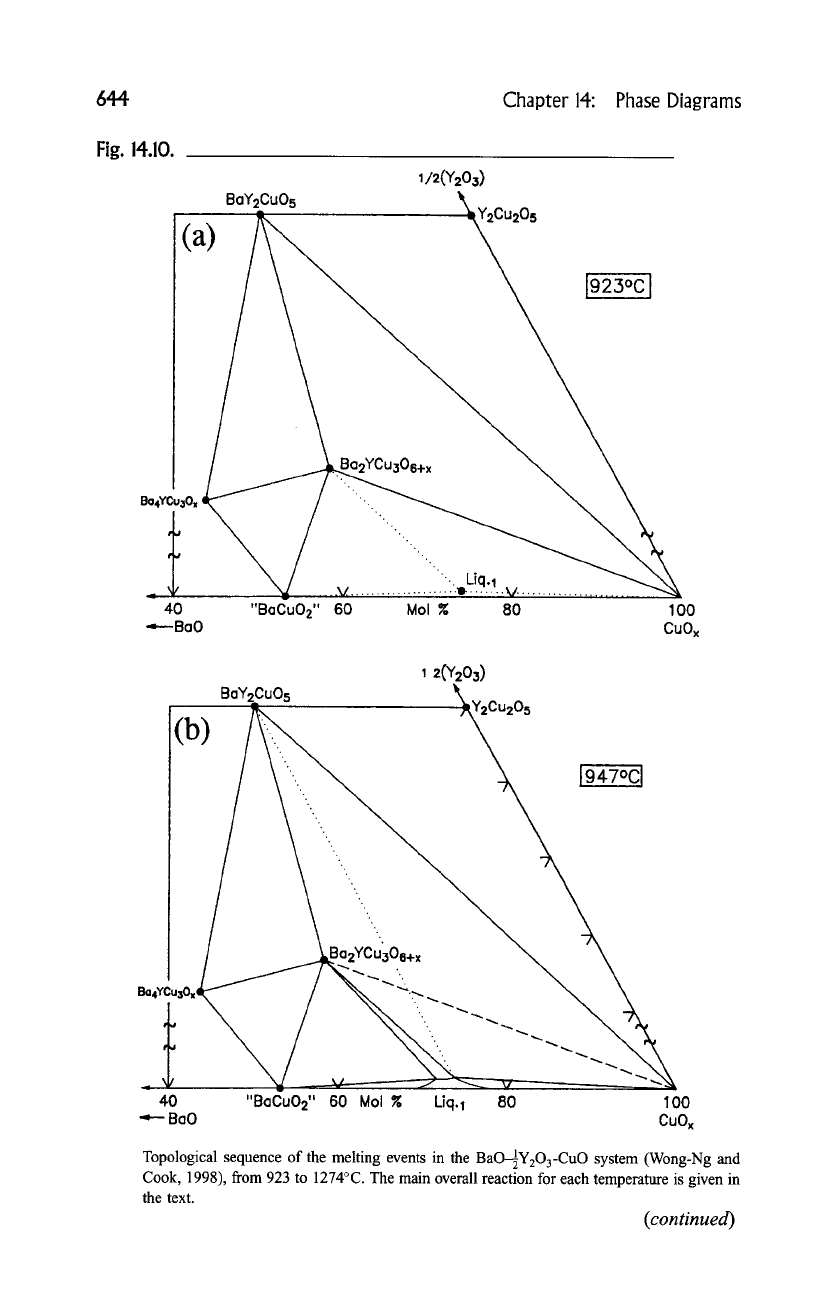
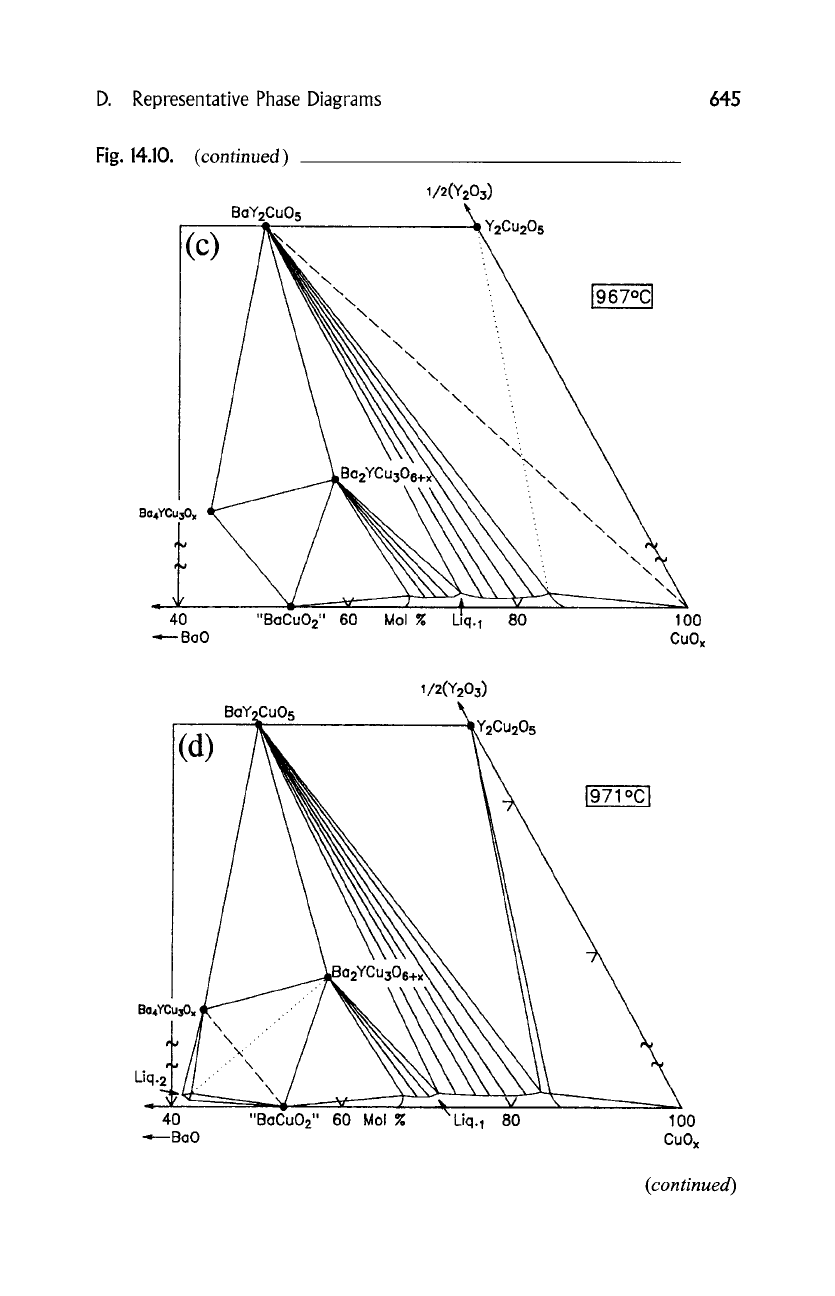
A sequence of isothermal reactions that describe the melting sequence are
found in Fig. 14.10, (a) to (i). In these isothermal sections, a split scale is used as
indicated by the break in the side axes in order to give a more comprehensive
view of the solids participating in the equilibria, and simultaneously present the
schematic details of the participating liquids near the base in expanded form. L1
and L2 represent two immiscible liquids. The dominant reaction at each
temperature is as follows:
644 Chapter 14:
Phase
Diagrams
Fig. 14.10.
1/2(Y203)
BaY2CuO 5 ~,, ^
-'~Y2uu205
(a)
eo4VCu;=O=
ill
..
I .... .v. .................. ;:...L.!q;.~.. v.
~40 "Ba(~u02" 60 Mol % 80 100
9 -~---BaO CuOx
~ 2(u
30,
40 "BaCTu02'; 6"0
uoi %
Liq., 80 100
BaO CuOx
Topological sequence of the melting events in the BaO--~2]Y203-CuO system (Wong-Ng and
Cook, 1998), from 923 to 1274~ The main overall reaction for each temperature is given in
the text.
(continued)
D. Representative Phase Diagrams 645
Fig. 14.10.
(continued)
~/2(Y2O3)
BaY2Cu05 ~. Y2Cu205
67oci
[(c)
\\
\\\\
BazYCu306+ •
B x
40 "BaC'u02" 60 Mol ~.
Llq.1 80 100
9 ~-'- BaO CuOx
~/2(Y2O3)
(d ~
~o~o~
40 "BaCu02" 60 Mol g \Liq.1 80 100
-~--BaO CuOx
(continued)