Townsend C.R., Begon M., Harper J.L. Essentials of Ecology
Подождите немного. Документ загружается.

Germany) were disturbed at intervals of 2–12 days by disrupting the normal
stratification in the water column with bubbles of compressed air. Again, both
species richness and Shannon’s diversity index were highest at intermediate
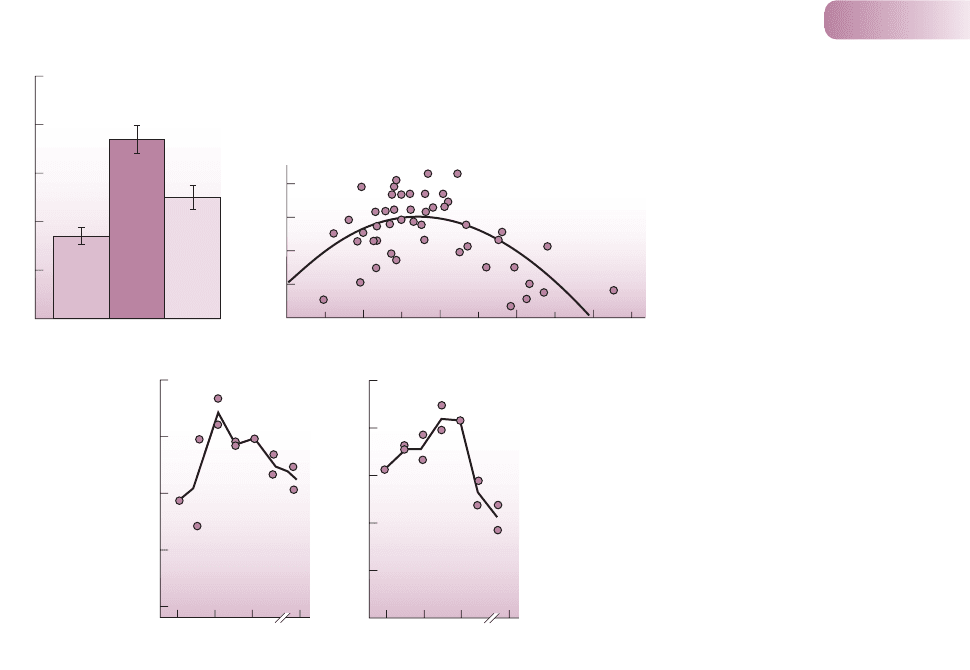
frequencies of disturbance (Figure 10.11c).
10.4.3 Environmental age: evolutionary time
It has also often been suggested that communities that are ‘disturbed’ only on very
extended time scales may nonetheless lack species because they have yet to reach
an ecological or an evolutionary equilibrium. Thus communities may differ in
species richness because some are closer to equilibrium and are therefore more
saturated than others (see Figure10.3d).
For example, many have argued that the tropics are richer in species than
temperate regions at least in part because the tropics have existed over long and
uninterrupted periods of evolutionary time, whereas the temperate regions are
still recovering from the Pleistocene glaciations when temperate biotic zones
shifted in the direction of the tropics. It now seems, however, that tropical areas
were also disturbed during the ice ages, not directly by ice but by associated
climatic changes that saw tropical forest contracting to a limited number of small
refuges surrounded by grassland. Thus, although it seems likely that some com-
munities, by virtue of disturbances in their distant past, are less saturated than
others, we cannot pinpoint these communities with confidence.
Chapter 10 Patterns in species richness
339
Disturbance interval (days)
Frequency of disturbance Intensity of disturbance (mean percentage of bed moved)
Species richness
Species richness
(a)
(b)
(c)
Mean species richness
5
4
3
2
1
0
F R 0 20406080I
30
25
20
15
10
2 6 10 und. 2 6 10 und.
3.0
2.5
2.0
1.0
1.5
Diversity index
60
50
40
30
20
10
Figure 10.11
(a) Pattern in species richness
(± SE) on rocky-shore boulders in
each of three classes categorized
according to the frequency with
which they are disturbed: frequently
disturbed (F), disturbed at an
intermediate rate (I), and rarely
disturbed (R). Species richness is
highest at the intermediate level
of disturbance. (b) Relationship
between insect species richness
and the intensity of disturbance,
measured as the average percentage
of the bed that moves during
successive 2-month periods, in each
of 54 stream sites in the Taieri River,
New Zealand. Species richness is
again highest at intermediate levels
of disturbance. (c) Both species
diversity (Shannon index) and
species richness of phytoplankton
communities are highest at
intermediate frequencies of
disturbance in controlled field
experiments in Lake Plußsee in north
Germany. ‘und’ represents species
richness in the undisturbed state.
(a) AFTER SOUSA, 1979B; (b) AFTER TOWNSEND ET AL., 1997; (c) AFTER FLÖDDER & SOMMER, 1999
9781405156585_4_010.qxd 11/5/07 14:58 Page 339
An alternative explanation for lower species richness in temperate than tropical
areas invokes the idea that species evolve faster in the tropics because of higher rates
of mutation in these warmer climes. Wright et al. (2006) compared the rates of evolu-
tion of pairs of woody plant species, one each from tropical areas (e.g. Eucalyptus
deglupta, Clematis javana, Banksia dentate and 42 others) and temperate areas
(Eucalyptus coccifera, Clematis paniculata, Banksia marginata, etc., respectively).
Evolution, as assessed by the rate of nucleotide substitution in a particular region
of DNA, turns out to be more than twice as fast in the tropical species.
10.5 Gradients of species richness
Sections 10.3 and 10.4 have demonstrated how difficult explanations for varia-
tions in species richness are to formulate and test. It is easier to describe patterns,
especially gradients, in species richness. These are discussed next. Explanations
for these, too, however, are often very uncertain.
10.5.1 Habitat area and remoteness: island
biogeography
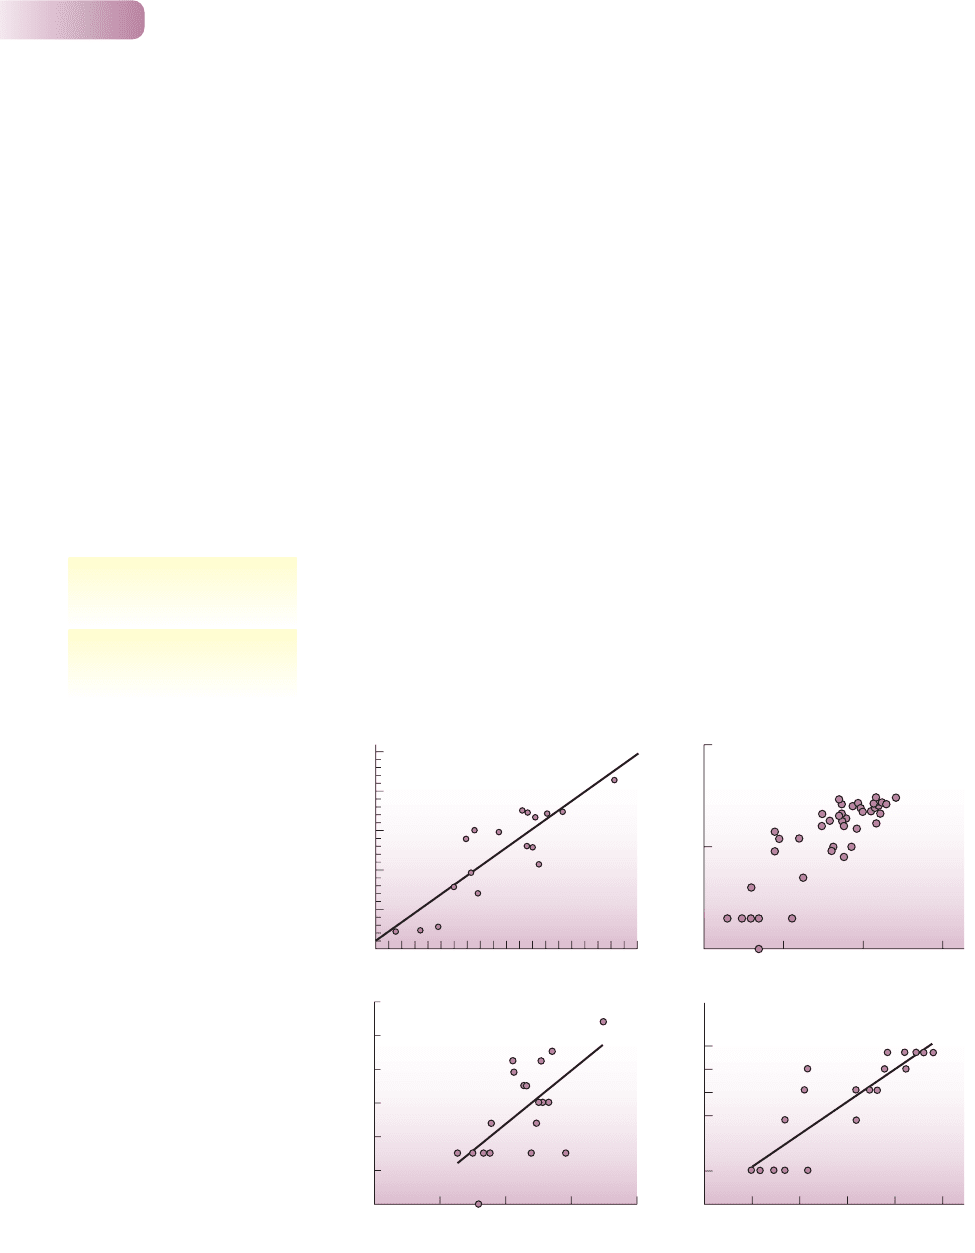
It is well established that the number of species on islands decreases as island area
decreases. Such a species–area relationship is shown in Figure 10.12a for plants
on small islands east of Stockholm, Sweden.
‘Islands’, however, need not be islands of land in a sea of water. Lakes are
islands in a ‘sea’ of land, mountaintops are high-altitude islands in a low-altitude
ocean, gaps in a forest canopy where a tree has fallen are islands in a sea of trees,
Part III Individuals, Populations, Communities and Ecosystems
340
0.5
200
Species richness
(a)
Island area (ha)
160
120
0
0
80
40
1.2
1.0
0.8
0.6
0.4
0.2
50201051 3 0.01
100
10
1
10.00.1 1.0
(b)
Species richness
34210
Log number of species
(c)
10 100 1000 10,000 100,000
5
4
3
2
1
(d)
Species richness
Lake surface area (km
2
)
Area of source pool (m
2
)Log cave area (m
2
)
Figure 10.12
Species–area relationships: in
each case the number of species
increases with ‘island’ area. (a) For
plants on small islands off the east
coast of Sweden in 1999. (b) For
birds inhabiting lakes (‘islands’ of
water in a ‘sea’ of land) in Florida.
(c) For bats inhabiting different-sized
caves in Mexico. (d) For fish living in
Australian desert springs connected
to pools of different sizes. All
regression lines are significant at
P < 0.05; no line is shown in (b)
because the regression is not
significant.
(a) AFTER LOFGREN & JERLING, 2002; (b) AFTER HOYER
& CANFIELD, 1994; (c) AFTER BRUNET & MEDELLÍN,
2001; (d) AFTER KODRIC-BROWN & BROWN, 1993
species–area relationships on
oceanic islands
habitat islands and areas of
mainland
9781405156585_4_010.qxd 11/5/07 14:58 Page 340

and there can be islands of particular geological types, soil types or vegetation types
surrounded by dissimilar types of rock, soil or vegetation. Species–area relationships
can be equally apparent for these types of islands (Figure 10.12b–d).
The relationship between species richness and habitat area is one of the most
consistent of all ecological patterns. However, the pattern raises an important
question: ‘Is the impoverishment of species on islands more than would be
expected in comparably small areas of mainland?’ In other words, does the char-
acteristic isolation of islands contribute to their impoverishment of species? These
are important questions for an understanding of community structure since there
are many oceanic islands, many lakes, many mountaintops, many woodlands
surrounded by fields, many isolated trees and so on.
Probably the most obvious reason why larger areas should contain more species
is that larger areas typically encompass more different types of habitat. However,
MacArthur and Wilson (1967) believed this explanation to be too simple. In their
equilibrium theory of island biogeography they argued that island size and isola-
tion themselves played important roles: that the number of species on an island
is determined by a balance between immigration and extinction; that this balance
is dynamic, with species continually going extinct and being replaced (through
immigration) by the same or by different species; and that immigration and
extinction rates may vary with island size and isolation (Box 10.3).
Chapter 10 Patterns in species richness
341
‘island effects’ and community
structure
10.3 HISTORICAL LANDMARKS
10.3 Historical landmarks
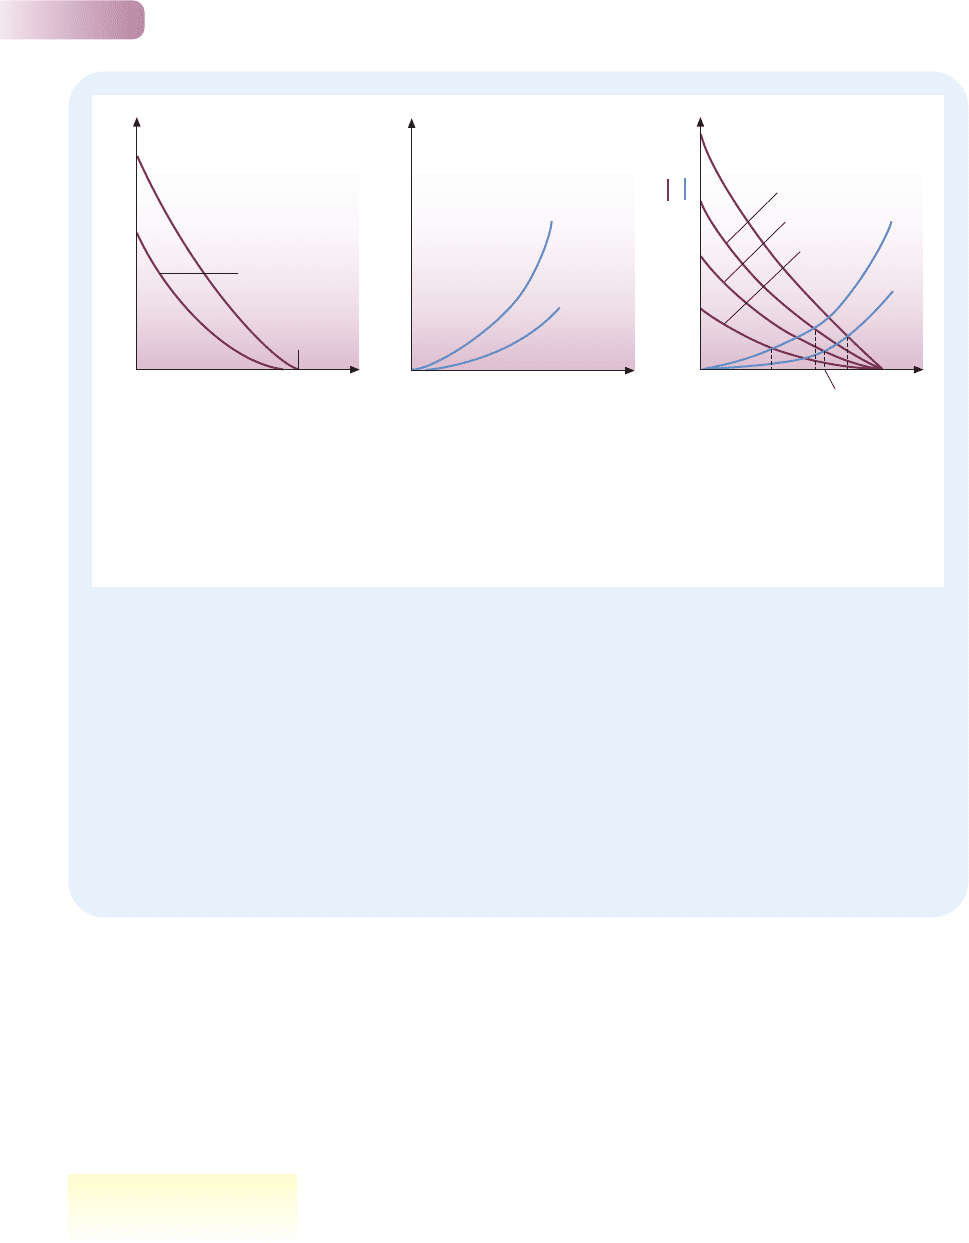
Taking immigration first, imagine an island that as
yet contains no species at all. The rate of immigra-
tion of species will be high, because any colonizing
individual represents a species new to that island.
However, as the number of resident species rises,
the rate of immigration of new, unrepresented species
diminishes. The immigration rate reaches zero when
all species from the source pool (i.e. from the main-
land or from other nearby islands) are present on the
island in question (Figure 10.13a).
The immigration graph is drawn as a curve,
because immigration rate is likely to be particularly
high when there are low numbers of residents and
many of the species with the greatest powers of dis-
persal are yet to arrive. In fact, the curve should really
be a blur rather than a single line, since the precise
curve will depend on the exact sequence in which
species arrive, and this will vary by chance. In this
sense, the immigration curve can be thought of as the
‘most probable’ curve.
The exact immigration curve will depend on the
degree of remoteness of the island from its pool of
potential colonizers (Figure 10.13a). The curve will
always reach zero at the same point (when all mem-
bers of the pool are resident), but it will generally have
higher values on islands close to the source of immi-
gration than on more remote islands, since colonizers
have a greater chance of reaching an island the closer
it is to the source. It is also likely that immigration rates
will generally be higher on a large island than on a
small island, since the larger island represents a larger
‘target’ for the colonizers (Figure 10.13a).
The rate of species extinction on an island
(Figure 10.13b) is bound to be zero when there are no
species there, and it will generally be low when there
are few species. However, as the number of resident
MacArthur and Wilson’s equilibrium theory of island biogeography
s
9781405156585_4_010.qxd 11/5/07 14:58 Page 341
MacArthur and Wilson’s theory makes several predictions:
1 The number of species on an island should eventually become roughly
constant through time.
2 This should be a result of a continual turnover of species, with some
becoming extinct and others immigrating.
3 Large islands should support more species than small islands.
4 Species number should decline with the increasing remoteness of an island.
On the other hand, a higher richness on larger islands would be expected simply
as a consequence of larger islands having more habitat types. Does richness increase
with area at a rate greater than could be accounted for by increases in habitat
Part III Individuals, Populations, Communities and Ecosystems
342
species rises, the extinction rate is assumed by the
theory to increase, probably at a more than proportion-
ate rate. This is thought to occur because with more
species, competitive exclusion becomes more likely,
and the population size of each species is on average
smaller, making it more vulnerable to chance extinc-
tion. Similar reasoning suggests that extinction rates
should be higher on small than on large islands –
population sizes will typically be smaller on small islands
(Figure 10.13b). As with immigration, the extinction
curves are best seen as ‘most probable’ curves.
In order to see the net effect of immigration and
extinction, their two curves can be superimposed
(Figure 10.13c). The number of species where the
curves cross (S*) is a dynamic equilibrium and
should be the characteristic species richness for
the island in question. Below S*, richness increases
(immigration rate exceeds extinction rate); above S*,
richness decreases (extinction exceeds immigration).
The theory, then, makes a number of predictions,
described in the text.
s
Immigration rate
(a)
Number of resident species
Extinction rate
(b)
Number of resident species
Small island
Large island
(c)
Number of resident species
Close, large
Close, small
Distant, small
Distant, large
Small
Large
Close or large island
Distant or small
island
Size of
species pool
Immigration rate ( )
or extinction rate ( )
S*
DS
S*
CS
S*
DL
S*
CL
Figure 10.13
MacArthur and Wilson’s (1967) equilibrium theory of island biogeography. (a) The rate of species immigration on to an island,
plotted against the number of resident species on the island, for large and small islands and for close and distant islands.
(b) The rate of species extinction on an island, plotted against the number of resident species on the island for large and small
islands. (c) The balance between immigration and extinction on small and large islands and on close and distant islands. In each
case, S* is the equilibrium species richness; C, close; D, distant; L, large; S, small.
partitioning variation between
habitat diversity and area itself
9781405156585_4_010.qxd 11/5/07 14:58 Page 342
diversity alone? Some studies have attempted to partition species–area variation on
islands into that which can be entirely accounted for in terms of habitat diversity,
and that which remains and must be accounted for by island area in its own right.
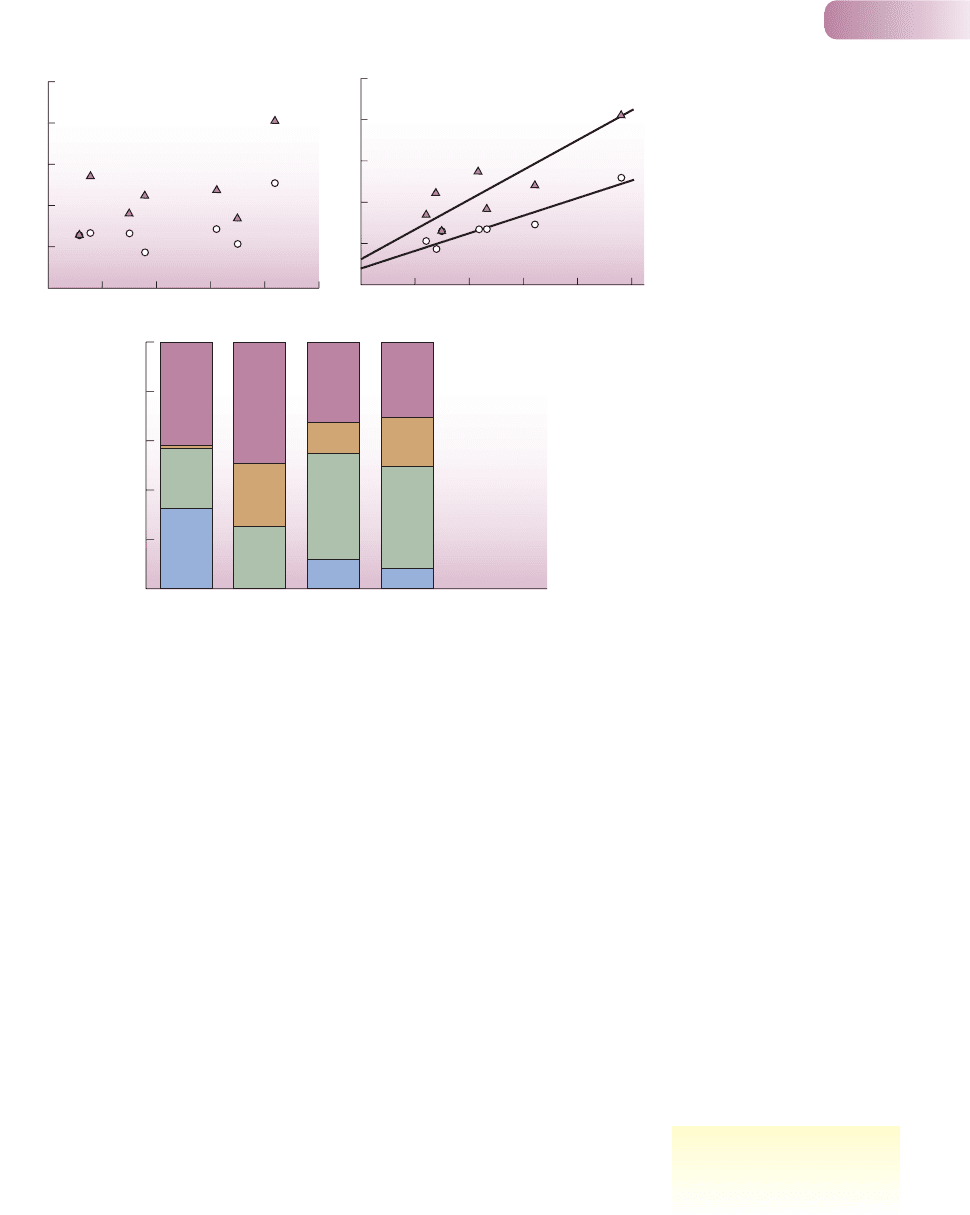
For beetles on the Canary Islands, the relationship between species richness and
habitat diversity (as measured by plant species richness) is much stronger than
that with island area, and this is particularly marked for the herbivorous beetles,
presumably because of their particular food plant requirements (Figure 10.14a).
Contrasting with the Canary Island results, in a study of a variety of animal groups
living on the Lesser Antilles islands in the West Indies, the variation in species
richness from island to island was partitioned, statistically, into that attributable
to island area alone, that attributable to habitat diversity alone, that attributable to
correlated variation between area and habitat diversity (and hence not attributable
to either alone) and that attributable to neither (Figure 10.14b). For reptiles and
amphibians, like the beetles of the Canary Islands, habitat diversity was far more
important than island area. But for bats, the reverse was the case; and for birds
and butterflies, both area itself and habitat diversity had important roles to play.
Overall, therefore, studies like this suggest a separate area effect (larger islands are
larger targets for colonization; populations on larger islands have a lower risk of
extinction) beyond a simple correlation between area and habitat diversity.
An example of species impoverishment on more remote islands can be seen in
Figure 10.15 for non-marine, lowland birds on tropical islands in the southwest
Pacific. With increasing distance from the large ‘source’ landmass of Papua New
Guinea, there is a decline in the number of species, expressed as a percentage of
the number present on an island of similar area but close to Papua New Guinea.
Chapter 10 Patterns in species richness
343
Species richness
(a)
(b)
250
200
150
100
50
0
250
200
150
100
50
0
0 500 1000 1500 2000 2500
Island area (km
2
)
0 200 400 600 800 1000
Number of plant species
1.0
0.8
0.6
0.4
0.2
0
Proportion of variance
Bats Reptiles and
amphibians
Birds Butterflies
Neither
Habitat diversity
Both
Island area
Figure 10.14
(a) The relationships between
species richness of herbivorous
(circles) and carnivorous (triangles)
beetles of the Canary Islands
and both island area (left) and
plant species richness (right).
(b) Proportion of variance in species
richness, for four animal groups,
among islands in the Lesser Antilles
related uniquely to island area (blue),
related uniquely to habitat diversity
(orange), related to correlated
variation between area and habitat
diversity (green) and unexplained
by either (maroon). Regression lines
are significant at P < 0.05; no lines
are shown in the left panel of (a)
because the regression are not
significant.
(A) AFTER BECKER, 1992; (B) AFTER RICKLEFS & LOVETTE, 1999
bird species richness on
Pacific islands decreases
with remoteness
9781405156585_4_010.qxd 11/5/07 14:58 Page 343
A more transient but nonetheless important reason for the species impoverish-
ment of islands, especially remote islands, is the fact that many lack species that
they could potentially support, simply because there has been insufficient time
for the species to colonize. An example is the island of Surtsey, which emerged
in 1963 as a result of a volcanic eruption. The new island, 40 km southwest of
Iceland, was reached by bacteria and fungi, some sea birds, a fly and seeds of
several beach plants within 6 months of the start of the eruption. Its first established
vascular plant was recorded in 1965, the first moss colony in 1967 and the first
bush (a dwarf willow, Salix herbacea) in 1998. An earthworm was found in 1993
and slugs in 1998, probably carried in by birds (Hermannsson, 2000). By 2004,
more than 50 species of vascular plant, 53 mosses, 45 lichens and 300 species of
invertebrate had been recorded, though not all persisted (Surtsey Research Society,
website www.surtsey.is). Colonization by new species occurred both above and
below the water line, with marine invertebrates, which disperse as larval stages in
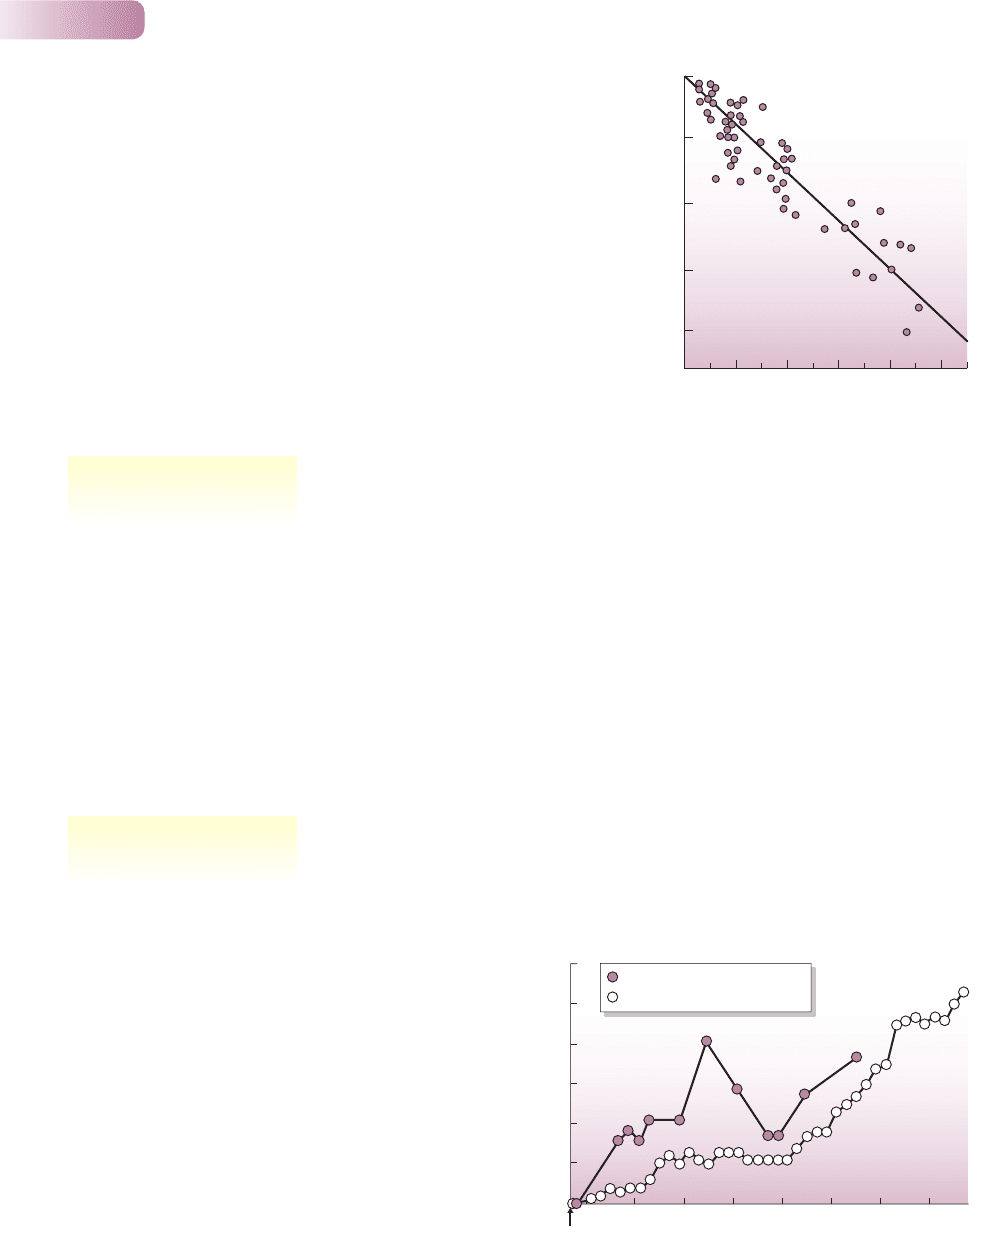
the ocean, accumulating faster than terrestrial plants (Figure 10.16).
Finally, it is important to reiterate that no aspect of ecology can be fully under-
stood without reference to evolutionary processes (see Chapter 2), and this is
particularly true for an understanding of island communities. On isolated islands,
Part III Individuals, Populations, Communities and Ecosystems
344
60
50
40
30
20
10
0
1965
1963
1970 1975 1980
1985
1990 20001995
Species richness
Year
Terrestrial vascular plants
Coastal marine invertebrates
0 2,000 4,000 6,000 8,000 10,000
Distance from Papua New Guinea (km)
100
50
25
12.5
6.25
Degree of saturation (%)
Figure 10.15
The number of resident, non-marine, lowland
bird species on islands more than 500 km
from the large ‘source’ landmass of Papua
New Guinea expressed as a percentage
of the number of species on an island of
equivalent area but close to Papua New
Guinea – this can be thought of as the
‘degree of saturation’ of the bird community.
It is plotted against island distance from
Papua New Guinea.
AFTER DIAMOND, 1972
Figure 10.16.
Regular surveys of species richness of animals and plants have
occurred since the emergence in 1963 of the volcanic Surtsey
Island, near Iceland. Shown here are the results of standard
surveys of coastal marine invertebrates up to 1992 (barnacles,
isopods, decapods, mollusks, starfish, brittlestars, sea urchins
and sea squirts; maroon circles) and of terrestrial vascular plants
up to 2004 (open circles).
AFTER HERMANNSON, 2000; SURTSEY RESEARCH SOCIETY, WEBSITE WWW.SURTSEY.IS
species missing because of
insufficient time for colonization
evolution rates on islands may be
faster than colonization rates
9781405156585_4_010.qxd 11/5/07 14:58 Page 344
the rate at which new species evolve may be comparable to or even faster than
the rate at which they arrive as new colonists. Clearly, the communities of these
islands will be incompletely understood by reference only to ecological processes.
Take the remarkable numbers of Drosophila species (fruitflies) found on the
remote volcanic islands of Hawaii. There are probably about 1500 Drosophila
species worldwide but at least 500 of these are found on the Hawaiian Islands;
they have evolved, almost entirely, on the islands themselves. The communities
of which they are a part are clearly much more strongly affected by local evolution
and speciation than by the processes of invasion and extinction.
10.5.2 Latitudinal gradients
One of the most widely recognized patterns in species richness is the increase that
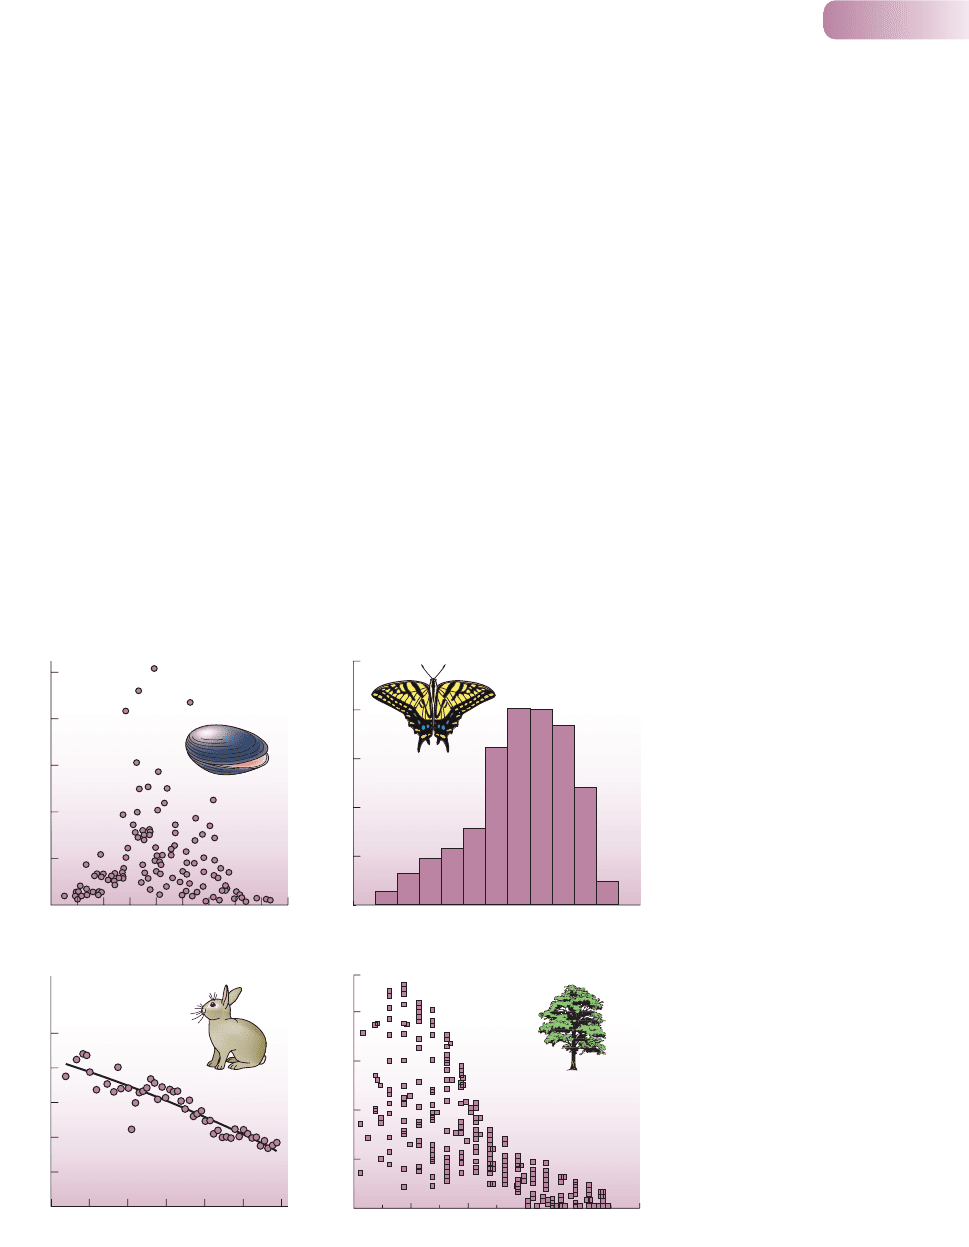
occurs from the poles to the tropics. This can be seen in a wide variety of groups,
including trees, marine invertebrates, butterflies and lizards (Figure 10.17). The
pattern can be seen, moreover, in terrestrial, marine and freshwater habitats.
A number of explanations have been put forward for the general latitudinal
trend in species richness, but not one of these is without problems. In the first place,
the richness of tropical communities has been attributed to a greater intensity of
predation and to more specialized predators. More intense predation could reduce
the importance of competition, permitting greater niche overlap and promoting
higher richness (see Figure 10.3c), but predation cannot readily be forwarded as
Chapter 10 Patterns in species richness
345
Species richness
100
10 40 50 7020 30 60
40
20
(c) Mammals
0
60
80
Species richness
Latitude (degrees)
(a) Marine bivalves
500
400
300
200
100
0
90 70 50 30 10 10 30 50 70 90
N S Latitude (degrees)
70 60 50 5040 4030 3020 2010 0 10
NS
(b) Butterflies
0
20
40
60
80
160
120
80
40
0
25 35 45 55 65 75
(d) Trees
Latitude (°N) Latitude (°N)
Figure 10.17
Latitudinal patterns in species
richness for: (a) marine bivalves,
(b) swallowtail butterflies,
(c) mammals in North America, and
(d) trees in North America. In each
case there is a decline from low
latitudes (the equator is at 0°) to
high latitudes (the poles are at 90°).
(a) AFTER FLESSA & JABLONSKI, 1995; (b) AFTER
SUTTON & COLLINS, 1991; (c) AFTER ROSENZWEIG &
SANDLIN, 1997; (d) AFTER CURRIE & PAQUIN, 1987
9781405156585_4_010.qxd 11/5/07 14:58 Page 345

the root cause of tropical richness, since this begs the question of what gives rise
to the richness of the predators themselves.
Second, increasing species richness may be related to an increase in productivity
as one moves from the poles to the equator. Certainly, on average, there is more
heat and more light energy in increasingly tropical regions, and, as discussed in
Section 10.3.1, both of these have tended to be associated with greater species
richness, though increased productivity in at least some cases has been associated
with reduced richness.
Moreover, light and heat are not the only determinants of plant productivity.
Tropical soils tend, on average, to have lower concentrations of plant nutrients than
temperate soils. The species-rich tropics might therefore be seen, in this sense, as
reflecting their low productivity. In fact, tropical soils are poor in nutrients because
most of the nutrients are locked up in the large tropical biomass. A productivity
argument might therefore have to run as follows. The light, temperature and water
regimes of the tropics lead to high biomass communities but not necessarily to diverse
communities. This, though, leads to nutrient-poor soils and perhaps a wide range of
light regimes from the forest floor to canopy far above. These in turn lead to high
plant species richness and thus to high animal species richness. There is certainly
no simple ‘productivity explanation’ for the latitudinal trend in richness.
Some ecologists have invoked the climate of low latitudes as a reason for their
high species richness. Specifically, equatorial regions are generally less seasonal than
temperate regions, and this may allow species to be more specialized (i.e. have
narrower niches, see Figure 10.3b). The greater evolutionary ‘age’ of the tropics has
also been proposed as a reason for their greater species richness, and another line
of argument suggests that the repeated fragmentation and coalescence of tropical
forest refugia promoted genetic differentiation and speciation, accounting for much
of the high richness in tropical regions. And in a related context, we have already
noted that the rate of evolution may be faster in the tropics (see Section 10.4.3).
All these ideas are plausible too, but far from proven generalizations.
Overall, therefore, the latitudinal gradient lacks an unambiguous explanation.
This is hardly surprising. The components of a possible explanation – trends with
productivity, climatic stability and so on – are themselves understood only in an
incomplete and rudimentary way, and the latitudinal gradient intertwines these
components with one another, and with other, often opposing forces – isolation,
harshness and so on.
10.5.3 Gradients with altitude and depth
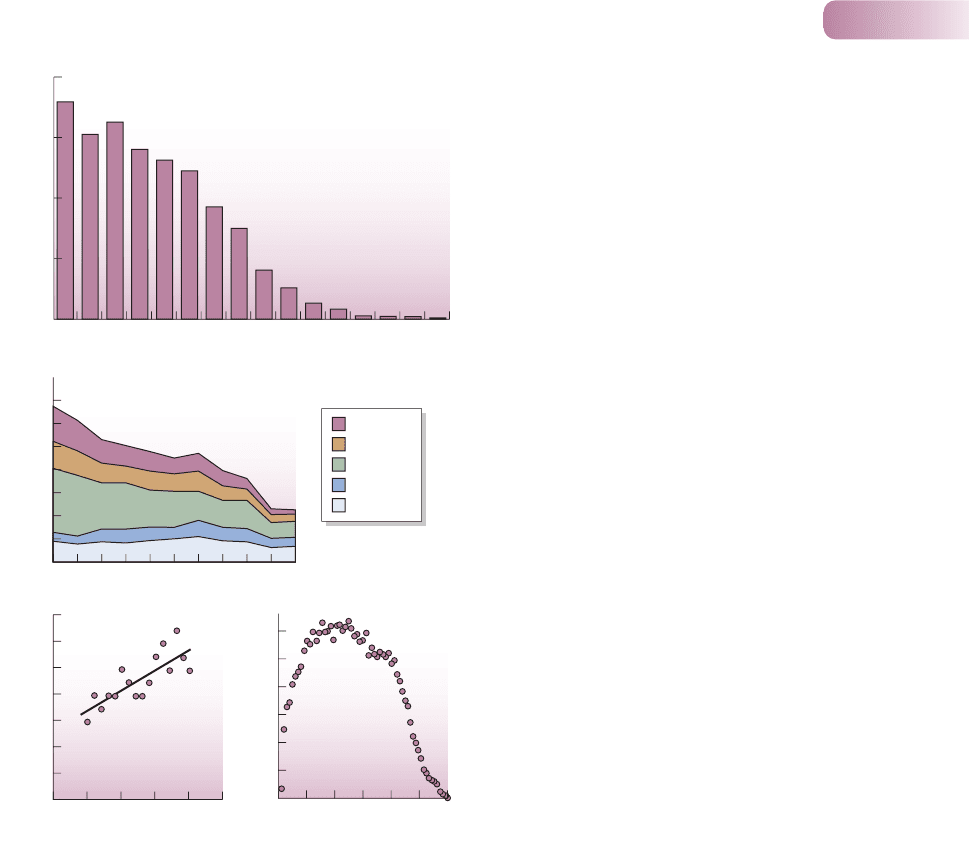
A decrease in species richness with altitude, analogous to that observed with latitude,
has frequently been reported in terrestrial environments (e.g. Figure 10.18a, b). On
the other hand, some have reported an increase with altitude (e.g. Figure 10.18c),
while about half the studies of altitudinal species richness have described hump-
shaped patterns (e.g. Figure 10.18d) (Rahbek, 1995).
At least some of the factors instrumental in the latitudinal trend in richness are
also likely to be important as explanations for altitudinal trends (though the prob-
lems in explaining the latitudinal trend apply equally to altitude). For example,
declines in species richness have often been explained in terms of decreasing
productivity associated with lower temperatures and shorter growing seasons
at higher altitude, or physiological stress associated with climatic extremes near
Part III Individuals, Populations, Communities and Ecosystems
346
productivity as an explanation?
climatic variation or evolutionary
age as explanations?
9781405156585_4_010.qxd 11/5/07 14:58 Page 346
mountaintops. Indeed, the explanation for the converse, positive relationship
between ant diversity and altitude in Figure 10.18c, is that precipitation increased
with altitude in this case, resulting in higher productivity and less physiologically
extreme conditions at higher altitude. In addition, high-altitude communities
almost invariably occupy smaller areas than lowlands at equivalent latitudes, and
they will usually be more isolated from similar communities than lowland sites.
Therefore the effects of area and isolation are likely to contribute to observed
decreases in species richness with altitude.
In aquatic environments, the change in species richness with depth shows
some strong similarities to the terrestrial gradient with altitude. In larger lakes, the
cold, dark, oxygen-poor abyssal depths contain fewer species than the shallow
surface waters. Likewise, in marine habitats, plants are confined to the photic
zone (where light penetrates and they can photosynthesize), which rarely extends
below 30 m. In the open ocean, therefore, there is a rapid decrease in richness
Chapter 10 Patterns in species richness
347
Species richnessSpecies richness
140
1500 1900 2100 2300 2500
(b)
1700
0
120
100
80
60
40
20
500
1000
1500
2000
2500
3000
14(c)
0
12
10
8
6
4
2
500
1000
4000
2000
5000
6000
1200
(d)
0
1000
800
600
400
200
3000
Shrubs
Herbs
Epiphytes
Altitude (m)
Altitude (m) Altitude (m)
Vines
Trees
(a)
500
1000
1500
2000
2500
3000
3500
4000
4500
5000
5500
6000
6500
7000
7500
8000
Species richness
0
100
200
300
400
Altitude (m)
Figure 10.18
Relationships between species richness and altitude for:
(a) breeding birds in the Nepalese Himalayas, (b) plants in the
Sierra Manantlán, Mexico, (c) ants in Lee Canyon in the Spring
Mountains of Nevada, USA, and (d) flowering plants in the
Nepalese Himalayas. Species richness decreases with altitude
in (a) and (b), increases with altitude in (c) and shows a
hump-backed relationship in (d).
(a) AFTER HUNTER & YONZON, 1992; (b) AFTER VÁZQUEZ & GIVNISH, 1998; (c) AFTER SANDERS ET AL., 2003; (d) AFTER GRYTNES & VETAAS, 2002
9781405156585_4_010.qxd 11/5/07 14:58 Page 347

with depth, reversed only by the variety of bizarre animals living on the ocean
floor. Interestingly, however, in coastal regions the effect of depth on the species
richness of benthic (bottom-dwelling) animals is to produce not a single gradient,
but a peak of richness at about 1000 m, possibly reflecting higher environmental
predictability there (Figure 10.19). At greater depths, beyond the continental
slope, species richness declines again, probably because of the extreme paucity of
food resources in abyssal regions.
10.5.4 Gradients during community succession
Section 9.4 described how, in community successions, if they run their full course,
the number of species first increases (because of colonization) but eventually
decreases (because of competition). This is most firmly established for plants, but
the few studies that have been carried out on animals in successions indicate, at
the least, a parallel increase in species richness in the early stages of succession.
Figure 10.20 illustrates this for birds following the cessation of shifting cultiva-
tion in tropical rain forest, and for insects associated with an old-field succession
in a temperate region.
To a certain extent, the successional gradient is a necessary consequence of
the gradual colonization of an area by species from surrounding communities
that are at later successional stages; that is, later stages are more fully saturated
with species (see Figure 10.3d). However, this is a small part of the story, since
succession involves a process of the replacement of species and not just the mere
addition of new ones.
Indeed, as with the other gradients in species richness, there is something of
a cascade effect with succession: one process that increases richness kick-starts a
second, which feeds into a third, and so on. The earliest species will be those that
are the best colonizers and the best competitors for open space. They immedi-
ately provide resources (and introduce heterogeneity) that were not previously
present. For example, the earliest plants generate resource depletion zones (see
Section 3.3.2) in the soil that inevitably increase the spatial heterogeneity of plant
nutrients. The plants themselves provide a new variety of microhabitats, and for
the animals that might feed on them they provide a much greater range of food
resources (see Figure 10.3a). The increase in herbivory and predation may then
Part III Individuals, Populations, Communities and Ecosystems
348
0
1
2
3
4
5
1008040
0
Species richness
Depth (km)
Figure 10.19
Depth gradient in species richness
of bottom-dwelling vertebrates and
invertebrates (fish, decapods,
holothurians, asteroids) in the ocean
southwest of Ireland.
AFTER ANGEL 1994
a cascade effect?
9781405156585_4_010.qxd 11/5/07 14:58 Page 348