Trauth M.H., MATLAB® Recipes for Earth Sciences, Third edition
Подождите немного. Документ загружается.

138 5 TIME-SERIES ANALYSIS
vector. ofac is the oversampling parameter that in uences the resolution
of the frequency axis about the
N(frequencies)=N(datapoints)case.
We also need the highest frequency
fhi that can be analyzed by the Lomb-
Scargle algorithm: a common way to choose
fhi is to take the Nyquist fre-
quency
fnyq that would be obtained if the N data points were evenly spaced
over the same time interval. e following code uses the input parameter
hifac, which is de ned by Press et al. (1992) as hifac=fhi/fnyq.
int = mean(diff(t));
ofac = 4; hifac = 1;
f = ((2*int)^(-1))/(length(x)*ofac): ...
((2*int)^(-1))/(length(x)*ofac): ...
hifac*(2*int)^(-1);
where int is the mean sampling interval. We normalize the data by sub-
tracting the mean.
x = x - mean(x);
We can now compute the normalized Lomb-Scargle periodogram px as a
function of the angular frequency
wrun using the translation of Scargle's
FORTRAN code into MATLAB code.
for k = 1:length(f)
wrun = 2*pi*f(k);
px(k) = 1/(2*var(x)) * ...
((sum(x.*cos(wrun*t - ...
atan2(sum(sin(2*wrun*t)),sum(cos(2*wrun*t)))/2))).^2) ...
/(sum((cos(wrun*t - ...
atan2(sum(sin(2*wrun*t)),sum(cos(2*wrun*t)))/2)).^2)) + ...
((sum(x.*sin(wrun*t - ...
atan2(sum(sin(2*wrun*t)),sum(cos(2*wrun*t)))/2))).^2) ...
/(sum((sin(wrun*t - ...
atan2(sum(sin(2*wrun*t)),sum(cos(2*wrun*t)))/2)).^2));
end
e signi cance level for any peak in the power spectrum px can now be
computed. e variable
prob indicates the false-alarm probability for the
null hypothesis: a low
prob therefore indicates a highly signi cant peak in
the power spectrum.
prob = 1-(1-exp(-px)).^length(x);
We now plot the power spectrum and the probabilities (Fig. 5.14):
plot(f,px)
xlabel('Frequency')
ylabel('Power')
title('Lomb-Scargle Power Spectrum')

5.8 WAVELET POWER SPECTRUM 139
5 TIME-SERIES ANALYSIS
figure
plot(f,prob)
xlabel('Frequency')
ylabel('Probability')
title('Probabilities')
e two plots suggest that all three peaks are highly signi cant since the er-
rors are extremely low at the cyclicities of 100, 40 and 20 kyrs.
An alternative way of displaying the signi cance levels was suggested by
Press et al. (1992). In this method the equation for the false-alarm probabil-
ity of the null hypothesis is inverted to compute the corresponding power
of the signi cance levels. As an example, we choose a signi cance level of
95 %. However, this number can also be replaced by a vector of several sig-
ni cance levels such as
signif=[0.90 0.95 0.99]. We can now type
m = floor(0.5*ofac*hifac*length(x));
effm = 2*m/ofac;
signif = 0.95;
levels = log((1-signif.^(1/effm)).^(-1));
where m is the true number of independent frequencies and effm is the ef-
fective number of frequencies using the oversampling factor
ofac. e sec-
ond plot displays the spectral peaks and the corresponding probabilities.
plot(f,px)
hold on
for k = 1:length(signif)
line(f,levels(:,k)*ones(size(f)),'LineStyle','--')
end
xlabel('Frequency')
ylabel('Power')
title('Lomb-Scargle Power Spectrum')
hold off
All three spectral peaks at frequencies of 0.01, 0.025 and 0.05 kyr
–1
exceed
the 95 % signi cant level suggesting that they represent signi cant cyclici-
ties. We have therefore obtained similar results to those obtained from the
periodogram method. However, the Lomb-Scargle method does not require
any interpolation of unevenly-spaced data. Furthermore, it allows for quan-
titative signi cance testing.
5.8 Wavelet Power Spectrum
Section 5.6 demonstrated the use of a modi cation to the power spectrum
method for mapping changes in cyclicity through time. In principle, a
similar modi cation could be applied to the Lomb-Scargle method, which
140 5 TIME-SERIES ANALYSIS
Frequency
Probability
0.1
0.2
0.3
0.4
0.5
0.6
0.7
0.8
0.9
1
0 0.02 0.04 0.06 0.08 0.1 0.12 0.14 0.16 0.18
0
Frequency
Power
0 0.02 0.04 0.06 0.08 0.1 0.12 0.14 0.16 0.18
5
10
15
25
30
35
40
0
Probabilities
Lomb-Scargle Powerspectrum
b
a
20
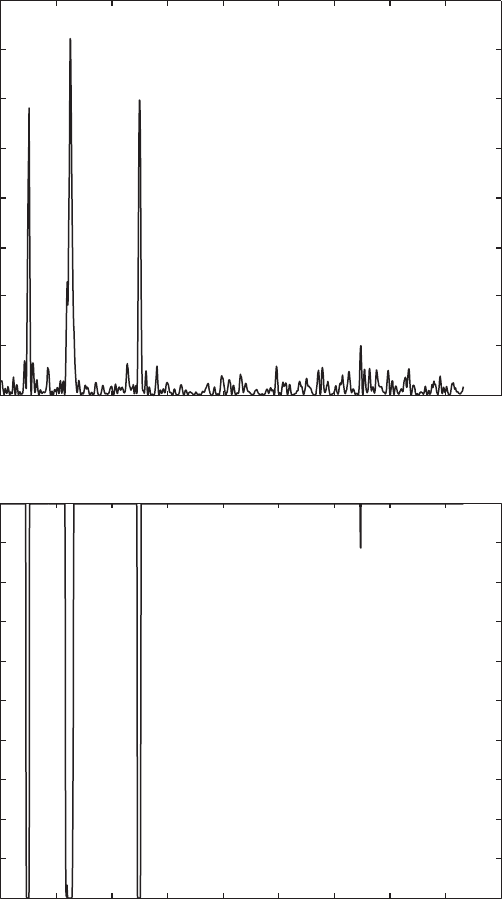
Fig. 5.14 a Lomb-Scargle power spectrum and b the false-alarm probability of the null
hypothesis. e plot suggests that the 100, 40 and 20 kyr cycles are highly signi cant.
5.8 WAVELET POWER SPECTRUM 141
5 TIME-SERIES ANALYSIS
would have the advantage that it could then be applied to unevenly-spaced
data. Both methods, however, assume that the data are a composite of sine
and cosine waves that are globally uniform in time and have in nite time
spans. e evolutionary power spectrum method divides the time series
into overlapping segments and computes the Fourier transform of these
segments. To avoid spectral leakage, the data are multiplied by windows
that are smooth bell-shaped curves with positive values (Section 5.3). e
higher the temporal resolution of the evolutionary power spectrum the
lower the accuracy of the result. Moreover, short time windows contain a
large number of high-frequency cycles whereas the low-frequency cycles are
underrepresented.
In contrast to the Fourier transform, the wavelet transform uses base
functions ( wavelets) that have smooth ends per se (Lau and Weng 1995,
Mackenzie et al. 2001). Wavelets are small packets of waves; they are de-
ned by a speci c frequency and decay towards either end. Since wavelets
can be stretched and translated in both frequency and time, with a ex-
ible resolution, they can easily map changes in the time-frequency domain.
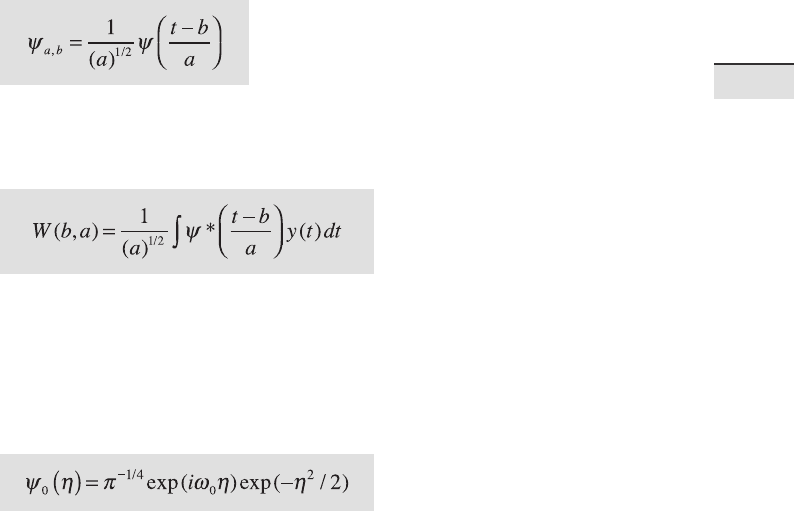
Mathematically, a wavelet transformation decomposes a signal y(t) into el-
ementary functions ψ
a,b
(t) derived from a mother wavelet ψ(t) by dilation
and translation,
where b denotes the position ( translation) and a (>0) the scale ( dilation) of
the wavelet (Lau and Weng 1995). e wavelet transform of the signal y(t)
about the mother wavelet ψ(t) is de ned as the convolution integral
where ψ* is the complex conjugate of ψ de ned on the open time and scale
real (b,a) half plane.
ere are many mother wavelets available in the literature, such as the
classic Haar wavelet, the Morlet wavelet and the Daubechies wavelet. e
most popular wavelet in geosciences is the Morlet wavelet, which is given
by
142 5 TIME-SERIES ANALYSIS
−0.8
−0.6
−0.4
−0.2
0.2
0.4
0.6
0.8
−10 −8 −6 −4 −2 0 2 4 6 8 10
0
Position
Scale
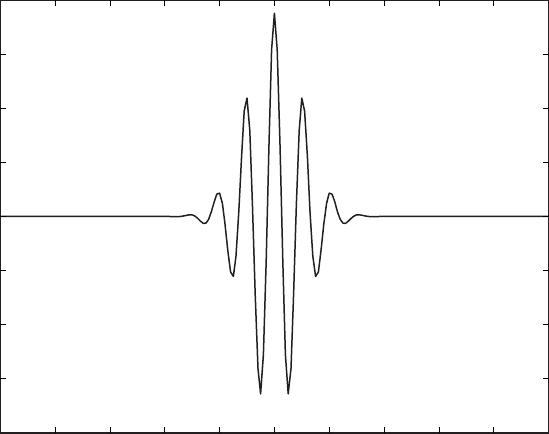
Morlet Mother Wavelet
Fig. 5.15 Morlet mother wavelet with wavenumber 6.
where η is the time and ω
0
is the wavenumber (Torrence and Compo 1998).
e wavenumber is the number of oscillations within the wavelet itself. We
can easily compute a discrete version of the Morlet wavelet
wave by trans-
lating the above equation into MATLAB code where
eta is the non-di-
mensional time and
w0 is the wavenumber. Changing w0 produces wavelets
with di erent wave numbers. Note that it is important not to use
i for index
in
for loops, since it is used here for imaginary unit (Fig. 5.15).
clear
eta = -10 : 0.1 : 10;
w0 = 6;
wave = pi.^(-1/4) .* exp(i*w0*eta) .* exp(-eta.^2/2);
plot(eta,wave)
xlabel('Position')
ylabel('Scale')
title('Morlet Mother Wavelet')
In order to familiarize ourselves with wavelet powerspectra, we use a pure

5.8 WAVELET POWER SPECTRUM 143
5 TIME-SERIES ANALYSIS
sine wave with a period ve and additive Gaussian noise.
clear
t = 0 : 0.5 : 50;
x = sin(2*pi*t/5) + randn(size(t));
As a rst step, we need to de ne the number of scales for which the wave-
let transform will be computed. e scales de ne how much a wavelet is
stretched or compressed to map the variability of the time series at di erent
wavelengths. Lower scales correspond to higher frequencies and therefore
map rapidly-changing details, whereas higher scales map the long-term
variations. As an example, we can run the wavelet analysis for 120 di erent
scales between 1 and 120.
scales = 1 : 120;
In the next step, we compute the real or complex continuous Morlet wavelet
coe cients, using the function
cwt contained in the Wavelet Toolbox.
coefs = cwt(x,scales,'morl');
e function scal2frq converts scales to pseudo-frequencies, using the
Morley mother wavelet and a sampling period of 0.5.
f = scal2frq(scales,'morl',0.5);
We use a lled contour plot to portray the power spectrum, i. e., the absolute
value of the wavelet coe cients (Fig. 5.16).
contour(t,f,abs(coefs),'LineStyle','none','LineColor', ...
[0 0 0],'Fill','on')
xlabel('Time')
ylabel('Frequency')
title('Wavelet Power Spectrum')
We now apply this concept to the synthetic data from the example to dem-
onstrate the windowed power spectrum method, and load the synthetic
data contained in le
series3.txt, remembering that the data contain
periodicities of 100, 40, 20 kyr as well as additive Gaussian noise, and are
unevenly spaced about the time axis.
clear
series3 = load('series3.txt');
As for the Fourier transform and in contrast to the Lomb-Scargle algorithm,
the wavelet transform requires evenly-spaced data, and we therefore inter-

144 5 TIME-SERIES ANALYSIS
0 5 10 15 20 25 30 35 40 45 50
0.2
0.4
0.6
0.8
1.2
1.4
1.6
1
0
Time
Frequency
Wavelet Powerspectrum
Fig. 5.16 Wavelet power spectrum showing a signi cant period at 5 cycles that persists
throughout the full length of the time vector.
polate the data using interp1.
t = 0 : 3 : 1000;
series3L = interp1(series3(:,1),series3(:,2),t,'linear');
We then compute the wavelet transform for 120 scales using the function
cwt and a Morley mother wavelet, as we did for the previous example.
scales = 1 : 120;
coefs = cwt(series3L,scales,'morl');
We use scal2freq to convert scales to pseudo-frequencies, using the
Morley mother wavelet and the sampling period of three.
f = scal2frq(scales,'morl',3);
5.8 WAVELET POWER SPECTRUM 145
5 TIME-SERIES ANALYSIS
0.05
0.1
0.15
0.2
0.25
0 100 200 300 400 500 600 700 800 900 1000
0
Time
Frequency
Wavelet Powerspectrum
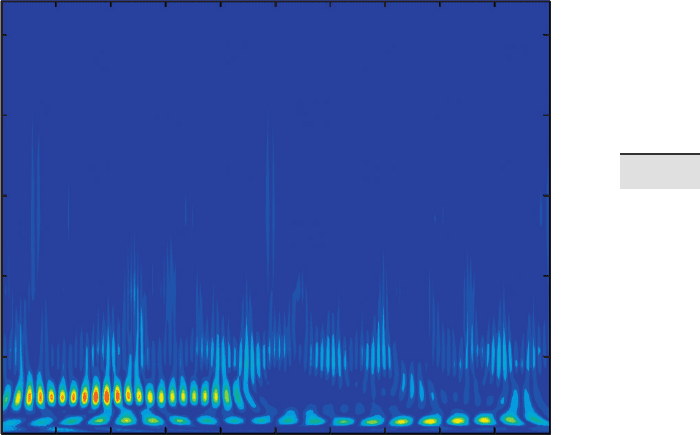
Fig. 5.17 Wavelet power spectrum for the synthetic data series contained in series_3.txt.
e plot clearly shows signi cant periodicities at frequencies of 0.01, 0.25, and 0.5 kyr
-1
corresponding to the 100, 40, and 20 kyr cycles. e 100 kyr cycle is present throughout the
entire time series, whereas the 40 kyr cycle only appears at around 450 kyrs before present.
e 20 kyr cycle is relatively weak but probably present throughout the entire time series.
We can now use a lled contour plot to portray the wavelet power spectrum,
i. e., the absolute value of the wavelet coe cients (Fig. 5.17).
contour(t,f,abs(coefs),'LineStyle', 'none', ...
'LineColor',[0 0 0],'Fill','on')
xlabel('Time'),ylabel('Frequency')
title('Wavelet Power Spectrum')
e graph shows horizontal clusters of peaks at 0.01 and 0.05 kyr
–1
cor-
responding to 100 and 20 kyr cycles, although the 20 kyr cycle is not very
clear. e wavelet power spectrum also reveals a signi cant 40 kyr cycle
or a frequency of 0.025 kyr
–1
that appears at ca. 450 kyrs before present.
Compared to the windowed power spectrum method, the wavelet power
spectrum clearly shows a much higher resolution on both the time and the
frequency axes. Instead of dividing the time series into overlapping seg-
146 5 TIME-SERIES ANALYSIS
ments and computing the power spectrum for each segment, the wavelet
transform uses short packets of waves that better map temporal changes in
the cyclicities. e disadvantage of both the windowed power spectrum and
the wavelet power spectral analyses, however, is the requirement for evenly-
spaced data. e Lomb-Scargle method overcomes this problem but as for
the power spectrum method, has limitations in its ability to map temporal
changes in the frequency domain.
5.9 Nonlinear Time-Series Analysis (by N. Marwan)
e methods described in the previous sections detect linear relationships
in the data. However, natural processes on the Earth o en show a more
complex and chaotic behavior, and methods based on linear techniques may
therefore yield unsatisfactory results. In recent decades, new techniques for
nonlinear data analysis derived from chaos theory have become increas-
ingly popular. Such methods have, for example, been employed to describe
nonlinear behavior by de ning, e. g., scaling laws and fractal dimensions of
natural processes (Turcotte 1997, Kantz and Schreiber 1997). However, most
methods of nonlinear data analysis require either long or stationary data se-
ries, and these requirements are rarely satis ed in the earth sciences. While
most nonlinear techniques work well on synthetic data, these methods are
unable to describe nonlinear behavior in real data.
In the last decade, recurrence plots have become very popular in sci-
ence and engineering as a new method of nonlinear data analysis (Eckmann
1987, Marwan 2007). Recurrence is a fundamental property of dissipative
dynamical systems. Although small disturbances in such systems can cause
exponential divergence in their states, a er some time the systems will re-
turn to a state that is arbitrarily close to a former state and pass through a
similar evolution. Recurrence plots allow such recurrent behavior of dy-
namical systems to be visually portrayed. e method is now a widely ac-
cepted tool for the nonlinear analysis of short and nonstationary data sets.
Phase Space Portrait
e starting point for most nonlinear data analyses is the construction of a
phase space portrait for a system. e state of a system can be described by
its state variables x
1
(t), x
2
(t), …, x
d
(t). As an example, suppose the two vari-
ables temperature and pressure are used to describe the thermodynamic
state of the Earth’s mantle as a complex system. e d state variables at time

5.9 NONLINEAR TIME-SERIES ANALYSIS (BY N. MARWAN) 147
5 TIME-SERIES ANALYSIS
t form a vector in a d-dimensional space – the so-called phase space. e
state of a system typically changes with time and the vector in the phase
space therefore describes a trajectory representing the temporal evolution,
i. e., the dynamics of the system. e course of the trajectory provides es-
sential information on the dynamics of the system, such as whether systems
are periodic or chaotic.
In many applications, the observation of a natural process does not yield
all possible state variables, either because they are not known or because
they cannot be measured. However, due to coupling between the system’s
components, we can reconstruct a phase space trajectory from a single ob-
servation u
i
:
where m is the embedding dimension and τ is the time delay (index based;
the real time delay is τ=Δt). is reconstruction of the phase space is called
time delay embedding. e phase space reconstruction is not exactly the
same as the original phase space, but its topological properties are preserved,
provided the embedding dimension is large enough. In practice, the embed-
ding dimension must be more than twice the the dimension of the attractor,
or exactly m>2d+1. e reconstructed trajectory is then su ciently accurate
for subsequent data analysis.
As an example, we now explore the phase space portrait of a harmonic
oscillator, such as an undamped pendulum. First, we create the position
vector
x1 and the velocity vector x2
clear
t = 0 : pi/10 : 3*pi;
x1 = sin(t);
x2 = cos(t);
e phase space portrait
plot(x1,x2)
xlabel('x_1')
ylabel('x_2')
is a circle, suggesting an exact recurrence of each state a er one complete
cycle (Fig. 5.18). Using the time delay embedding, we can reconstruct this
phase space portrait using only a single observation, e. g., the velocity vec-
tor, and a delay of 5, which corresponds to a quarter of the period of our
pendulum.