Труды Всемирного конгресса Международного общества солнечной энергии - 2007. Том 2
Подождите немного. Документ загружается.

Proceedings of ISES Solar World Congress 2007: Solar Energy and Human Settlement
662
The metal absorber is a thin cylindrical fin of, spanning the
length of the tube. It is coated with a selective coating that was
developed by Beijing Eurocon Solar Energy Tech. Company.
The transmittance of the glass tube was measured at the US
National Renewable Energy Laboratory in Golden,
Colorado. The solar-weighted transmittance was found to
be 91.7%, which the authors consider a good result. The
authors also measured the absorptance and emittance of the
absorber. The absorptance was found to be 0.904, with an
emittance of 0.050 at room temperature, and an emittance
of 0.064 at 200
o
C.
2.2 Manifold
The authors used a copper manifold made by Beijing
Eurocon Solar Energy Tech. Company in Beijing, China.
The manifold collects the fluid that is circulated through
the parallel absorber tubes.
2.3 Reflector
The reflector material is a polished aluminum reflector
made by Alanod, Germany. Its solar-weighted
hemispherical reflectance is 91.9%.
The concentration ratio of the reflector is 1.15 (if the tubes
are oriented in North-South direction) and 1.8 (in East-West
orientation). The acceptance angle is ±60º (North-South)
and ±34º (East-West). The truncation is 20% in both
orientations.
2.4 Frame
The authors used a wooden frame that was made in Merced,
California. It holds six absorber tubes, the reflector and the
manifold. The frame contains seven wooden ribs for each
tube that are mounted on a wooden ground plate. The ribs
provide support for the reflector foil. The Alanod reflector
foil is glued onto the wooden ribs. The ribs are cut to the
shape that is necessary to achieve the optical concentration.
The absorber tubes are then placed perpendicular to the ribs.
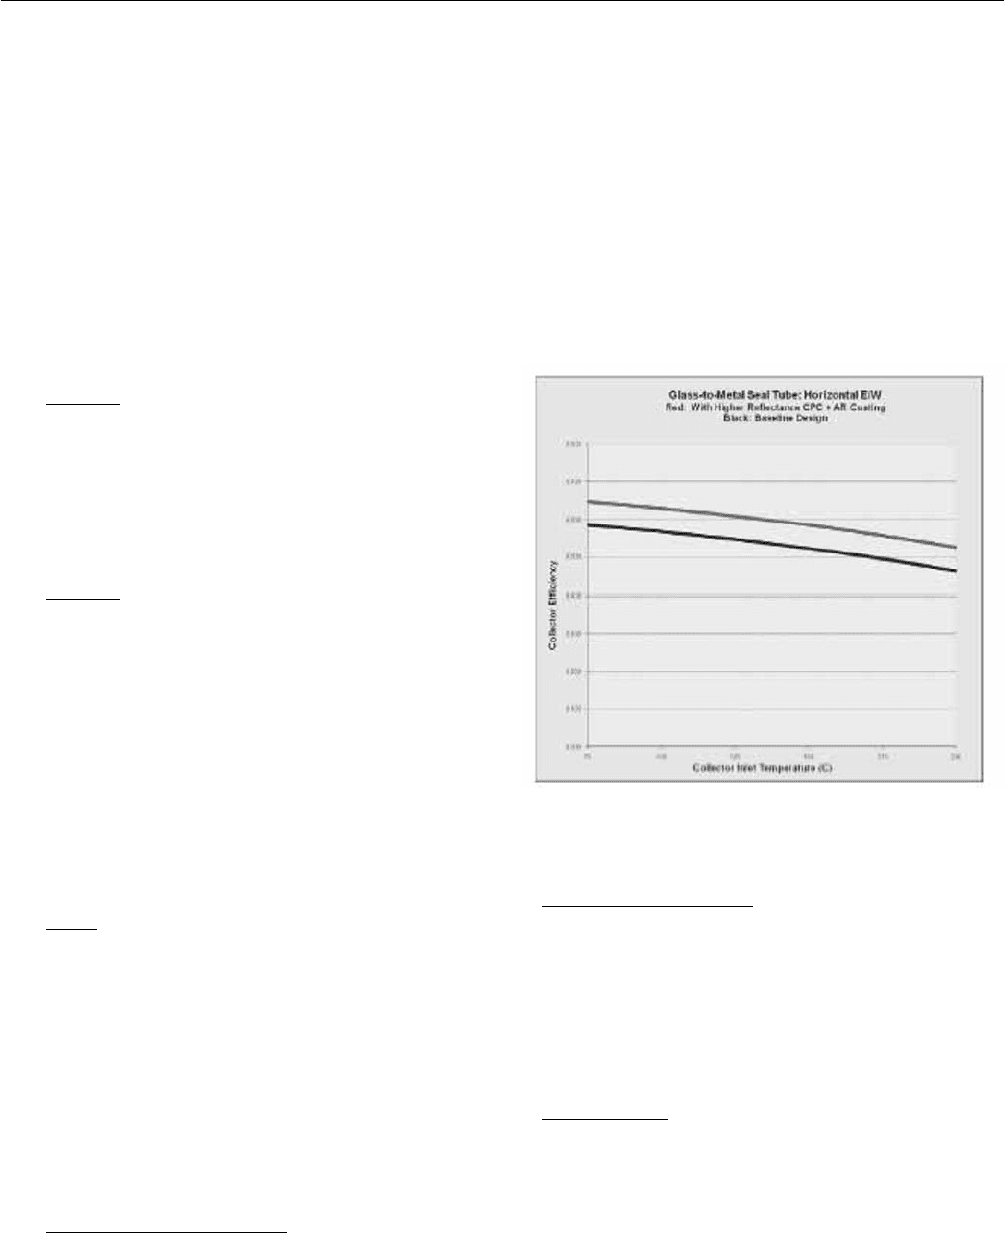
2.5 Expected Collector Efficiency
The authors developed theoretical models that describe the
expected performance of the XCPC. The model indicates a
collector efficiency at 200ºC of 46.4% for a baseline design
and of 52.6% for an improved design (see Figure1), if the
tubes are oriented in East-West direction.
The baseline design uses Alanod’s Miro Sun absorber and
borosilicate glass without anti-reflective coating. The
improved design uses anti-reflective coating on both
surfaces of the glass tubes (which would increase the
solar-weighted transmittance to 96%) and a higher
reflectance CPC with a silvered reflector.
Fig. 1: Expected Efficiency of the XCPC Prototype.
3. ACKNOWLEDGMENTS
We are grateful to THE CALIFORNIA ENERGY
COMMISION for support. Project: Design and
development of low-cost high-temperature solar collectors
for mass production, 500-05-021.
4. REFERENCES
For principles of design, see: Nonimaging Optics, 2005, R.
Winston,et al, Academic Press (Elsevier).

VALIDATION OF SIMULATION MODELS FOR DIFFERENTLY
DESIGNED HEAT-PIPE EVACUATED
TUBULAR COLLECTORS
Jianhua Fan, Janne Dragsted, Simon Furbo
Department of Civil Engineering, Technical University of Denmark
Brovej, Building 118, DK-2800 Kgs Lyngby, Denmark
jif@byg.dtu.dk
ABSTRACT
Differently designed heat-pipe evacuated tubular collectors
have been investigated theoretically and experimentally.
The theoretical work has included development of two
TRNSYS (1) simulation models for heat-pipe evacuated
tubular collectors utilizing solar radiation from all
directions. One model is developed for heat-pipe evacuated
tubular collectors with flat fins and one model is developed
for heat-pipe evacuated tubular collectors with curved fins.
The models are characterized by detailed calculations of the
heat transfer processes in the fins, by detailed shadow
modeling and by fins with selective coating on both sides.
The input to the models is thus not a simple collector
efficiency expression but the actual collector geometry.
In this study, the TRNSYS models are validated with
measurements for four differently designed heat-pipe
evacuated tubular collectors. The collectors are produced
by the Chinese collector manufacturer SUNDA Technology
Co. The collectors have either flat or curved fins inside the
evacuated tubes, the tubes have different diameters and the
fins have selective coating on both sides. The collectors’
thermal performances have been measured side-by-side
under the same operation conditions in an outdoor test
facility.
For periods with different operation conditions – such as
weather conditions and inlet temperatures – measured and
calculated thermal performances are compared for the four
collectors. Further, the measured and calculated dynamic
behaviors are compared. In all four cases, a good degree of
similarity between measured and calculated results is found.
With these validated models detailed parameter analyses
and collector design optimization are now possible.
1. INTRODUCTION
The world market for solar thermal collectors has expanded
significantly in the last decades. In recent years the
evacuated tubular collectors have gained an increasing
share of the market. On the world largest solar thermal
market, China, evacuated tubular collectors have increased
the market share from 30% in 1998 up to 84% in 2002 (2).
In Germany, the market share of evacuated tubular
collectors is doubled to almost 20% in year 2001 alone due
to a nationwide subsidy program. Due to the market
development, development of theoretical models for
evacuated tubular collectors becomes more and more
important.
Thermal modelling of evacuated tubular collectors based
on collector geometry has previously been addressed. Perez
et al. [3] developed a radiation model for evacuated tubular
collectors with tubular absorbers. Lart [4] developed a
geometrical method to determine the size and position of
the shadowed area on each tube. Shah and Furbo [5, 6]
worked further on this principle and developed a new
TrnSys simulation model for all-glass evacuated tubular
Proceedings of ISES Solar World Congress 2007: Solar Energy and Human Settlement
664
collectors with cylindrical absorbers. Shah and Furbo [7]
developed two new TrnSys simulation models for heat pipe
evacuated tubular collector. The absorber fins in the
evacuated tubes are either flat or curved and the fins have
selective coating on both sides. This means that solar
radiation from all directions can be utilized. In high latitude
regions like the Arctic, the advantages of evacuated tubular
collectors are not only low heat loss and high efficiency,
but also the ability to utilize solar radiation from all
directions, due to the large variation of the solar azimuth at
high latitude.
This study presents validations of two new simulation
models for heat pipe evacuated tubular collector based on
side by side tests of four differently designed heat pipe
evacuated collectors.
2. HEAT PIPE PRINCIPLES AND MODEL DESCRIP-
TION
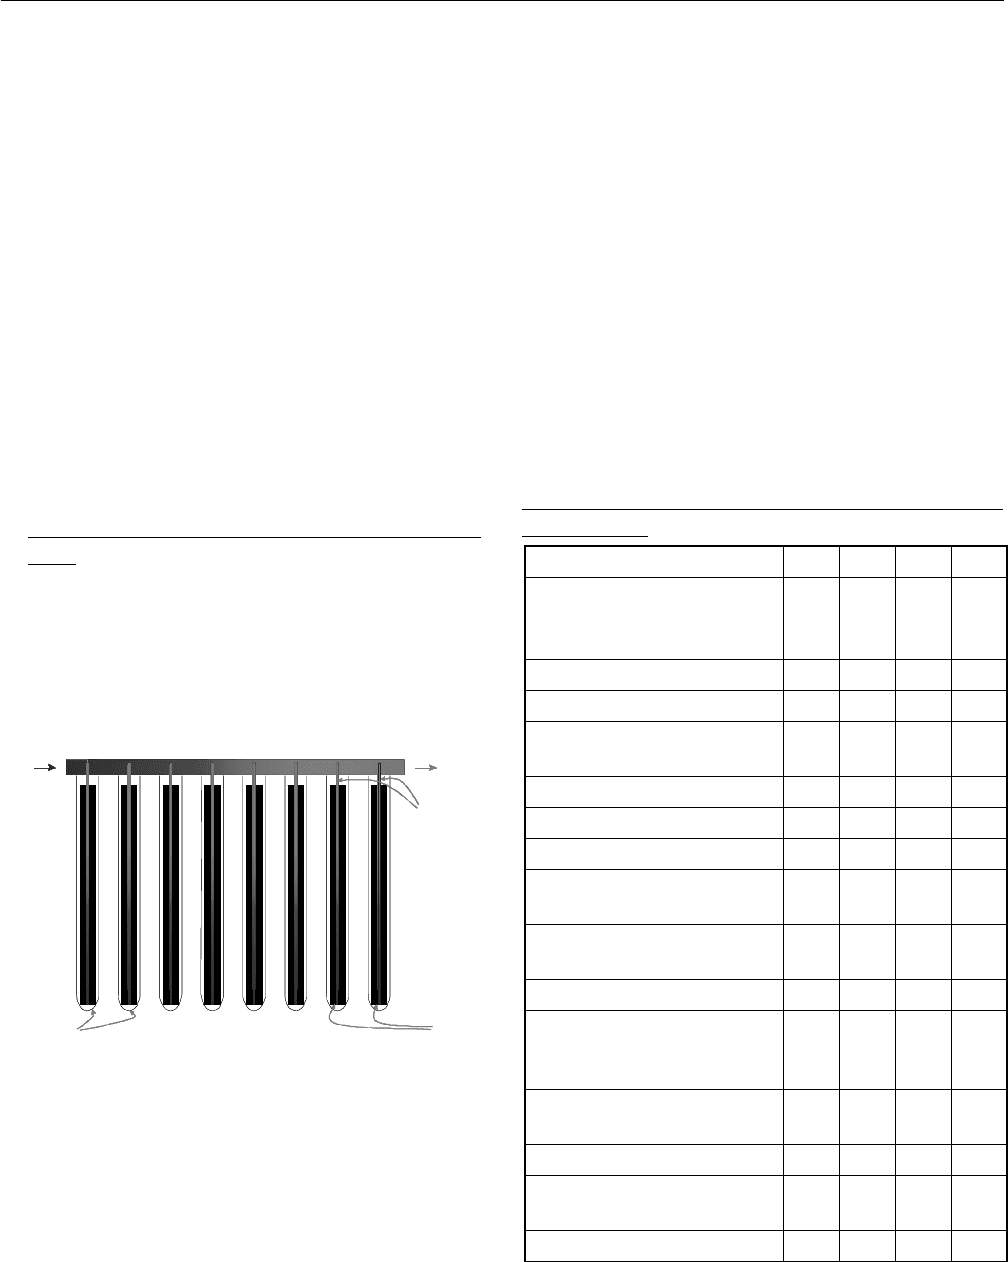
An illustration of the heat pipe evacuated tubes is given in
Fig. 1. The tubes are connected to a heat exchanger
manifold pipe with condensers for all tubes. The heat
exchanger manifold is placed above the tubes.
Glass tubes Fins
Heat pipe
s
Manifold heat exchanger pipe
Inlet
Outlet
Glass tubes Fins
Heat pipe
s
Manifold heat exchanger pipe
Inlet
Inlet
OutletOutlet
Fig. 1: The collector models include the evacuated tubular
collectors and the heat exchanger manifold pipe.
Two TrnSys [7] models for collectors with evacuated tubes
with flat and curved fins are validated. An illustration of the
models is given in Fig. 2. One of the advantages of the
model is that the size and position of the shadows and thus
the solar radiation on each tube is precisely determined at
all times. The input to the models is the exact collector
geometry (and not a standard efficiency expression) and it
is therefore possible to determine the influence of the actual
collector geometry on the yearly thermal performance. The
model is described in details in [5], [7].
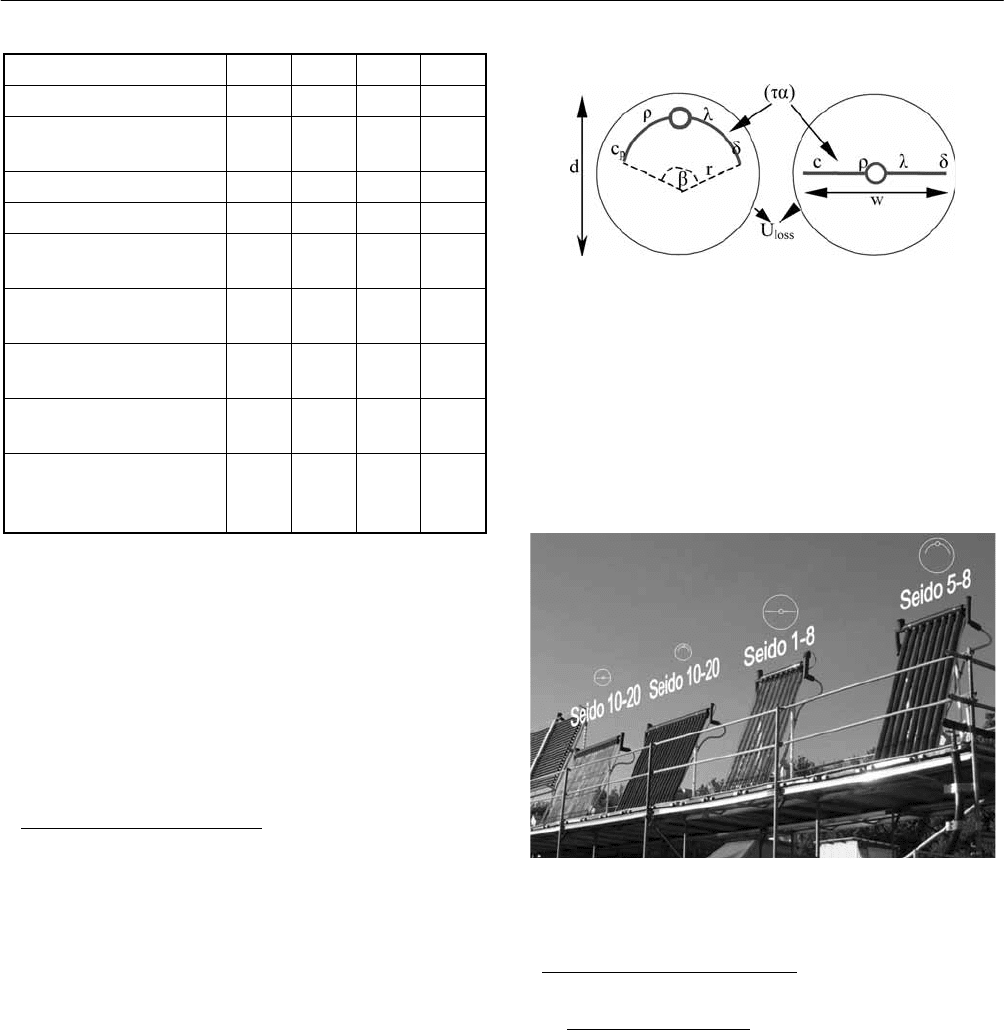
In order to validate the models, side by side tests of four
heat pipe evacuated tubular collectors from Sunda
Technology Co. were carried out. The collectors
investigated are Seido 5-8 (Col. 1), Seido 1-8 (Col. 2),
Seido 10-20 with curved fin (Col. 3) and Seido 10-20 with
flat fin (Col. 4). The tube diameter of Col 1 and Col 2 is
0.1 m while the tube diameter is 0.07 m for Col 3 and 4.
Col 2 and Col. 4 have heat pipes with flat fins, while Col 1
and Col 3 have heat pipes with curved fins. Selected inputs
for the model for collectors are listed in Table 1.
TABLE 1: DATA DESCRIBING THE COLLECTORS IN
THE MODELS
Parameters Col. 1 Col. 2 Col. 3 Col. 4
Collector type
Seido
5-8
Seido
1-8
Seido
10-20
curved
Seido
10-20
flat
Number of tubes [-] 8 8 20 20
Glass tube radius, d [m] 0.05 0.05 0.035 0.035
Absorber radius, r /absorber
width, w [m]
0.041 0.085 0.027 0.056
Tube centre distance [m] 0.120 0.120 0.090 0.090
Collector panel tilt [°] 67 67 67 67
Collector panel azimuth (°) 0 0 0 0
Incidence angle modifier for
the diffuse radiation (-)
0.9 0.9 0.9 0.9
Effective transmittance -
absorptance product, (τα)
e
(-)
0.83 0.83 0.83 0.83
Number of discretizations (-) 41 41 33 15
Angle dependence of the
tau-alpha product based on
tangent equation (-)
3.8 3.8 3.8 3.8
Heat capacity of the fluid in
the manifold tube (kJ/kgK)
3.8 3.8 3.8 3.8
Heat Pipe length (m) 1.73 1.73 1.61 1.61
Iteration stop criterion (K)
1.0E-
5
1.0E-
5
1.0E-
5
1.0E-
5
Latitude (°) 55.7 55.7 55.7 55.7
3 SOLAR COLLECTOR TECHNOLOGIES AND SYSTEMS
665
Continue
Parameters Col. 1 Col. 2 Col. 3 Col. 4
Angle of strip, β (°) 164 - 164 -
Conductivity of strip
material, λ (W/mK)
238 238 238 238
Thickness of strip, δ (m) 4.7E-4 4.7E-4 6.0E-4 6.0E-4
Density of strip, ρ (kg/m
3
) 2700 2700 2700 2700
Heat capacity of strip, c
p
(kJ/kgK)
0.896 0.896 0.896 0.896
Lowest evaporation
temperature (°C)
15 15 15 15
Manifold heat exchange
rate (W/K)
10 10 10 10
Mass of the fluid inside
the heat pipe (kg)
0.0038 0.0038 0.0038 0.0038
Specific heat capacity of
the fluid inside the heat
pipe (kJ/kgK)
4.08 4.08 4.08 4.08
All the parameters can be easily and accurately obtained
except the heat loss coefficient from the manifold pipe and
the heat loss coefficient from the absorber. The heat loss
coefficient from the absorbers depends strongly on the
weather conditions like ambient air temperature, sky
temperature and wind which can vary strongly from one
day to another, thus making it difficult to determine.
3. EXPERIMENTAL METHOD
In order to validate the two TrnSys models, a side by side
test of four heat pipe evacuated tubular collectors under
different weather conditions was carried out in an outdoor
test facility, see Fig. 3.
The collectors are directly facing south and have a tilt angle
of 67° to simulate typical operation condition in the Arctic.
A glycol/water mixture of approx. 41% is used as the
collector fluid. The inlet temperature to the collectors is the
same for all the collectors. The flow rates through the
collectors are adjusted in such a way that the average
temperatures of the collectors are approximately the same
during the tests. The measurement data are monitored and
logged every two minutes by LabView. The accuracy of the
absolute temperature and temperature difference
measurement is 0.5 K and 0.1K, respectively. The accuracy
of the flow rate measurement is estimated to be 1.5%.
Fig. 2: An illustration of the calculation models of the
investigated evacuated tubular heat pipes and inputs
to the models.
The weather data are measured at the same time by a
climate station located on the roof of a building close to the
test platform. The total and diffuse solar irradiance on
horizontal surface and ambient air temperature are
measured. The tests are reported in [8].
Fig. 3: The side by side test facility.
4. RESULTS AND DISCUSSION
4.1 Heat Loss Coefficients
The heat loss coefficient of the manifold is obtained by
measurement when there is no solar radiation. The heat loss
coefficient is calculated based on measured heat loss from
the manifold and measured difference between mean
collector fluid temperature and ambient air temperature.
Three mean collector fluid temperature levels, 43-45°C,
63-65°C and 76-78°C, were used in the experiment, see
Table 2. Five test weeks at different part of the year with
Proceedings of ISES Solar World Congress 2007: Solar Energy and Human Settlement
666
different positions of the sun were used for the experiment.
Based on the experiment, the following equation of heat
loss coefficient per meter of the manifold is determined:
()
7.97 10 0.016hTT=× −+ (W/K/m)
where T
m
is mean solar collector fluid temperature, K; T
a
is
ambient air temperature, K.
TABLE 2: MEAN COLLECTOR FLUID TEMPER-
ATURE (°C) IN FIVE TEST WEEKS
Period Col. 1 Col. 2 Col. 3 Col. 4
Week 1 Feb.22-28,2006 43.6 43.3 44.6 44.7
Week 2 May 01-07,
2006
63.2 63.2 64.2 64.8
Week 3 May 08-14,
2006
62.7 62.8 63.9 64.2
Week 4 May 29-June 4,
2006
76.2 76.3 77.2 77.7
Week 5 June 12-18,
2006
77.2 77.3 78.1 78.5
Due to the vacuum insulation of the tube, the heat loss from
the absorber will be mainly by radiation, therefore it is
assumed that the heat loss coefficient is linear to σ(T
m
2
+
T
a
2
)( T
m
+ T
a
) where σ is the Stefan-Boltzmann constant,
5.67×10
-08
W/m
2
K
4
. Since the temperature of the absorber is
difficult to measure, it is difficult to determine the heat loss
coefficient of the absorber. TrnSys simulations were carried
out to find the right heat loss coefficient of the absorber by
comparing measured thermal performances with the
calculated thermal performances with different heat loss
coefficients. The heat loss coefficients resulting in the best
fit for the five test weeks were found for all the collectors.
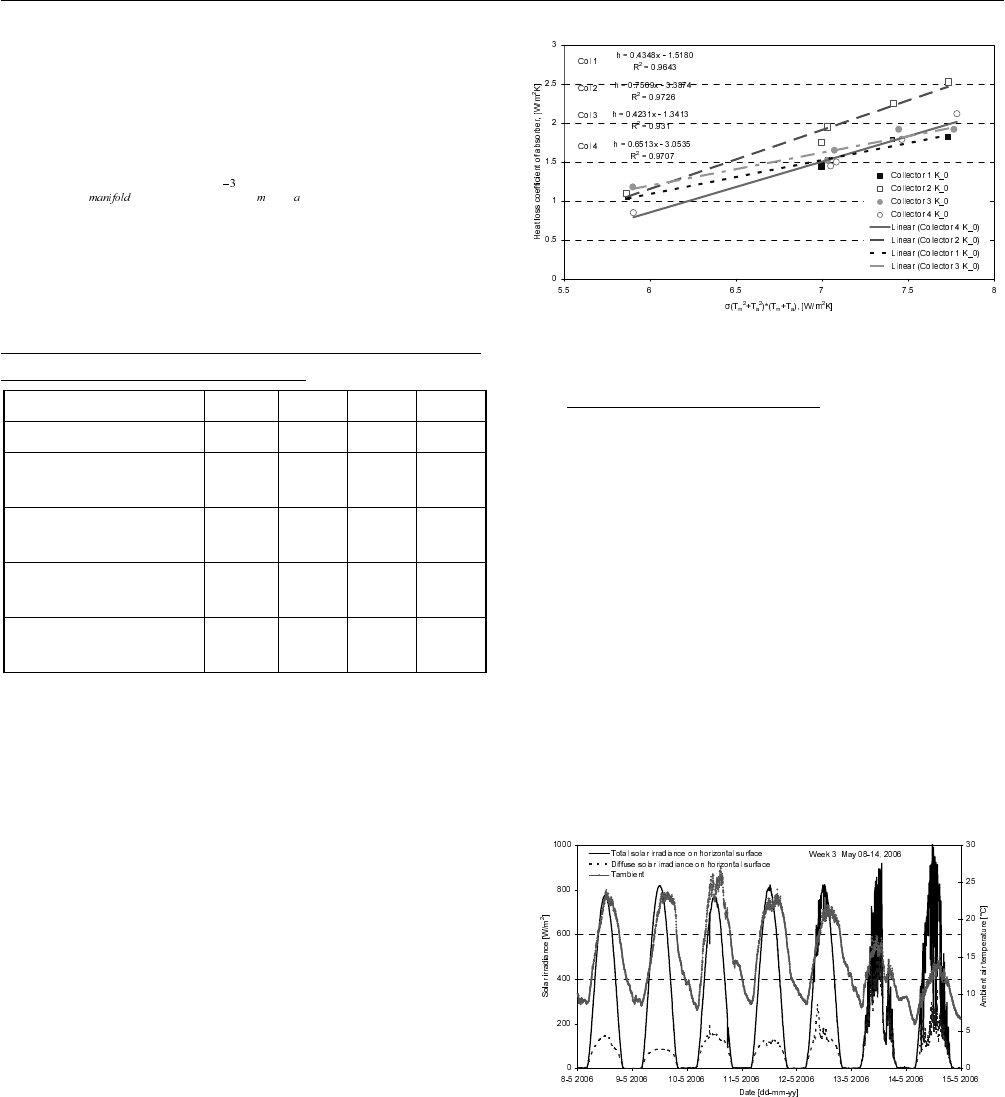
The found heat loss coefficients are shown as a function of
σ(T
m
2
+ T
a
2
)( T
m
+ T
a
) in Fig 4.
In Fig. 4 the linear regressions of the best fit of the heat loss
coefficients are shown as lines. It can be seen that the
linearity of the regression is good with R squared values in
the range of 0.93-0.97. R squared values is known as a
coefficient of determination with a value close to 1
indicating that the regression is most reliable.
Fig. 4: Heat loss coefficient of absorbers.
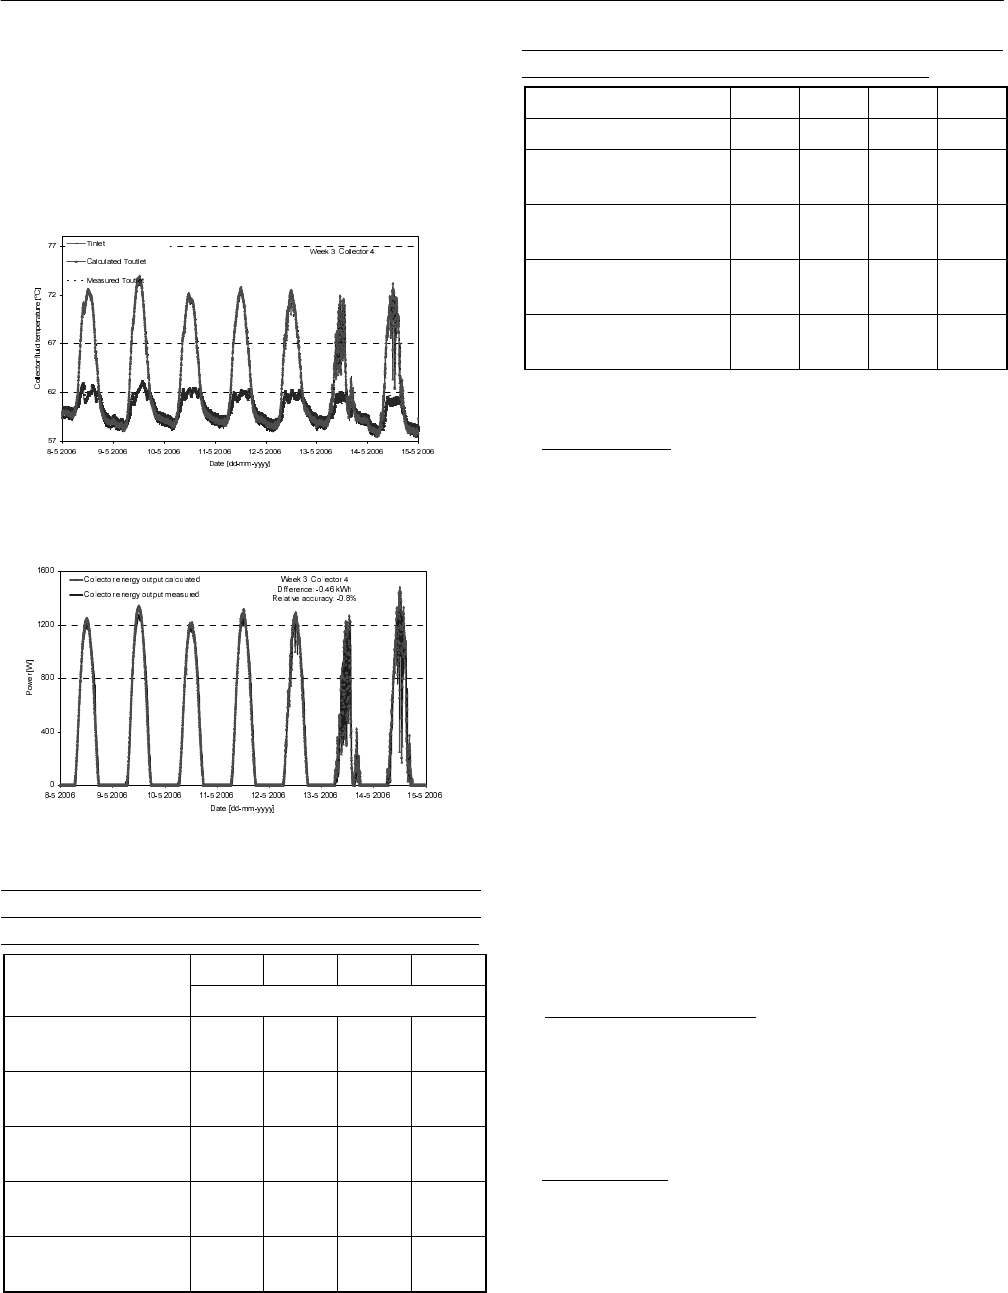
4.2 Collector Thermal Performance
The equations of heat loss coefficient obtained by
regression were validated against the measurements. For
example measurements from the period May 8 - May 15,
2006 with the weather data shown in Fig. 5 were used. The
calculated and measured outlet temperatures of collector 4
are shown in Fig. 6. The calculated and measured power of
the collector is shown in Fig. 7. It can be seen that the
TrnSys model using the heat loss coefficient determined by
the regression predicts well the outlet temperature and
power of the collector. The measured energy performance
of the week is 54.8 kWh while it is predicted to be 54.3
kWh by the model with a difference of -0.5 kWh,
corresponding to -0.8%.
Fig. 5: Weather data of week 3.
The calculated and measured energy output for all four
collectors in the five weeks are listed in Table 3. There is a
good agreement between calculated and measured energy
output with differences between calculated and measured
3 SOLAR COLLECTOR TECHNOLOGIES AND SYSTEMS
667
energy output in the range of -0.99 – 1.3 kWh. The
difference is less than 1.0 kWh except for collector 3 in
week 4. The percentage difference between calculated and
measured energy output is shown to be below 3% except
for collector 3 in week 4 which has a percentage difference
of 4.4%.
Fig. 6: The calculated and measured outlet temperature of
collector 4.
Fig. 7: The calculated and measured power of collector 4.
TABLE 3: (a)COMPARISON BETWEEN CALCULATED
AND MEASURED THERMAL PERFORMANCES
CALCULATED AND MEASURED ENERGY OUTPUT IN KWH
Col. 1 Col. 2 Col. 3 Col. 4
Collector
Calculated / measured
Week 1 Feb.22-28,
2006
12.9/
12.7
13.6/
13.6
18.1/
17.7
20.8/
20.6
Week 2 May 01-07,
2006
28.6/
29.4
28.2/
29.0
40.7/
41.7
44.1/
44.9
Week 3 May 08-14,
2006
35.9/
35.8
35.2/
35.0
51.5/
51.4
54.3/
54.8
Week 4 May 29-June
4, 2006
22.0/
21.5
21.3/
21.2
31.0/
29.7
34.1/
34.2
Week 5 June 12-18,
2006
24.8/
25.2
24.9/
24.5
35.0/
35.3
40.1/
39.5
(b) RELATIVE DIFFERENCE BETWEEN CALCULATED
AND MEASURED THERMAL PERFORMANCES
Collector Col. 1 Col. 2 Col. 3 Col. 4
Week 1 Feb.22-28,2006 1.2 % -0.1 % 1.8 % 1.3 %
Week 2 May 01-07,
2006
-2.8 % -2.5 % -2.4 % -1.6 %
Week 3 May 08-14,
2006
0.4 % 0.3 % 0.2 % -0.8 %
Week 4 May 29-June 4,
2006
2.7 % 0.4 % 4.4 % -0.1 %
Week 5 June 12-18,
2006
-1.7 % 1.5 % -0.8 % 1.7 %
5. CONCLUSION
Two new simulation models for heat pipe evacuated tubular
collectors are validated against tests with four differently
designed heat pipe evacuated collectors. The results show
that heat loss coefficient of the absorber can be calculated
as a function of σ(T
m
2
+ T
a
2
)( T
m
+ T
a
) which is obtained by
regression. The two TrnSys models using the regression
equations predict well collector outlet temperature and
collector energy performance for different periods of the
year. There is a good agreement between calculated and
measured energy output with difference between calculated
and measured energy output in the range of -0.99 – 1.3
kWh. The relative difference between calculated and
measured energy output is shown to be below 3% except
for collector 3 in week 4 which has a relative difference of
4.4%. With these validated models detailed parameter
analyses and collector design optimization are now
possible.
6.
ACKNOWLEDGMENTS
This project has been financed by VILLUM KANN
RASMUSSEN FOUNDATION.
7. REFERENCES
(1) S. A. Klein, et al. “TRNSYS 16.1, User Manual”,
University of Wisconsin, Solar Energy Laboratory,
2006.

Proceedings of ISES Solar World Congress 2007: Solar Energy and Human Settlement
668
(2) Z. Q. Yin, “Development of Solar Thermal Systems in
China”, Solar Energy Materials & Solar Cells, 86,
2005, pp. 427-442.
(3) R. Perez, R. Seals, J. Anderson, D. Menicucci,
“Calculating solar radiation received by tubular solar
energy collectors”. Proceedings of the 1995
ASME/JSME/JSES International Solar Energy
Conference, Vol. I, 1995, pp. 699-704.
(4) S. Lart, “Development of a thermal performance test
for an Integrated Collector-Storage solar water heating
system”. Ph.D. thesis. Division of Mechanical
Engineering and Energy studies. University of Wales
Cardiff, 2000, pp. 90-100.
(5) L.J. Shah, S. Furbo, “Modelling Shadows on Evacuated
Tubular Collectors with Cylindrical Absorbers”.
Journal of Solar Energy Engineering, Transactions of
the ASME, 127/3, 2005, pp 333-342.
(6) L.J. Shah, S. Furbo. “Utilization of Solar Radiation at
High Latitudes”, Proceedings NorthSun 2005, Vilnius,
Lithuania, May 25-27, 2005. ISBN 9955-9778-1-7.
(7) L.J. Shah, S. Furbo, “Theoretical investigations of
differently designed heat pipe evacuated tubular
collectors”, Proceedings of the 2005 Solar World
Congress. Orlando, USA, 2005.
(8) J. Fan, S. Furbo, ‘Side by side tests of differently
designed evacuated tubular collectors’, Solar World
Congress 2007, Beijing, China, 2007.

IONIC LIQUIDS AS DIATHERMIC FLUIDS FOR SOLAR TROUGH COLLECTORS’
TECHNOLOGY: A CORROSION STUDY
Ilaria Perissi, Stefano Caporali, Alessandro Lavacchi, Ugo Bardi, Alessio Fossati
Chemistry Department, Università di Firenze
Via della Latruccia 3
50019 Sesto Fiorentino, Italy
ilaria.perissi@unifi.it
ABSTRACT
The AISI 304 and the AISI 1018 steels, frequently used in
solar collectors’ plants, were studied in contact with some
Ionic Liquids suitable as diathermic fluids. Room
temperature steels’corrosion behaviours were investigated
by electrochemical measurements: Open Circuit Potential
curves were recorded to establish the free corrosion
potential and potentiodynamic curves were acquired to
compare the active/passive tendency of the materials. The
corrosion rates, extrapolated from Tafel Plots and by
Polarization Resistance measurements, are characterized by
low values (<2 µA cm
-2
) for both the alloys. Immersion
tests were performed at 220°C (common working
temperature in parabolic trough collectors) starting from 48
h and no appreciable weight-losses for the alloys were
observed even after 10 days of immersion. The quantity of
the metals dissolved in the ILs was detected via Inductive
Coupled Plasma Optical Emission Spectrometry. Finally,
the morphology of the corrosion phenomena were
investigated by Scanning Electron Microscopy coupled
with EDAX analysis.
1. INTRODUCTION
Ionic liquids (ILs) are a relatively new group of substances
that match many of the thermo physical and chemical
properties[1-3]
required for efficient heat transfer and
storage such as: low vapor pressure, high thermal stability,
‘green&safe properties’ (biodegradability, no toxicity and
no flammability), high thermal capacity and others. These
requirements are very challenging and are not completely
achieved by the thermal oils available on the market.
However, the use of ILs in solar thermal plants is not yet
reported. The purpose of the present work is to investigate
the behavior of some ILs, selected on the basis of their
thermal and rheological properties without and within the
contact with two alloys (carbon and stainless steel) widely
employed in the thermal circuit (piping lines, heat
exchangers).
2. EXPERIMENTAL
Material. Four ILs especially designed for high temperature
applications were supplied by Merck KGaA. They are:
1-Hexyl-3-methylimidazolium tri-(pentafluoroethyl)-trifluoro-
phosphate, HMImPF
3
(C
2
F
5
)
3
, ( T
dec
300°C, viscosity 74.30
mm
2
s
-1
at 20°C), 1-Butyl -1-methylpyrrolidinium trifluoro-
methanesulfonate, BMPyF
3
CSO
3
, (T
dec
340°C, viscosity
173.9 mm
2
s
-1
at 20°C), Ethyl-dimethyl-propyl-ammonium
- bis - (trifluoromethylsulfonyl)imide, EdMPNTf
2
N, (T
dec
320°C, viscosity 71.63 mm
2
s
-1
at 20°C), 1-Butyl-
1-methylpyrrolidinium - bis-(trifluoromethylsulfonyl)imide,
BMPyTf
2
N, ( T
dec
310°C, viscosity 71.50 mm
2
s
-1
at 20°C).
The maximum impurities present in these ILs are: chlorides
<1000 ppm and water <10000 ppm. Two kinds of steel
were tested: the AISI 1018, a carbon steel, wt% 0.14–0.20
C, 0.60–0.90 Mn, 0.035 P, 0.040 S, density 7.87 g cm
-3
from McMaster-Carr, and the AISI 304 a stainless steel, Cr

Proceedings of ISES Solar World Congress 2007: Solar Energy and Human Settlement
670
17-20%, Mn < 2%, Ni 8-11%, C < 800, density 7.93 g cm
-3
from Goodfellow.
Gravimetric measurements. Three samples from each steel
were prepared as thin disks (thickness < 0.5 mm) and their
faces grinded with SiC paper up to 1200 grit in order to
achieve a reproducible surface finishing. The samples
were weighted and then placed in 10 ml beakers, covered
with the IL and placed in an oven at 220 °C from 48 h up
to 10 days together with beakers containing 2 ml of the
net ionic liquid. After the immersion, each alloys sample
was washed with acetone, dried under air and weighted
again to calculate the weight loss, while the treated net
ionic liquids were preserved to prepare ‘blank’ solution
for ICP analysis.
Scanning Electron microscopy and EDAX analysis. The
treated samples deriving from immersion tests were
examined by SEM-EDAX using an ISI 100 B and an
acquisition software NORAN System Six 1.8 by Thermo
Electron Corporation. The acceleration voltage was 25 KV,
and the acquired peaks were fitted by Gaussian type curves
applying the Proza (Phi-Rho-Z) correction method. In order
to determine an average analysis of the surface composition,
three spots for each disk were randomly sampled.
ICP OES analysis. About 0.1 g of each ILs solutions
deriving from the high temperature immersion tests
(included solution of net ILs) were prepared for ICP
analysis adding 1 ml of ‘aqua regia’ and gently heated (80
°C) for few minutes in order to allow the complete
dissolution of the samples. The solutions obtained were
transferred in a volumetric flask (100 ml) and filled with
distilled water. The measures were performed using a Dv
OES Perkin Elmer Optima 2000 with multi elements
method. Analytical conditions were so performed: Rf
power at 1350 W; Plasma flow at 20 l min
-1
, Neb. flow at
0.80 l min
-1
; Aux 0.5 l min
-1
; view distance for axial view
was set at 15 mm and sample flow rate at 15 l min
-1
.
Electrochemical measurements. The electrochemical
investigation were carried on using a Potentiostat /
Galvanostat PARSTAT 2273, employing a small-volume
Teflon
®
cell (built in our laboratory) and the typical three
electrodes configuration. The counter and the reference
electrodes (respectively CE and RE) were constituted by
platinum wires, while the working electrodes (WE) were
constituted by the disks prepared as for the gravimetric
experiments and placed as close as possible (1mm) to the
RE in order to minimize the ohmic drop. The geometric
area exposed to solution was 50 mm
2
.
3. RESULTS
3.1 Immersion Tests and EDAX Analysis
The long term immersion test performed in open vessels
at 220°C evidenced the formation of a sort of gum layer
on the sample’s surfaces just after the 48h. This layer
results not removable by sonication and acetone rinsing.
Moreover, the colors of the ILs, independently from the
presence of metal, changed to dark brown, let to think to
the decomposition of the ILs. Even thought data presents
in literature attribute a higher decomposition temperature
for such liquids, these data are obtained via DSC or TGA,
where the material is heated for a much shorter time.
Furthermore recent studies demonstrate that the
decomposition of ILs can be catalyzed by metals
4,5
.
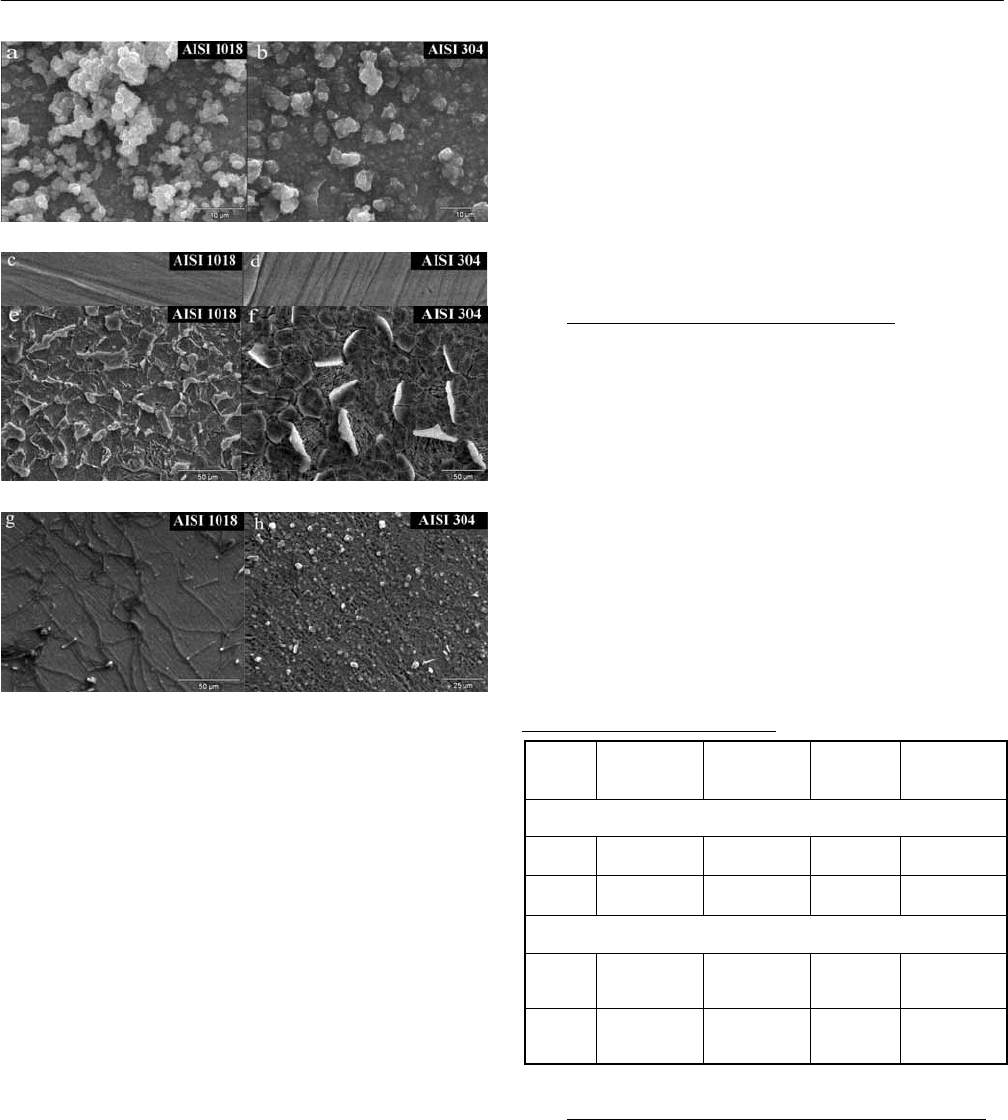
SEM images of the samples surfaces after 48h
immersion test at 220°C are shown in figure 1. The
chemical composition of the interaction layers was
determined by EDX and results constituted by C, N, O, S,
P, F and the metals constituting the alloys. In our
investigation special attention was paid to sulphur,
phosphorous and fluorine that are unambiguously deriving
from the ILs anions.
After 48 hours of immersion in BMPyTf
2
N, the quantity
of F and S on the surface of both the alloys ranges from
1% to 5%wt (Fig. 1(a) and (b)). Their atomic ratio is far
from the expected 1:3 as in the Tf
2
N ion; rather it is close
to 1:1, suggesting the breaking down of the molecule’s
structure.
The samples immersed in EdMPNTf
2
N showed no evident
contamination and the surface morphology remains
practically unchanged (Fig. 1(c) and (d)). The color of the
IL becomes just slightly yellowish. In this case the content
of F and S is near the detection limit of the technique,
providing a not substantial proof of residual absorption of
the IL on the alloys’ surfaces.
3 SOLAR COLLECTOR TECHNOLOGIES AND SYSTEMS
671
Fig. 1: SEM micrographs of the steels after 48 h
immersion test at 220°C in: (a), (b) BMPyTf
2
N; (c),
(d) EdMPNTf
2
N; (e), (f) BMPyF
3
CSO
3
; (g), (h)
HMImPF
3
(C
2
F
5
)
3.
After 10 days in the BMPyTf
2
N, the thickness of the dark
layer for both the steels becomes thicker and richer in F and
S, whose %wt now range from 10% to 25%, strengthening
the hypothesis that the IL decomposition proceeds together
with the time of exposure[6]. On the contrary, the samples
immersed in EdMPNTf
2
N show an almost constant content
of these elements even after such long time, suggesting that
this IL is quite stable in the investigated conditions.
However, corrosion features are now detectable on the
surface of both the steels (see ICP results and the
discussion chapter).
About the test in BMPyF
3
CSO
3
the EDX analysis shows
that the fluorine and the sulphur are about 1 and 5 wt%
respectively and the interaction layer appears thinner and
more fragile respect to BMPyTf
2
N (Fig. 1 e and f) for both
the steels. In accordance with previous work[7], also the
imidazolium based IL, HMImPF
3
(C
2
F
5
)
3
, degraded just
after 48h showing the color darkening and an adherent
layer was found on the sample surfaces (Fig. 1 g and h).
The fluorine content was ranging from 4 % to 12%, while
the phosphorus was found vary between 1% to 2%w.
Because of the extensive decomposition observed for
BMPyF
3
CSO
3
and HMImPF
3
(C
2
F
5
)
3
in 48h, we renounced
to extend up to 10 days the immersion tests and no further
experiments were conduct on such liquids.
3.2 ICP-OES Results And Weight Loss Tests
The solutions deriving from the 10 days immersion tests in
EdMPNTf
2
N and BMPyTf
2
N were analyzed by the
ICP-OES in order to determine their metals content (Table
1). The obtained concentrations for the metals constituting
the alloys immersed in EdMPNTf
2
N could not be
appreciated by a weight-loss test. Nevertheless, these
values are proofs of observed localized corrosion occurring
at the alloys surfaces. The values of metals dissolved (mg
per Kg of IL) in BMPyTf
2
N were not detected probably
due to the thick surface layer formed (which also provides
an average increment of the sample’s weight of about 3.5%)
which prevents the metals’ release.
TABLE 1: ICP-OES RESULTS
Alloy
Cr
(mg/Kg
IL
)
Fe
(mg/Kg
IL
)
Mn
(mg/Kg
IL
)
Ni
(mg/Kg
IL
)
EdMPNTf
2
N
304 54.7 181.7 - 30.1
1018 - 260.9 5.2 -
BMPyTf
2
N
304
Not
detected
Not
detected
-
Not
detected
1018 -
Not
detected
Not
detected
-
3.3 Room Temperature ElectrocheMistry Measurements
According to the previous experiments EdMPNTf
2
N
resulted the most performing IL, thus we decide to continue
with the electrochemistry investigation only on such liquid.
Open Circuit Voltage curves. The free corrosion potential