Watts J.F., Wolstenholme J. An Introduction to Surface Analysis by XPS and AES
Подождите немного. Документ загружается.

ANGLE
RESOLVED
XPS $7
To
obtain ARXPS data
the
angular acceptance
of the
transfer lens
is
set
to
provide good angular resolution,
usually
the
half angle
is set to
be
in the
region
of 1° to 3°. A
series
of
spectra
is
then acquired
as the
sample
surface
is
tilted with respect
to the
lens axis. Figure 2.19
illus-
trates
how the
spectra might appear
at
each
end of the
angular range
if
the
sample
consists
of a
thin oxide layer
on a
metal substrate.
Note
that
the
relative intensity
of the
oxide peak
is
larger
at the
near grazing
emission angle.
ARXPS
measurements such
as
this
can
provide information about
the
thickness
and
chemical composition
of
thin surface layers,
as
will
be
illustrated
in a
later chapter.
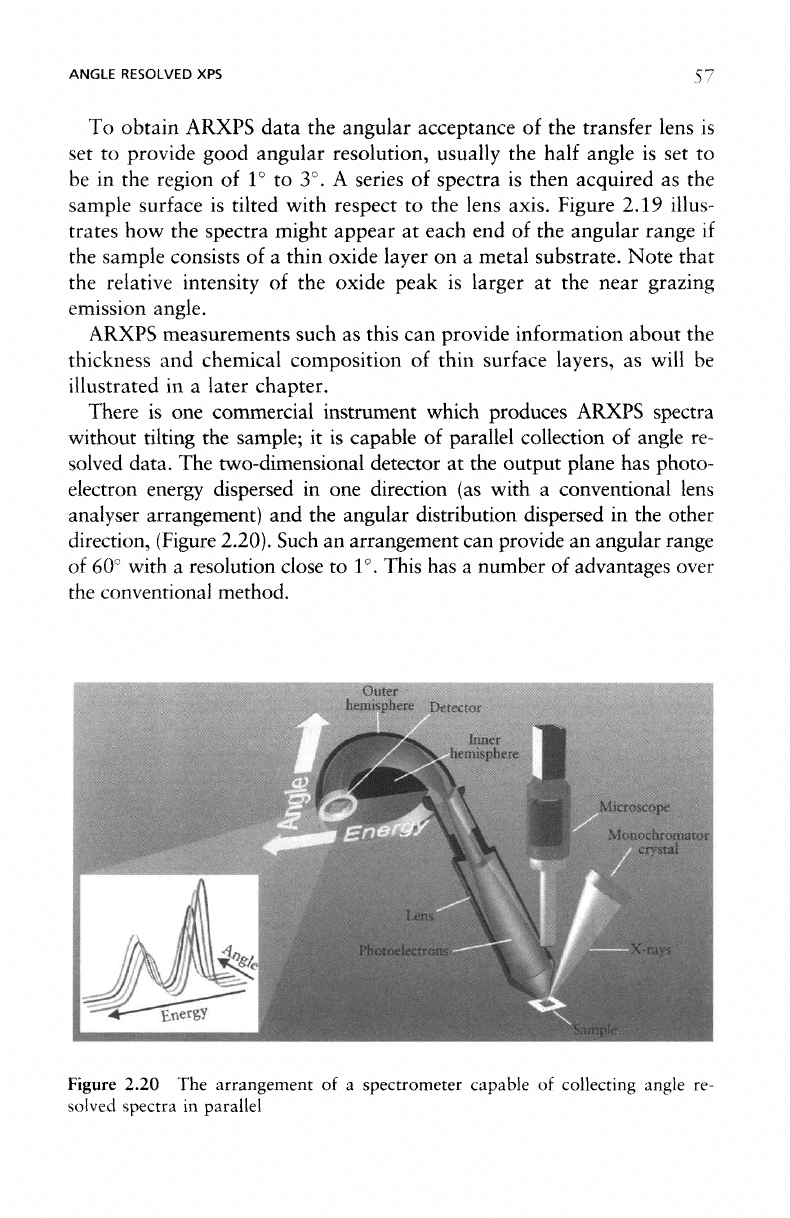
There
is one
commercial instrument which produces ARXPS spectra
without tilting
the
sample;
it is
capable
of
parallel collection
of
angle
re-
solved data.
The
two-dimensional detector
at the
output plane
has
photo-
electron energy dispersed
in one
direction
(as
with
a
conventional lens
analyser
arrangement)
and the
angular distribution dispersed
in the
other
direction,
(Figure
2.20). Such
an
arrangement
can
provide
an
angular range
of
60°
with
a
resolution close
to 1°.
This
has a
number
of
advantages over
the
conventional
method.
Figure
2.20
The
arrangement
of a
spectrometer capable
of
collecting angle
re-
solved
spectra
in
parallel
58
ELECTRON SPECTROMETER DESIGN
•
ARXPS measurements
can be
taken
from
very large samples, such
as
complete semiconductor wafers. Such samples
are too
large
to be
tilted inside
an XPS
spectrometer.
• The
analysis
position
remains constant throughout
the
angular range.
When combining small area
XPS and
ARXPS
it is
difficult
to
ensure
that
the
analysis point remains
fixed
during
the
experiment especially
if
that
point
is
remote
from
the
tilt axis even with
a
eucentric stage.
Since
the
sample
does
not
move during parallel collection,
the
analysis
position remains constant.
• The
analysis area remains constant during
the
analysis.
If
lens-defined
small area
XPS is
combined with ARXPS then
the
analysis area would
increase
by a
large factor
as the
sample
is
tilted away
from
its
normal
position. Using
a
combination
of
source-defined
small
area analysis
and
parallel collection
the
analysis area becomes independent
of
angle.
The use of
ARXPS
as a
non-destructive method
for
near-surface
depth
profiling
of
samples will
be
discussed
further
in
Chapter
4.
The
product
of the
electron spectrometer
is
amenable
to
many
levels
of
interpretation, ranging
from
a
simple qualitative assessment
of the
elements
present
to a
full-blown
quantitative analysis complete with
assignments
of
chemical states,
and
determination
of the
phase distri-
bution
for
each element.
In
practice,
a
happy medium
is
usually required
with
an
estimation
made
of the
relative amounts
of
each element pres-
ent. There
are
certain similarities
in the way
that
AES and XPS
spectra
are
treated.
We
shall initially consider them together
as
this also pro-
vides
a
means
of
comparing
the
analytical capabilities
of the two
methods.
3.1
Qualitative
Analysis
The first
step
to be
taken
in
characterizing
the
surface
chemistry
of the
specimen under investigation
is the
identification
of the
elements
present.
To
achieve this
it is
usual
to
record
a
survey,
or
wide scan,
spectrum over
a
region that will provide
fairly
strong peaks
for all
ele-
ments
in the
periodic table.
In the
case
of
both
XPS and
AES,
a
range
of
0-1000
eV is
often
sufficient.
The
current IUVSTA
4
recommendations
IUVSTA
is the
International Union
for
Vacuum Science, Technique
and
Applications.
3
The Electron Spectrum:
Qualitative and
Qualitiative Interpretation
60
INTERPRETATION
OF THE
ELECTRON
SPECTRUM
Table
3.1
IUVSTA recommended conditions
for
the
acquisition
of a
survey spectrum
Energy
range (eV)
Energy
step
size
(eV)
MgKa
0-1150
0.4
AlKa
0-1350
0.4
for
the
acquisition
of XPS
survey spectra extend this range,
as
shown
in
Table 3.1.
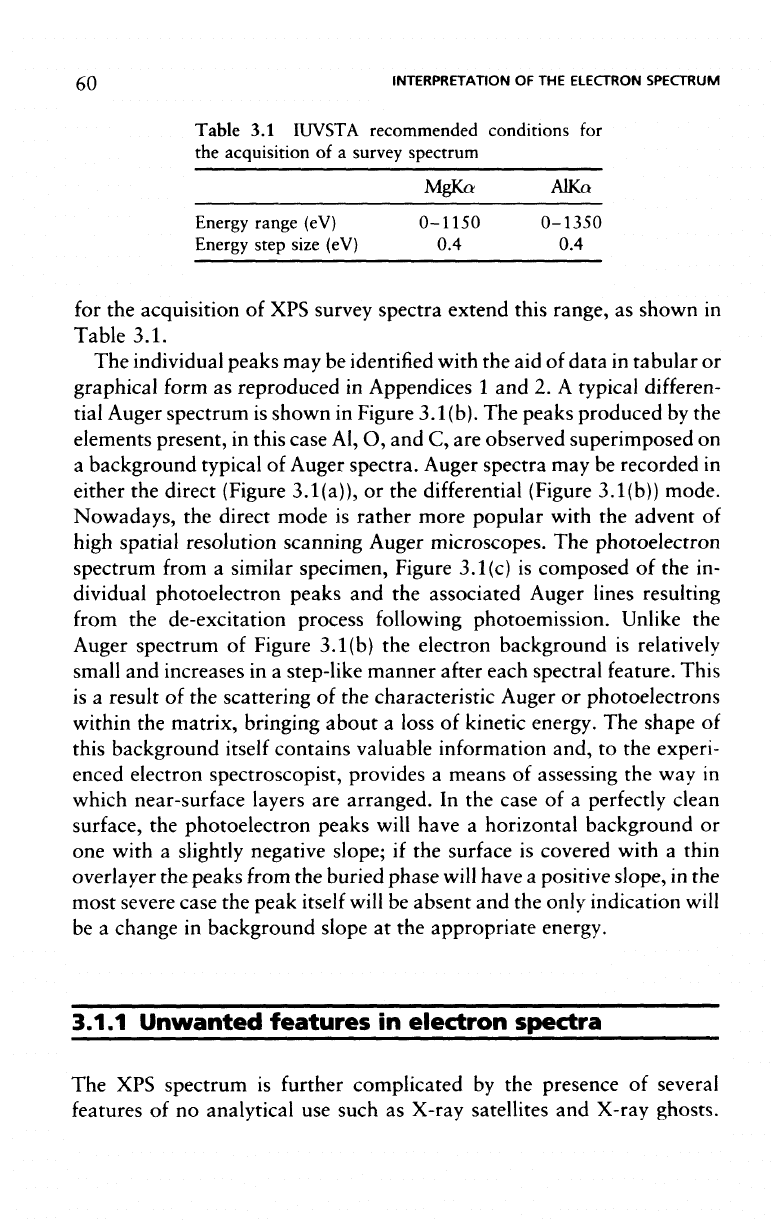
The
individual peaks
may be
identified
with
the aid of
data
in
tabular
or
graphical form
as
reproduced
in
Appendices
1 and 2. A
typical
differen-
tial Auger spectrum
is
shown
in
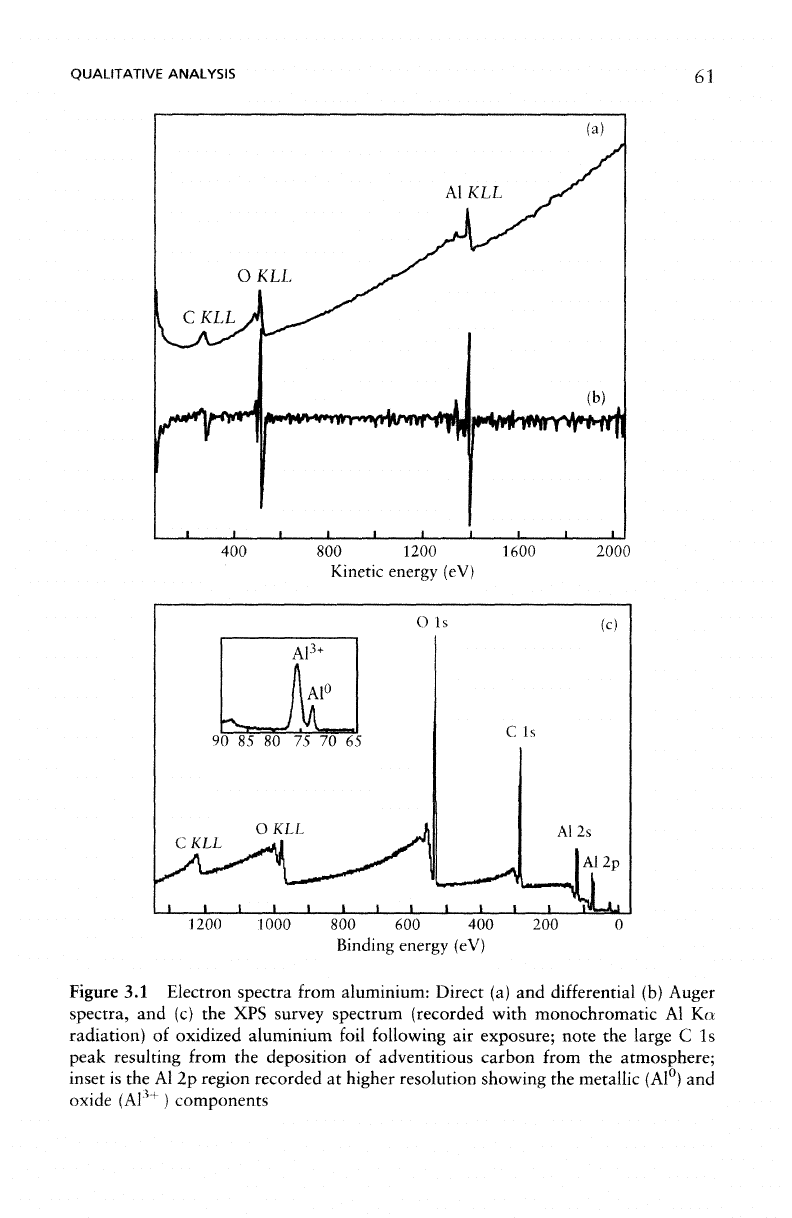
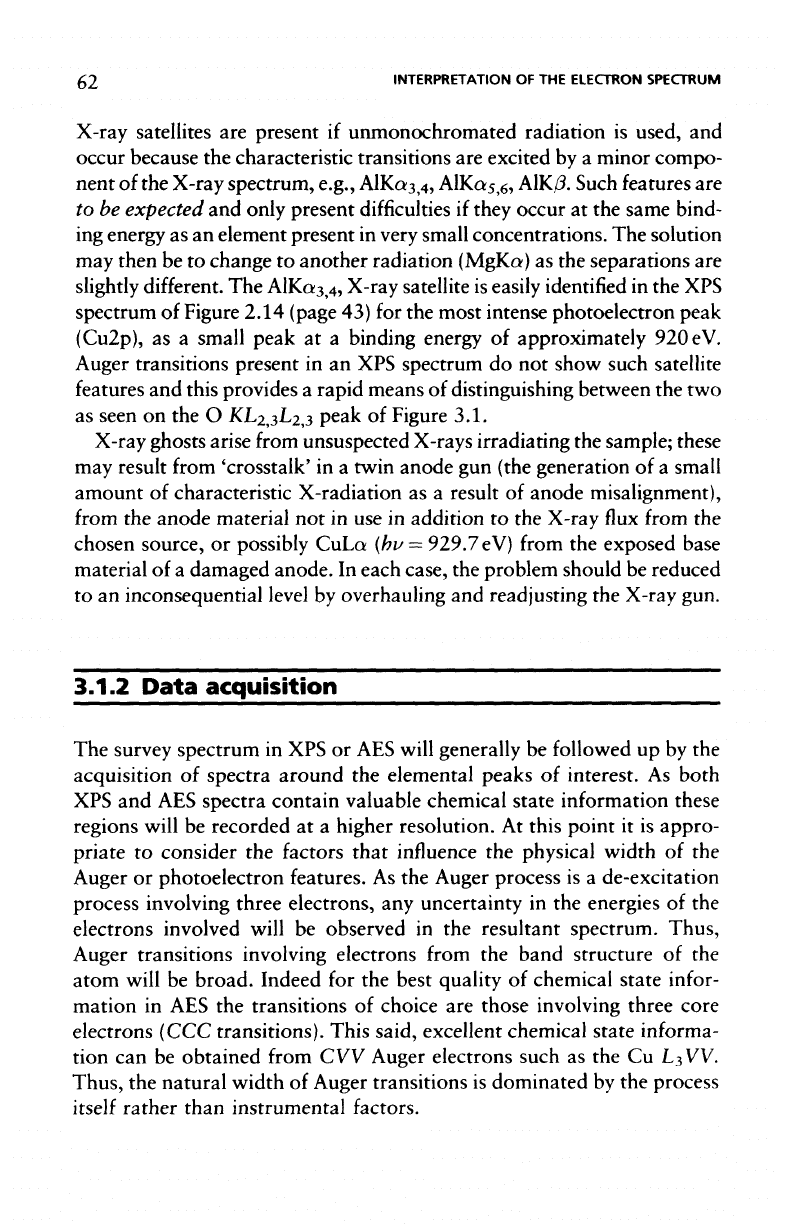
Figure 3.1(b).
The
peaks produced
by the
elements
present,
in
this case
Al, O, and C, are
observed superimposed
on
a
background typical
of
Auger spectra. Auger spectra
may be
recorded
in
either
the
direct (Figure 3.1(a)),
or the
differential
(Figure
3.1(b))
mode.
Nowadays,
the
direct mode
is
rather more popular with
the
advent
of
high
spatial resolution scanning Auger microscopes.
The
photoelectron
spectrum from
a
similar specimen, Figure 3.1(c)
is
composed
of the in-
dividual
photoelectron peaks
and the
associated Auger
lines
resulting
from
the
de-excitation process following photoemission.
Unlike
the
Auger
spectrum
of
Figure 3.1(b)
the
electron background
is
relatively
small
and
increases
in a
step-like manner
after
each spectral feature. This
is
a
result
of the
scattering
of the
characteristic Auger
or
photoelectrons
within
the
matrix, bringing about
a
loss
of
kinetic energy.
The
shape
of
this
background
itself
contains valuable information and,
to the
experi-
enced
electron spectroscopist, provides
a
means
of
assessing
the way in
which
near-surface
layers
are
arranged.
In the
case
of a
perfectly
clean
surface,
the
photoelectron peaks
will
have
a
horizontal background
or
one
with
a
slightly negative
slope;
if the
surface
is
covered with
a
thin
overlayer
the
peaks from
the
buried phase
will
have
a
positive
slope,
in the
most
severe case
the
peak itself will
be
absent
and the
only indication
will
be
a
change
in
background slope
at the
appropriate energy.
3.1.1
Unwanted
features
in
electron
spectra
The XPS
spectrum
is
further
complicated
by the
presence
of
several
features
of no
analytical
use
such
as
X-ray satellites
and
X-ray ghosts.
QUALITATIVE
ANALYSIS
61
400 800
1200 1600
Kinetic
energy (eV)
2000
O 1s
90
85 80 75 70 65
CKLL
OKLL
C Is
A12s
1200
1000
800 600 400
Binding
energy
(eV)
200
Figure
3.1
Electron spectra from aluminium: Direct
(a) and
differential
(b)
Auger
spectra,
and (c) the XPS
survey spectrum (recorded with
monochromatic
Al Ka
radiation)
of
oxidized aluminium foil following
air
exposure;
note
the
large
C 1s
peak resulting from
the
deposition
of
adventitious carbon from
the
atmosphere;
inset
is the Al 2p
region recorded
at
higher resolution showing
the
metallic (Al°)
and
oxide
(A1
3+
)
components
62
INTERPRETATION
OF THE
ELECTRON
SPECTRUM
X-ray
satellites
are
present
if
unmonochromated radiation
is
used,
and
occur because
the
characteristic transitions
are
excited
by a
minor compo-
nent
of the
X-ray
spectrum,
e.g.,
AlKa
3,4,
AlKa^
5,6,
A1K/3.
Such features
are
to be
expected
and
only present
difficulties
if
they occur
at the
same bind-
ing
energy
as an
element present
in
very small concentrations.
The
solution
may
then
be to
change
to
another radiation
(MgKc*)
as the
separations
are
slightly different.
The
AlKa
3,4
X-ray satellite
is
easily identified
in the XPS
spectrum
of
Figure 2.14 (page
43) for the
most intense photoelectron peak
(Gu2p),
as a
small peak
at a
binding energy
of
approximately
920 eV.
Auger
transitions
present
in an XPS
spectrum
do not
show such satellite
features
and
this provides
a
rapid means
of
distinguishing between
the two
as
seen
on the O
KL
2,3
L
2,3
peak
of
Figure 3.1.
X-ray
ghosts
arise
from
unsuspected X-rays irradiating
the
sample; these
may
result
from
'crosstalk'
in a
twin anode
gun
(the generation
of a
small
amount
of
characteristic X-radiation
as a
result
of
anode misalignment),
from
the
anode material
not in use in
addition
to the
X-ray
flux
from
the
chosen source,
or
possibly CuLa
(bv
—
929.7
eV)
from
the
exposed base
material
of a
damaged anode.
In
each case,
the
problem should
be
reduced
to an
inconsequential level
by
overhauling
and
readjusting
the
X-ray gun.
3.1.2
Data
acquisition
The
survey spectrum
in XPS or AES
will
generally
be
followed
up by the
acquisition
of
spectra around
the
elemental peaks
of
interest.
As
both
XPS and AES
spectra contain valuable chemical state information these
regions will
be
recorded
at a
higher resolution.
At
this point
it is
appro-
priate
to
consider
the
factors
that
influence
the
physical width
of the
Auger
or
photoelectron features.
As the
Auger
process
is a
de-excitation
process involving three electrons,
any
uncertainty
in the
energies
of the
electrons involved will
be
observed
in the
resultant spectrum. Thus,
Auger
transitions involving electrons
from
the
band structure
of the
atom will
be
broad. Indeed
for the
best quality
of
chemical state
infor-
mation
in AES the
transitions
of
choice
are
those involving three core
electrons (CCC transitions). This said, excellent chemical
state
informa-
tion
can be
obtained
from
CVV
Auger electrons such
as the Cu
L
3
VV.
Thus,
the
natural width
of
Auger transitions
is
dominated
by the
process
itself
rather than instrumental factors.

QUALITATIVE ANALYSIS
63
In
XPS,
the
natural line width
is
very small, although
it can
influence
the
shape
of the
spectrum when recorded
at
very high resolution.
To
obtain high-quality core level spectra,
a
monochromated AlKa source
is
used which provides
an
X-ray line width
of
0.25
eV in the
best cases
(cf.
0.7 for
MgKa
and
0.9eV
for
AlKa,
from achromatic sources).
The
narrowness
of the
monochromated
source
is
combined with
a
very high-
resolution mode
for the
concentric hemispherical analyser (CAE mode
at,
typically,
5 or 10 eV
pass energy). This enables
fine
structure
in the
core level
spectra
to be
seen
and the
rapid increase
in the use of
mono-
chromatic sources
in the
early
1990s
led to a
step
change
in the
level
of
information attainable from
core
level
spectra
in
XPS, particularly
for
the
analysis
of
polymers.
The
complexity
of
core level
XPS
spectra
recorded
at
high resolution
has
seen
a
parallel growth
in the
level
of
sophistication
of
peak
fitting
routines
to
enable
the
analyst
to
assign
the
various components
of a
convoluted spectrum with
a
degree
of
confi-
dence. Important parameters
in
such analysis include:
the
number
of
components,
the
shape
of the
peak
(usually
a
Voight function), degree
of
asymmetry (important
in
metals which
are
asymmetric
as a
result
of
core hole
lifetime
effects),
the
width
of the
components (constrained
together
or
allowed
to
vary),
and the
shape
of the
background which
will
be
influenced
by
both elastic
and
inelastic scattering
of the
elec-
trons.
The
source
and use of
chemical state information
in
both
XPS and
AES
is
discussed
in
detail
in
Section 3.2.
The
above discussion relates
to
core
level
XPS
peaks
but
important
information
is
contained
in the
valence band region, which
in
practice
extends
from
the
Fermi
level
up to a
binding energy
of 30 eV.
This
region
of the XPS
spectrum
is
very weak,
as can be
seen
from
any
survey
spectrum,
a
problem that
is
overcome nowadays with
the use of
high
intensity
monochromatic sources
and
high transmission analysers.
However,
it has
been used
as a fingerprint
region
of the
spectrum since
the
very
early days
of
XPS.
It has the
advantage that specimens that
give
very
similar,
or
identical, core level spectra
can be
distinguished
by
examination
of the
valence band. This
is
seen
in the
valence band
regions
for
diamond, graphite
and
polyethylene
-
clear
differences
can
be
seen, unlike
the C 1s
spectra which
are
very similar.
The
restrictions
on the use of
X-rays
for
probing
the
valence band
are the
poor
cross-
sections
and the
line width
of the
source. Both
can be
overcome
by
turning
to
lower energy
photons
such
as
HeI,
Hell,
Nel or
Nell
(with
photon energies
of
21.2
eV,
40.8eV,
16.8eV,
and
26.9eV
respectively)
64
INTERPRETATION
OF THE
ELECTRON
SPECTRUM
which
provide
line
widths
in the
region
of 100
meV. This
form
of
photo-
emission
is
known
as
ultraviolet
photoelectron
spectroscopy
(UPS).
Unlike
XPS,
this
is a
molecular spectroscopy which provides
no
direct
elemental
information.
3.2
Chemical
State
Information
3.2.1
X-ray
photoelectron
spectroscopy
Long before
XPS had
developed into
a
commercially available method
for
surface
analysis
it was
clear that
the
spectra produced
as a
conse-
quence
of
X-irradiation exhibited small changes
in
electron energy that
were
a
result
of the
chemical environment
of the
emitting
atom,
ion or
molecule. This
led Kai
Siegbahn
to
coin
the
name Electron Spectroscopy
for
Chemical Analysis
(ESCA),
a
term which
is no
longer
in
favour
as a
formal description
of the
technique
but one
which
is
still
widely
used colloquially
and in the
model names
of
various commercial
spectrometers.
The XPS
chemical
shift
is the
cornerstone
of the
tech-
nique
and the
reason high-resolution analysers
and
accurate calibration
of
energy scales were seen
in XPS
long before
it was
considered
a
necessity
in
AES.
Almost
all
elements
in the
periodic table exhibit
a
chemical
shift,
which
can
vary from
a
fraction
of an
electron volt
up to
several
eVs.
Set
alongside
the
line width
of the
X-ray sources used
in XPS
(0.25–0.9
eV) it is
clear
why
some form
of
data processing
is
often
required
to
extract
the
maximum level
of
information
from
a
spectrum.
The
computer curve
fitting
of
high-resolution
XPS
spectra
is now a
routine undertaking,
as
indicated above,
and
international standards
are now
being drafted
to
provide
a
unified
framework within which
such
procedures
can be
undertaken.
The
shifts
observed
in XPS
have their origin
in
either initial-state
or
final-state
effects.
In the
case
of
initial-state
effects,
it is the
charge
on
the
atom prior
to
photoemission that plays
the
major
role
in the
deter-
mination
of the
magnitude
of the
chemical
shift.
For
example,
the C-O
bond
in an
organic polymer
is
shifted
1.6eV relative
to the
unfunctio-
nalized
(methylene)
carbon, while
C—O and
O-C-O
are
both
shifted
CHEMICAL
STATE
INFORMATION
65
by
2.9 eV. In
essence,
the
more bonds
with
electronegative atoms that
are
in
place,
the
greater
the
positive
XPS
chemical shift. This
is
illus-
trated
in a
striking manner
for
fluoro-carbon species,
the C 1s
chemical
shifts
being larger than those
of
carbon-oxygen compounds
as
fluorine
is
a
more electronegative element.
The C-F
group
is
shifted
by 2.9 eV
whilst
CF
2
and CF
3
functionalities
are
shifted
by
5.9eV
and
7.7eV
respectively.
Unfortunately, such examples
of the
chemical
shift
are
unusually
large
and,
in
general, values
of
l-3eV
are
encountered.
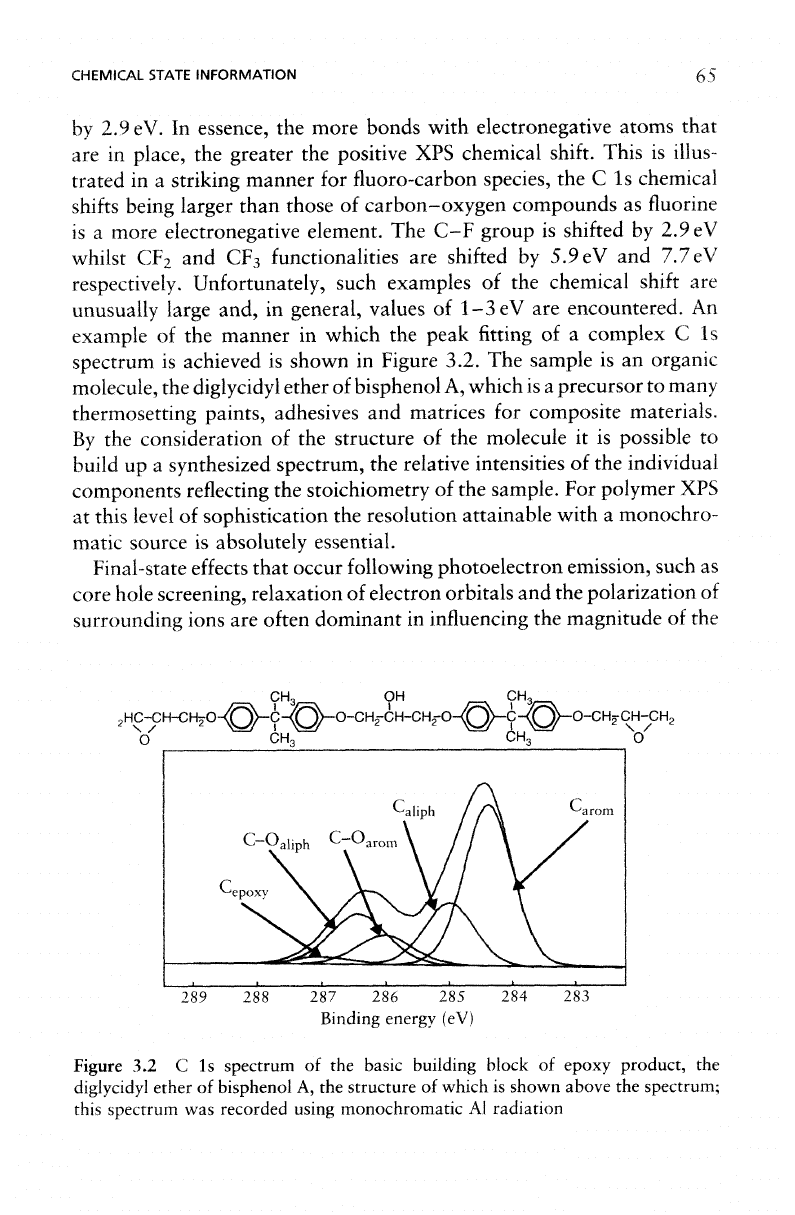
An
example
of the
manner
in
which
the
peak
fitting
of a
complex
C 1s
spectrum
is
achieved
is
shown
in
Figure
3.2.
The
sample
is an
organic
molecule,
the
diglycidyl
ether
of
bisphenol
A,
which
is a
precursor
to
many
thermosetting
paints, adhesives
and
matrices
for
composite materials.
By
the
consideration
of the
structure
of the
molecule
it is
possible
to
build
up a
synthesized spectrum,
the
relative intensities
of the
individual
components reflecting
the
stoichiometry
of the
sample.
For
polymer
XPS
at
this level
of
sophistication
the
resolution attainable with
a
monochro-
matic
source
is
absolutely essential.
Final-state
effects
that
occur following
photoelectron
emission, such
as
core
hole screening, relaxation
of
electron orbitals
and the
polarization
of
surrounding
ions
are
often
dominant
in
influencing
the
magnitude
of the
.HC-CH-CHjO
i
\ / *
O
CH
3
OH
-C-0})-O-CH
2
-CH-CH
2
-O-
CH,
O-CHp-CH-CHo
V
289
288 287 286 285 284
Binding
energy
(eV)
283
Figure
3.2 C Is
spectrum
of the
basic
building
block
of
epoxy product,
the
diglycidyl
ether
of
bisphenol
A, the
structure
of
which
is
shown above
the
spectrum;
this
spectrum
was
recorded
using
monochromatic
Al
radiation
66
INTERPRETATION
OF THE
ELECTRON SPECTRUM
chemical
shift.
In
most metals there
is a
positive
shift
between
the
elemen-
tal
form
and
mono-,
di- or
trivalent ions
but in the
case
of
cerium
the
very
large
final-state
effects
give rise
to a
negative chemical
shift
of
about
2 eV
between
Ce and
CeCO
2
. This
is,
however,
the
exception
and
most elements
behave
in a
predictable manner.
There
are
various compilations
of
binding energies
and the
most
ex-
tensive
is
that
promulgated
by the
National Institute
of
Standards
and
Technology,
USA
(NIST) which
is
available
free
of
charge over
the
internet
(http://srdata.nist.gov/xps/index.htm).
This provides
a
ready
source
of
standard data with which
the
individual components
of a
spectrum
can be
assigned with
a
high degree
of
confidence.
3.2.2
Electron
induced
Auger
electron
spectroscopy
Historically, electron induced
AES is not
credited with
the
ability
to
yield chemical
state
information. Early examples
of
chemical
effects
in
Auger
spectroscopy
were usually
in
quasi-atomic spectra excited
by X-
rays.
The
reason
for
this neglect
of
chemical
effects
is
twofold.
The
thrust
in the
early development
of AES was the use of
analysers, such
as the
retarding
field or the
cylindrical
mirror analyser, which provided
a
high
level
of
transmission
but at the
expense
of
spectral resolution.
Thus,
the
peaks
from
early Auger spectrometers were very broad
and
superimposed
on a
very intense electron background. This
led to the
practice
of
using phase-sensitive detection
to
acquire
differential
spectra.
Even
if
there were well-defined, chemical information
in the
spectra,
the
practices used
for
spectral acquisition would have
effectively
obliterated
it! The
other reason
is the
superposition
of the
degenerate band struc-
ture
onto
the
shape
of the
Auger peak
in the
case
of WV and CVV
transitions. This
may
lead
to
changes
in
shape
of
Auger transitions
from
different
chemical environments but, generally,
not the
discrete chemical
shift
that
is
observed
in XPS
core levels.
If the two
outer electrons
are
not
valence electrons
(i.e.,
CCC
Auger transitions)
a
sharp peak
may
result
as
observed
for
example
in the KLL
series
of
peaks
of
aluminium
and
silicon,
and the LMM
series
of
copper,
zinc, gallium, germanium,
and
arsenic.
The Ge LMM
Auger spectrum
of
Figure
3.3
show compo-
nents
attributable
to Ge° and
Ge
44+
separated
by
over
8 eV.