Watts J.F., Wolstenholme J. An Introduction to Surface Analysis by XPS and AES
Подождите немного. Документ загружается.

QUANTITATIVE
ANALYSIS
77
and
also
the
composition
of the
specimen.
It is the
latter,
matrix,
effect
that
has
prevented
the
production
of a
series
of AES
sensitivity factors
of
the
type widely used
for
XPS. Instead,
it is
necessary
to
fabricate
binary
or
ternary alloys
and
compounds
of the
type under investigation
to
provide calibration
by
means
of a
similar Auger spectrum; however,
the
sensitivity factors produced have
a
narrow range
of
applicability.
In
this manner,
it is
possible
to
determine
the
concentration
of an
element
of
interest (NA)
as
follows:
N
A
=
/A/(/A
+
^AB/B
+
fAC/C
+ - • -)
where
/ is the
measured intensity
of the
element represented
by the
subscript,
and F is the
sensitivity factor determined
from
the
binary
standard such that:
FAB
=
(/A/#A)/(/B/;VB)
Various semi-quantitative methods
are
employed
by
laboratories
throughout
the
world which relate
a
measured Auger electron intensity
to
that
of a
standard material under
the
same experimental conditions;
this seems
to be a
fairly
satisfactory approach where
the
time
and ex-
pense
of
producing
the
relevant standard specimens
is not
warranted.
Although
a
surface analytical study
may be an end in
itself, knowl-
edge
of the
concentration
of
elements near
to the
surface
is
often
re-
quired.
To
achieve
this,
some form
of
compositional
depth
profiling
is
required,
either
by
destructive
or
non-destructive means
and
this
adds
another degree
of
complexity
to the
interpretation
of the
resultant spec-
tra,
as we
shall
see
later.

This page intentionally left blank
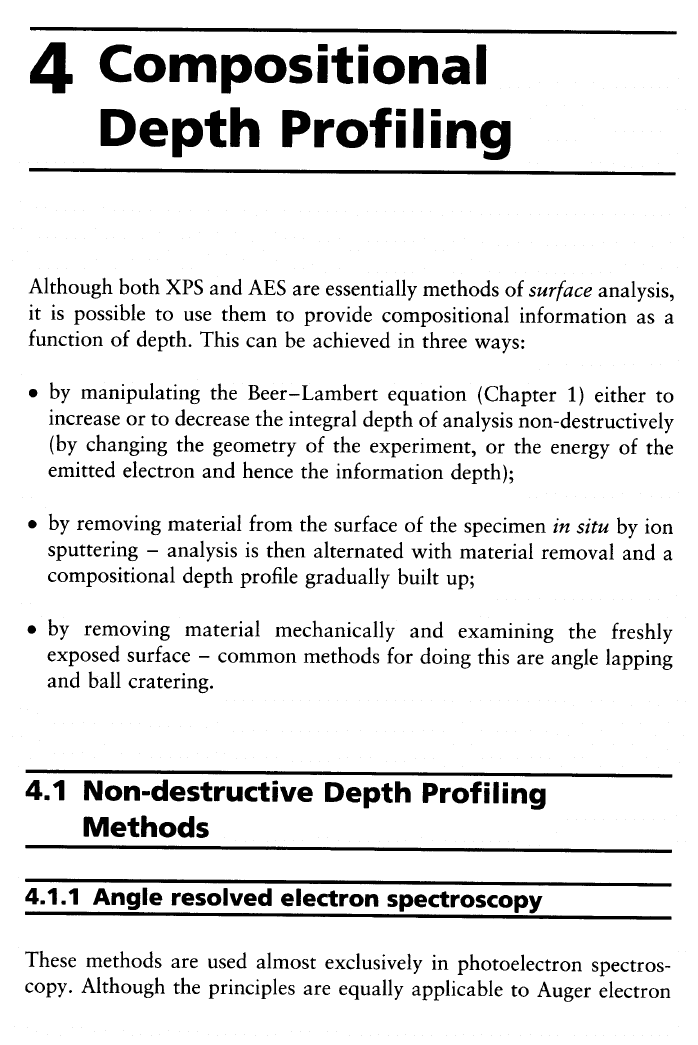
4
Compositional
Depth
Profiling
Although both
XPS and AES are
essentially methods
of
surface
analysis,
it
is
possible
to use
them
to
provide compositional information
as a
function
of
depth. This
can be
achieved
in
three ways:
• by
manipulating
the
Beer-Lambert
equation (Chapter
1)
either
to
increase
or to
decrease
the
integral depth
of
analysis non-destructively
(by
changing
the
geometry
of the
experiment,
or the
energy
of the
emitted electron
and
hence
the
information depth);
• by
removing material
from
the
surface
of the
specimen
in
situ
by ion
sputtering
-
analysis
is
then alternated with material removal
and a
compositional
depth
profile
gradually
built
up;
• by
removing material mechanically
and
examining
the
freshly
exposed
surface
-
common methods
for
doing this
are
angle lapping
and
ball
cratering.
4.1
Non-destructive
Depth
Profiling
Methods
4.1.1
Angle
resolved
electron
spectroscopy
These methods
are
used almost exclusively
in
photoelectron
spectros-
copy. Although
the
principles
are
equally applicable
to
Auger electron
80
COMPOSITIONAL
DEPTH PROFILING
analysis,
the
results obtained with
the
high lateral resolution employed
in
AES and SAM
mean
that
such changes
in
analysis depth occur
in the
analysis
of
parts
of the
specimen
with
different
orientations
to the
elec-
tron
analyser (because
of
specimen surface roughness). Such effects tend
to be
regarded
as
experimental artefacts
to be
circumvented
by the
Auger
microscopist,
and
have only recently become
the
subject
of
rig-
orous
scientific investigation.
If
we
consider
the
Beer-Lambert equation, discussed
in
Chapter
1, it
is
clear that
the
depth
of
analysis
is
dependent
on the
electron angle
of
emission,
9
s
. By
recording spectra with
good
angular resolution
at a
high value
of #, say 75°
(relative
to the
sample normal),
an
analysis
is
recorded which
is
extremely surface sensitive.
As
normal electron emis-
sion
is
approached
(0 = 0°) so the
analysis depth moves towards
the
limiting value
of
~3A. This value
is
often referred
to as the XPS
analysis
depth although
it is, of
course, more correctly described
by 3
A
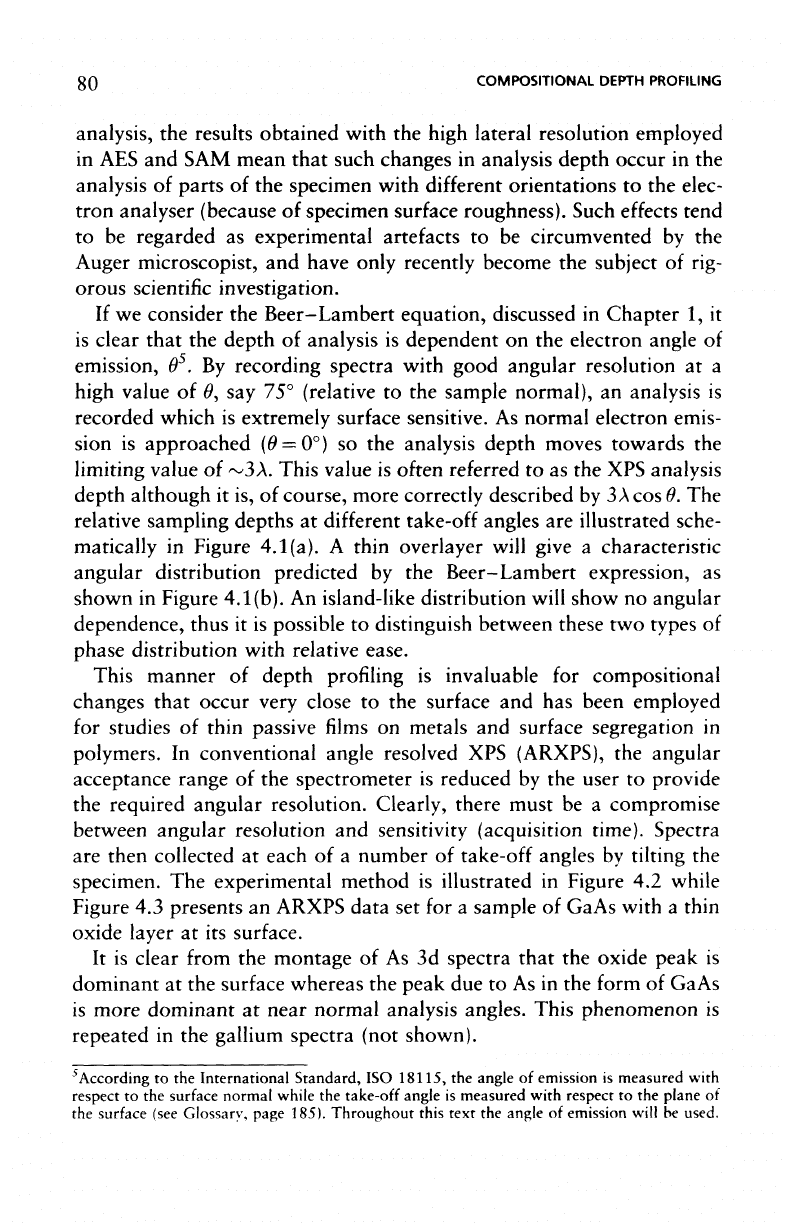
cos 6. The
relative
sampling depths
at
different
take-off
angles
are
illustrated
sche-
matically
in
Figure
4.1
(a).
A
thin overlayer will give
a
characteristic
angular distribution predicted
by the
Beer-Lambert expression,
as
shown
in
Figure 4.1(b).
An
island-like distribution
will
show
no
angular
dependence, thus
it is
possible
to
distinguish between these
two
types
of
phase distribution with relative ease.
This manner
of
depth
profiling
is
invaluable
for
compositional
changes that occur very close
to the
surface
and has
been employed
for
studies
of
thin passive
films on
metals
and
surface segregation
in
polymers.
In
conventional angle resolved
XPS
(ARXPS),
the
angular
acceptance range
of the
spectrometer
is
reduced
by the
user
to
provide
the
required angular resolution. Clearly, there must
be a
compromise
between angular resolution
and
sensitivity (acquisition time). Spectra
are
then collected
at
each
of a
number
of
take-off
angles
by
tilting
the
specimen.
The
experimental method
is
illustrated
in
Figure
4.2
while
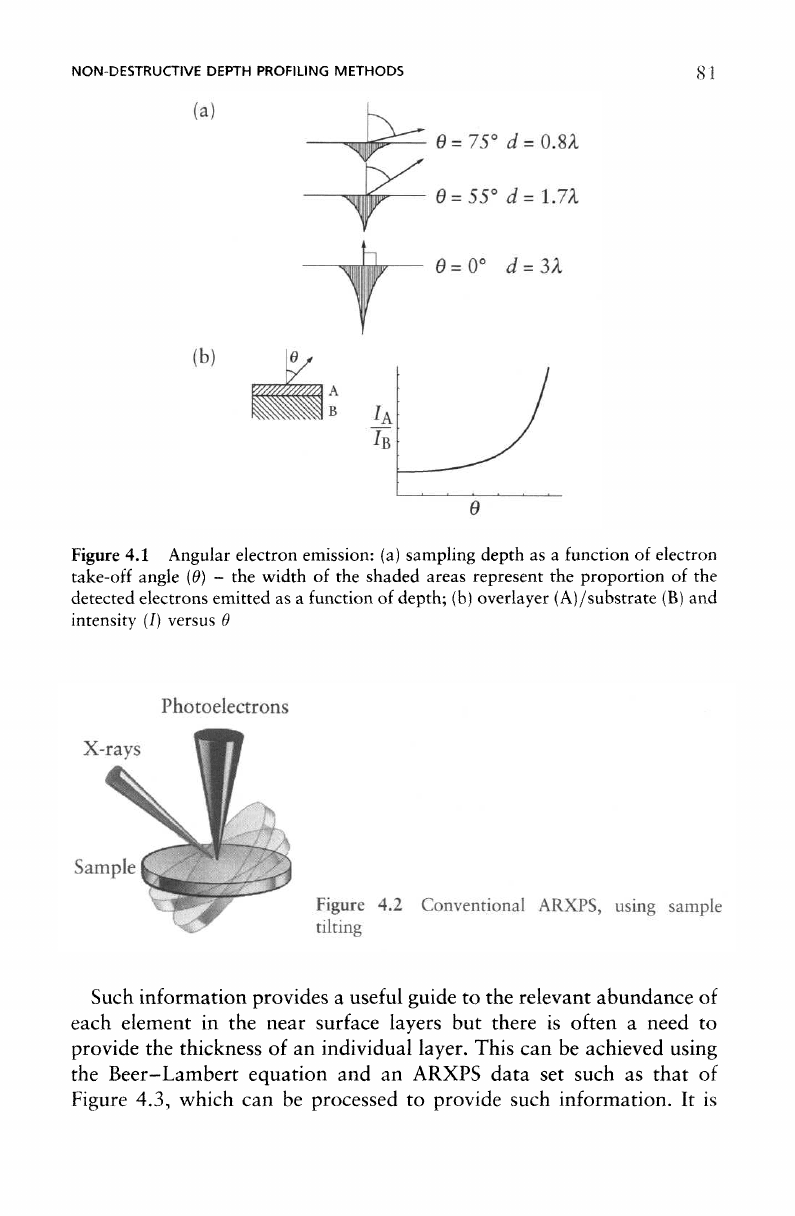
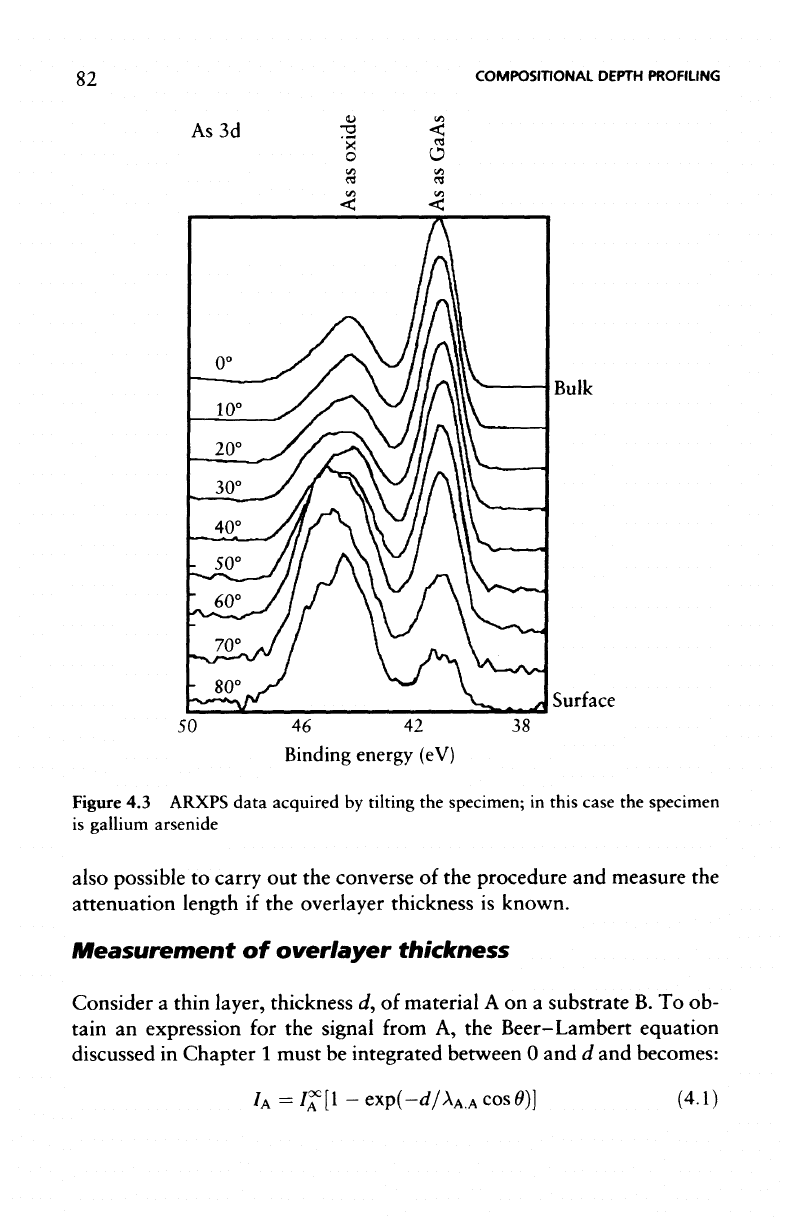
Figure
4.3
presents
an
ARXPS data
set for a
sample
of
GaAs with
a
thin
oxide layer
at its
surface.
It is
clear
from
the
montage
of As 3d
spectra that
the
oxide peak
is
dominant
at the
surface
whereas
the
peak
due to As in the
form
of
GaAs
is
more dominant
at
near normal analysis angles. This phenomenon
is
repeated
in the
gallium spectra (not shown).
5
According
to the
International Standard,
ISO
18115,
the
angle
of
emission
is
measured with
respect
to the
surface
normal while
the
take-off
angle
is
measured with respect
to the
plane
of
the
surface (see Glossary, page 185). Throughout this text
the
angle
of
emission
will
be
used.
NON-DESTRUCTIVE
DEPTH
PROFILING
METHODS
Figure
4.1
Angular
electron emission:
(a)
sampling depth
as a
function
of
electron
take-off
angle
(0) - the
width
of the
shaded areas represent
the
proportion
of the
detected electrons emitted
as a
function
of
depth;
(b)
overlayer (A)/substrate
(B) and
intensity
(/)
versus
0
Such
information provides
a
useful
guide
to the
relevant abundance
of
each element
in the
near surface layers
but
there
is
often
a
need
to
provide
the
thickness
of an
individual layer. This
can be
achieved using
the
Beer-Lambert equation
and an
ARXPS data
set
such
as
that
of
Figure
4.3, which
can be
processed
to
provide such information.
It is
82
COMPOSITIONAL
DEPTH PROFILING
As
3d
46
42
Binding
energy
(eV)
Bulk
Surface
38
Figure
4.3
ARXPS
data
acquired
by
tilting
the
specimen;
in
this
case
the
specimen
is
gallium
arsenide
also possible
to
carry
out the
converse
of the
procedure
and
measure
the
attenuation length
if the
overlayer thickness
is
known.
Measurement
of
overlayer
thickness
Consider
a
thin layer, thickness
d, of
material
A on a
substrate
B. To ob-
tain
an
expression
for the
signal
from
A, the
Beer-Lambert equation
discussed
in
Chapter
1
must
be
integrated between
0 and d and
becomes:
IA =
-
exp(-d/A
A
.
A
cos
6)]
(4.1)
NON-DESTRUCTIVE
DEPTH
PROFILING
METHODS
The
signal
from
B
arriving
at the B-A
interface
is
I
B
°, assuming
layer
B
is
thick. This signal
is
then attenuated
by
passing though layer
A. The
signal
emerging
is
therefore
given
by:
IB =
I
B
°exp(-rf/A
B
,ACOs0)
(4.2)
Note that
the
term
A
B
,A
is the
attenuation length
in
layer
A for
electrons
emitted
from
layer
B.
Taking
the
ratio
of
these signals:
=
R
IE
~
exp(-<//A
A;A
cos 0)]
exp(-d/A
B
,ACOS0)
where
R
00
=
I™
r>
f\ —
exp
A
B,A
A
A,A
(4.3)
If
A
A
,A
=
^B,A
=
^A>
which will
be
approximately true
if
measurements
are
being taken
from
a
thin layer
of
oxide
on its own
metal, using
the
same transition, then
Rearranging
and
taking
the
natural logarithm
ln[l
+
R/R°°]
=
d/(X
A
cos 0)
If
it is
desired
to
calculate
an
equivalent thickness retrospectively,
of
an
oxide
for
example,
it is
possible
to
apply this equation
to
data
re-
corded
at
just
one
value
of 0,
although this
is
only
appropriate
if the
acceptance angle
of the
spectrometer
is
small.
The
form
of the
equation
is
then:
d
=
A
A
cos 0
ln[l
+ R/R
(4.4)
This
approach presupposes that
the
species attenuating
the
substrate
is
a
discrete overlayer, which will
not
always
be the
case.
A
more
rigorous
approach
is to
record
a
complete angle resolved data
set to
84
COMPOSITIONAL
DEPTH PROFILING
4
8
+
jiT
2 -I
\Q.9nm
1 1.2 1.4
I/cos
9
I I I I I
0 20°
30°
40°
Angle
(°)
45°
50'
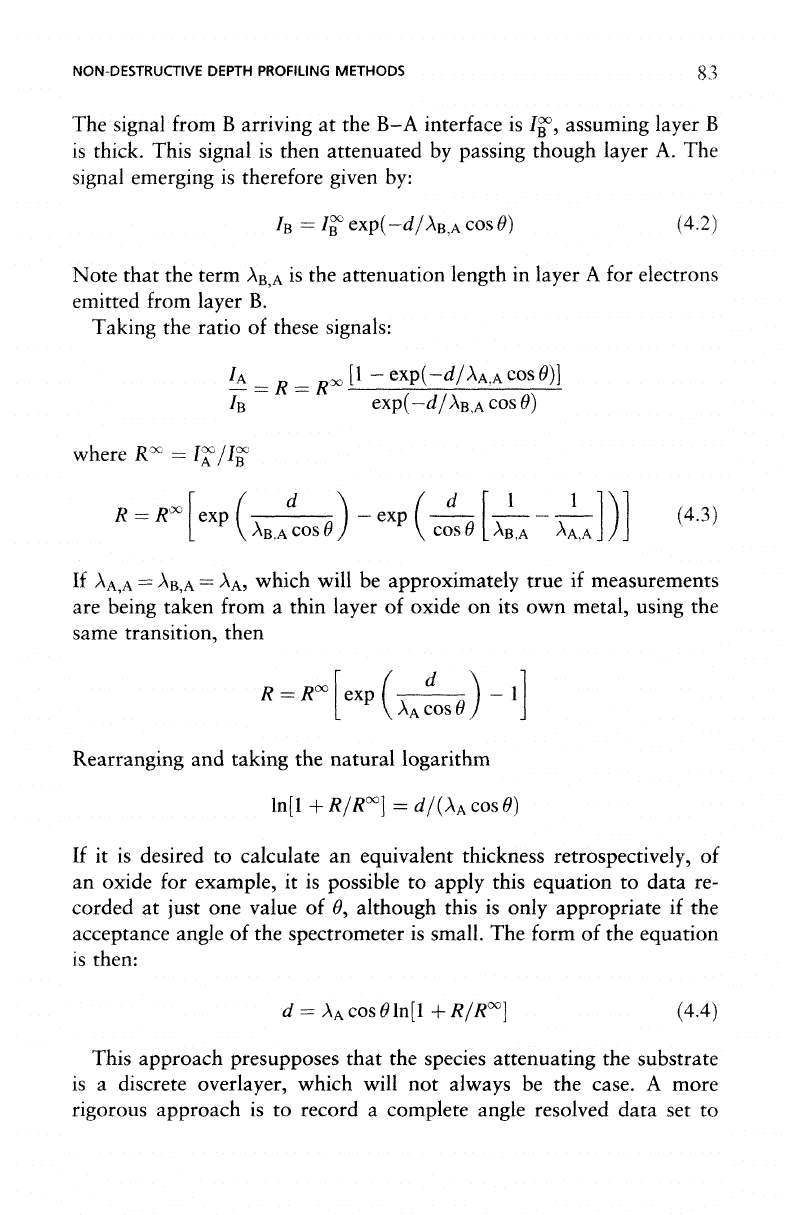
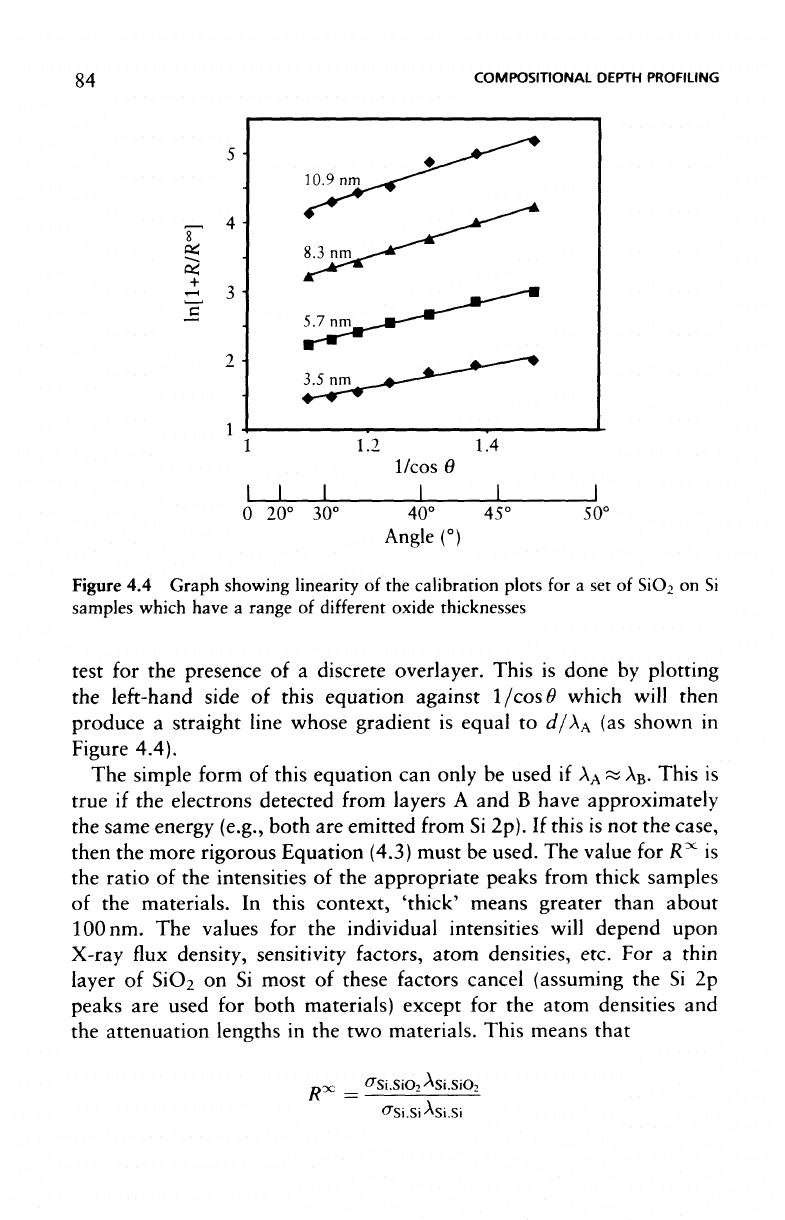
Figure
4.4
Graph showing linearity
of the
calibration plots
for a set of
SiO
2
on Si
samples which have
a
range
of
different
oxide thicknesses
test
for the
presence
of a
discrete overlayer. This
is
done
by
plotting
the
left-hand side
of
this equation against
l/cos#
which
will
then
produce
a
straight line whose gradient
is
equal
to
d/A
A
(as
shown
in
Figure
4.4).
The
simple
form
of
this equation
can
only
be
used
if A
A
^ A
B
.
This
is
true
if the
electrons
detected
from
layers
A and B
have approximately
the
same energy (e.g.,
both
are
emitted
from
Si
2p).
If
this
is not the
case,
then
the
more rigorous Equation (4.3) must
be
used.
The
value
for R^ is
the
ratio
of the
intensities
of the
appropriate peaks
from
thick samples
of
the
materials.
In
this context, 'thick' means greater than about
100 nm. The
values
for the
individual intensities will depend upon
X-ray
flux
density, sensitivity factors, atom densities, etc.
For a
thin
layer
of
SiO
2
on Si
most
of
these factors cancel (assuming
the Si 2p
peaks
are
used
for
both materials) except
for the
atom densities
and
the
attenuation lengths
in the two
materials. This means that
<7Si.SiAsi.Si

NON-DESTRUCTIVE
DEPTH
PROFILING
METHODS
85
where a
x,y
is the
atom
number density (atoms
per
unit volume)
of the
element
x in the
material
y.
Note
that
R°°
contains
the
term
ASJ,SJ-
ratio
of the
atom number densities
is
given
by:
where
D
x
is the
density (mass
per
unit volume)
of
material
x and F
x
is
the
formula weight
of x.
When there
is
more than
one
atom
of an
element
represented
by the
formula then
the
formula weight should
be
multiplied
by the
number
of
atoms present.
For
example,
if the
number
density
of
oxygen atoms
in
silicon dioxide
is
required then
F
sio2
should
be
multiplied
by 2.
The
following data were collected using ARXPS
from
a
thin layer
of
silicon
dioxide
on
silicon. Data were collected from
a
number
of
sam-
ples
where
the
oxide thickness
was
known,
from
ellipsometry,
and the
appropriate graph
plotted,
using only
the
angles close
to
normal emis-
sion.
The
graphs
are
shown
in
Figure 4.4.
If the
gradients
of
these lines
(d/\)
is
plotted against
the
known thickness
of the
oxide
then
we can
calculate
the
attenuation length,
A.
This
is
shown
in
Figure 4.5. From
I
2468
Oxide
thickness
(nm)
10
Figure
4.5 The
gradients
in
Figure
4.4 are
shown plotted against
the
known oxide
thickness
to
allow
the
calculation
of the
attenuation length,
A
g6
COMPOSITIONAL
DEPTH
PROFILING
these data
A is
calculated
to be 3.4 nm.
This value
can now be fed
back
into
the
expression
for an
unknown sample
to
calculate
the
thickness
of
the
oxide.
This methodology
can be
readily extended
to
accommodate
multi-
layer
samples
by the
simple expedient
of
defining
a
Beer-Lambert term
for
each layer with (where appropriate)
an
attenuation term
to
allow
for
the
reduction
of
intensity, compared with
an
infinitely
thick standard,
of
its
distance below
the
surface
(Equation
(4.2))
and its
reduced thickness
(Equation
(4.1)).
There are,
of
course, limits
in
terms
of the
thickness
of an
overlayer
that
can be
resolved using ARXPS.
If the
average thickness
of the
over-
layer becomes comparable with atomic dimensions then
the
analysis
given
here
is
inappropriate because
the
overlayer would
be
incomplete.
The
lower
limit
for
which
the
thickness measurement
can be
used
is
therefore about
0.2 nm.
This situation
can be
accommodated using
a
different
analysis method.
At the
other
end of the
scale,
the
signal gen-
erated
by the
substrate becomes weak even when
the
electrons
are
col-
lected
at
near normal emission angles.
In
general,
the
thickest
layer
which
can be
analysed using this method
is
about
3A
which,
for
silicon
dioxide,
is
approximately
10 nm,
(see Figure 4.5).
4.1.1.1
Elastic
scattering
If
the
data
in
Figure
4.4 are
plotted
over
a
wide angular range then
the
linearity
breaks down (see Figure 4.6). This
is a
result
of the
effects
of
elastic
scattering
of the
electrons which
are
emitted
from
deeper regions
of
the
sample.
The
mechanism
is
that electrons originating
from
deep within
the
sample
suffer
an
elastic collision within
the
sample
and are
emitted
from
the
surface
at
some large angle with respect
to the
surface
nor-
mal
(Figure
4.7). Because
the
scattering
is
elastic,
the
electrons con-
tribute
to the
peak intensity.
In the
case
of a
thin oxide layer
on a
metal,
the
effect
causes
the
signal
from
the
metal
to be
greater
than expected
and can
lead
to
layer thicknesses being under-
estimated. However, good
linearity
on
graphs such
as
those
in
Figure
4.6
will
generally
be
expected
if the
maximum emission angle
is
restricted
to
~60°.