Baker K.R. Optimization Modeling with Spreadsheets
Подождите немного. Документ загружается.

The spreadsheet is organized into four modules: Inputs, Decision, Calculation,
and Outcome, separating different kinds of information. In spreadsheet models, it is
a good idea to separate input data from decisions and decisions from outcome
measures. Intermediate calculations that do not lead directly to the outcome measure
should also be kept separate.
In the spreadsheet model, cell borders and shading draw attention to the decision
(cell C9) and the objective (cell C15) as the two most important elements of the optim-
ization model. No matter how complicated a spreadsheet model may become, we want
the decisions and the objective to be located easily by someone who looks at the
display.
In the spreadsheet of Figure 1.1, the input parameters appear explicitly. It would
not be difficult to skip the Inputs section entirely and express the demand function in
cell C12 with the formula ¼
800–5
∗
C9, or to express the profit contribution in
cell C15 with the formula ¼
(C9–40)
∗
C12. This approach, however, places the
numerical parameters in formulas, so a user would not see them at all when looking
at the spreadsheet. Good practice calls for displaying parameters explicitly in the
spreadsheet, as we have done in Figure 1.1, rather than burying them in formulas.
The basic version of our model, shown in Figure 1.1, is ready for optimization.
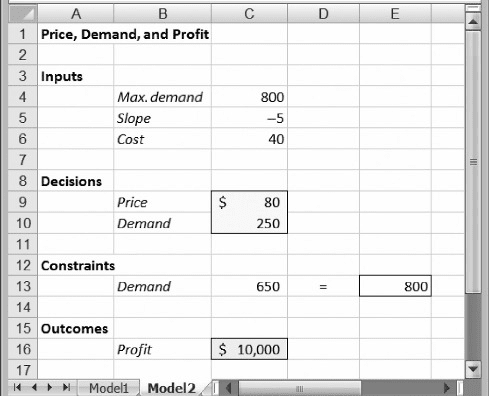
But let’s look at an alternative, shown in Figure 1.2. This version contains the four
modules, and the numerical inputs are explicit but placed differently than in
Figure 1.1. The main difference is that demand is treated as a decision variable, and
the demand curve is expressed as an explicit constraint. Specifically, this form of
the model treats both price and demand as variables in cells C9:C10, as if the two
choices could be made arbitrarily. However, the Constraints module describes a
relationship between the two variables in the form of Equation 1.1, which can
Figure 1.2. Alternative spreadsheet model for determining price.
6 Chapter 1 Introduction to Spreadsheet Models for Optimization
equivalently be expressed as
y + 5x = 800 (1.4)
We can meet this constraint by forcing cell C13 to equal cell E13, a condition that does
not yet hold in Figure 1.2. Cell C13 contains the formula on the left-hand side of
Equation 1.4, and cell E13 contains a reference to the parameter 800. The equals
sign between them, in cell D13, signifies the nature of the constraint relationship to
someone who is looking at the spreadsheet and trying to understand its logic.
Equation 1.4 collects all the terms involving decision variables on the left-hand
side (in cell C13) and places the constant term on the right-hand side (in cell E13).
This is a standard form for expressing a constraint in a spreadsheet model. The spread-
sheet itself displays, but does not actually enforce, this constraint. The enforcement
task is left to the optimization software. Once the constraint is met, the corresponding
decisions are called feasible.
This is a good place to include a reminder about the software that accompanies
this book. The software contains important files and programs. In terms of files, the
book’s website
1
contains all of the spreadsheets shown in the figures. Figures 1.1
and 1.2, for example, can be found in the file that contains the spreadsheets for
Chapter 1. Those files should be loaded, or else built from scratch, before continuing
with the text. As we proceed through the chapters, the reader is welcome to load each
file that appears in a figure, for hands-on examination.
1.3. A HIERARCHY FOR ANALYSIS
Before we proceed, some background on the development of models in organizations
may be useful. Think about the person who builds a model as an analyst, someone who
provides support to a decision maker or client . (In some cases, the analyst and the
client are the same.) The development, testing, and application of a model constitute
support for the decision maker—a service to the client. The application phase of this
process includes some standard stages of model use.
When a model is built as an aid to decision making, the first stage often involves
building a prototype, or a series of prototypes, leading to a model that the analyst and
the client accept as a usable decision-support tool. That model provides quantitative
analysis of a base-case scenario. In Example 1.1, suppose we set a tentative price of
$80. This price might be called a base case, in the sense that it represents a tentative
decision. As we have seen, this price leads to demand of 400 and profit contribution of
$16,000.
After establishing a base case, it is usually appropriate to investigate the answers
to a number of “what-if” questions. We ask, what if we change a numerical input or a
decision in the model—what impact would that change have? Suppose, for example,
that the marginal effect of price on demand (the slope of the demand curve) were –4
instead of –5. What difference would this make? Retracing our algebraic steps, or
1
The URL for the book’s website is http://mba.tuck.dartmouth.edu/opt/
1.3. A Hierarchy for Analysis 7
revising the spreadsheet in Figure 1.1, we can determine that the profit contribution
would be $19,200.
Systematic investigations of this kind are called sensitivity analyses. They explore
how sensitive the results and conclusions are to changes in assumptions. Typically, we
start by varying one assumption at a time and tracing the impact. Then we might try
varying two or more assumptions, but such probing can quickly become difficult to
follow. Therefore, most sensitivity analyses are performed one assumption at a
time. Sometimes, it is useful to explore the what-if question in reverse. That is, we
might ask, for the result to attain a given outcome level, what would the numerical
input have to be? For example, starting with the base-case model, we might ask,
what price would generate a profit contribution of $17,000? We can answer this ques-
tion algebraically, by setting z ¼ 17,000 in Equation 1.3 and solving for x, or, with the
spreadsheet model, we can invoke Excel’s Goal Seek tool to discover that the price
would have to be about $86.
Sensitivity analyses are helpful in determining the robustness of the results and
any risks that might be present. They can also reveal how to achieve improvement
from better choices in decision making. However, locating improvements this way
is something of a trial-and-error process, and trial-and-error probing is inefficient.
Faster and more reliable ways of locating improvements are available. Moreover,
with trial-and-error approaches, we seldom know how far improvements can poten-
tially reach, so a best outcome could exist that we never detect.
From this perspective, optimization can be viewed as a sophisticated form of sen-
sitivity analysis that seeks the best values for the decisions and the best value for the
performance measure. Optimization takes us beyond mere improvement; we look for
the very best outcome in our model, the maximum possible benefit or the minimum
possible cost. If we have constraints in our model, then optimization also tells us
which of those conditions ultimately limit what we want to accomplish. Optimization
can also reveal what we might gain if we can find a way to overcome those constraints
and proceed beyond the limitations they impose.
1.4. OPTIMIZATION SOFTWARE
Optimization procedures find the best values of the decision variables in a given
model. In the case of Excel, the optimization software is known as Solver, which is
a standard tool available on the Data ribbon. (The generic term solver often refers
to optimization software, whether or not it is implemented in a spreadsheet.)
Optimization tools have been available on computers for several decades, prior to
the widespread use of electronic spreadsheets. Before spreadsheets became popular,
optimization was available as stand-alone software; it relied on an algebraic approach,
but it was often accessible only by technical experts. Decision makers and even their
analysts had to rely on those experts to build and solve optimization models.
Spreadsheets, if they were used at all, were limited to small examples. Now, however,
the spreadsheet allows decision makers to develop their own models, without having
to learn specialized software, and to find optimal solutions for those models using
Solver. Two trends account for the popularity of spreadsheet optimization. First,
8
Chapter 1 Introduction to Spreadsheet Models for Optimization

familiarity with spreadsheets has become almost ubiquitous, at least in the business
world. The spreadsheet has come to represent a common language for analysis.
Second, the software packages available for spreadsheet-based optimization now
include some of the most powerful tools available. The spreadsheet platform need
not be an impediment to solving practical optimization problems.
Spreadsheet-based optimization has several advantages. The spreadsheet allows
model inputs to be documented clearly and systematically. Moreover, if it is necessary
to convert raw data into other forms for the purposes of setting up a model, the required
calculations can be performed and documented conveniently in the same spreadsheet,
or at least on another sheet in the same workbook. This allows integration between
raw data and model data. Without this integration, errors or omissions are more
likely, and maintenance becomes more difficult. Another advantage is algorithmic
flexibility: The spreadsheet has the ability to call on several different optimization pro-
cedures, but the process of preparing the model is mostly the same no matter which
procedure is applied. Finally, spreadsheet models have a certain amount of intrinsic
credibility because spreadsheets are now so widely used for other purposes.
Although spreadsheets can contain errors (and often do), there is at least some comfort
in knowing that logic and discipline must be applied in the building of a spreadsheet.
Table 1.1 summarizes and compares the advantages of spreadsheet and algebraic
(3,4) software approaches to optimization problems. The main advantage of algebraic
approaches is the efficiency with which models can be specified. With spreadsheets,
the elements of a model are represented explicitly. Thus, if the model requires a thou-
sand variables, then the model builder must designate a thousand cells to hold their
respective values. Algebraic codes use a different method. If a model contains a thou-
sand variables, the code might refer to x(k), with a specification that k may take on
values from 1 to 1000, but x(k) need not be represented explicitly for each of the thou-
sand values.
A second advantage of algebraic approaches is the fact that they can sometimes
be tailored to a particular application. For example, the very large crew-scheduling
applications used by airlines exhibit a special structure. To exploit this structure in
the solution procedure, algebraic codes are sometimes enhanced with specialized sub-
routines that add solution efficiencies when solving a crew-scheduling problem.
A disadvantage of using spreadsheets is that they are not always transparent.
As noted earlier, the analyst has a lot of flexibility in the layout and organization
of a spreadsheet, but this flexibility, taken too far, may detract from effective
communication. In this book, we try to promote better communication by suggesting
Table 1.1. Advantages of Spreadsheet and Algebraic Solution Approaches
Spreadsheet approaches Algebraic approaches
Several algorithms available in one place Large problem sizes accommodated
Integration of raw data and model data Concise model specification
Flexibility in layout and design Standardized model description
Ease of communication with nonspecialists Enhancements possible for special cases
Intrinsic credibility
1.4. Optimization Software
9
standard forms for particular types of models. By using some standardization, we
make it easier to understand and debug someone else’s model. Algebraic codes
usually have very detailed specifications for model format, so once we’re familiar
with the specifications, we should be able to read and understand anyone else’s model.
In brief, commercially available algebraic solvers represent an alternative to
spreadsheet-based optimization. In this book, our focus on a spreadsheet approach
allows the novice to learn basic concepts of mathematical programming, practice
building optimization models, obtain solutions readily, and interpret and apply the
results of the analysis. All these skills can be developed in the accessible world of
spreadsheets. Moreover, these skills provide a solid foundation for using algebraic
solvers at some later date, when and if the situation demands it.
1.5. USING SOLVER
Purchasers of this book may download a powerful software package called Risk
Solver Platform (RSP) that was developed by the same team that created Excel’s
Solver and that accommodates all Excel Solver models. (Before continuing with
the text, the reader should install the software by following the guidelines and
instructions in Appendix 1.) RSP is an integrated software package that includes
more than just optimization capabilities, but this book focuses on optimization.
Hence, the installation instructions recommend setting this software to operate in
Premium Solver Platform mode, which exposes all of the optimization features, but
hides other features such as Monte Carlo simulation and decision trees. Once the
software is installed, a new Risk Solver Platform tab appears in Excel, with its own
ribbon of commands. Under Premium Solver Platform mode, a Premium Solver
Platform tab appears instead. In addition, the Add-Ins tab contains a Premium
Solver choice which displays a Solver Parameters dialog that closely resembles the
standard Excel Solver but uses the more powerful optimization capabilities of RSP.
For our purposes, these tabs contain the equivalent optimization capabilities, and
we may refer to either one.
In the remainder of this book, we assume the use of RSP, but we refer to it simply
as Solver. The book covers its four main optimization procedures:
†
The nonlinear solver
†
The linear solver
†
The integer solver
†
The evolutionary solver
As in all matters involving software, the user should be aware of the copyright
privileges and restrictions that apply to the use of RSP.
In order to illustrate the use of Solver, we return to Example 1.1. The optimization
problem is to find a price that maximizes quarterly profit contribution. An algebraic
statement of the problem is
Maximize z = (x − 40)y (objective)
subject to y + 5x = 800 (constraint)
10
Chapter 1 Introduction to Spreadsheet Models for Optimization
This form of the model corresponds to Figure 1.2, which contains two decision vari-
ables (x and y, or price and demand) and one constraint on the decision variables. The
spreadsheet model in Figure 1.2 is ready for optimization.
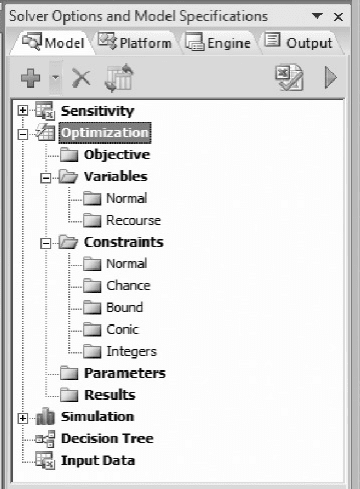
To start, we select the Risk Solver Platform tab and click on the Model icon
(on the left side of its ribbon). This step opens the task pane on the right-hand side
of the Excel window. The task pane contains four tabs: Model, Platform, Engine,
and Output. Initially, the Model tab displays a window listing several components
of the software, including Optimization. In Figure 1.3, we have expanded the
Optimization entry on the Model tab. As we specify the elements of our model,
they are recorded in the folder icons of this window. At the top of the model tab
five icons appear:
†
Green “plus” sign, to Add model specifications
†
Red “delete” sign, to Remove specifications
†
Orange paired sheets with small blue arrows, to Refresh the display after
changes
†
Green checked sheet, to Analyze the model
†
Green triangle, to Solve the specified optimization problem.
To specify the model we first select the decision cells (C9:C10) and then on the drop-
down menu of the Add icon, select Add Variable. The range
$C$9: $C$10 immedi-
ately appears in the Model window, in the folder for Normal Variables. (Another way
Figure 1.3. Model tab on the initial task pane.
1.5. Using Solver 11
to accomplish this step without using the drop-down menu is to highlight the Normal
Variables folder icon and simply click the Add icon.)
Next, we select the objective cell (C16) and on the drop-down menu of the Add
icon, select Add Objective. The cell address
$C$16 immediately appears in the Model
window, in the folder for Objective. By default, the specification assumes that the
objective is to maximize this value. (We can implement this step by highlighting
the Objective folder and simply clicking the Add icon.)
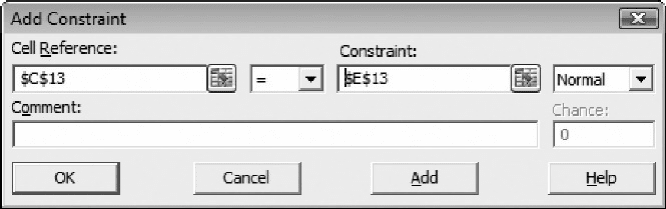
Next, we select the left-hand side of the constraint (C13) and on the drop-down
menu of the Add icon, select Add Constraint. (Alternatively, we can highlight the
Normal Constraints folder icon and click the Add icon.) The Add Constraint
window appears, with the cell address
$C$13 in the Cell Reference box, as shown
in Figure 1.4. On the drop-down menu to its right, we select “ ¼ ” and enter E13 in
the Constraint box (or, with the cursor in the box, select cell E13).
When specifying constraints, one of our design guidelines for Solver models is
to reference a cell containing a formula in the Cell Reference box and to reference
a cell containing a number in the Constraint box. The use of cell references keeps
the key parameters visible on the spreadsheet, rather than in the less accessible win-
dows of Solver’s interface. The principle at work here is to communicate as much
as possible about the model using the spreadsheet itself. Ideally, another person
would not have to examine the task pane to understand the model. (Although
Solver permits us to enter numerical values directly into the Constraint box, this
form is less effective for communication and complicates sensitivity analysis. It
would be reasonable only in special cases where the model structure is obvious
from the spreadsheet and where we expect to perform no sensitivity analyses for the
corresponding parameter.)
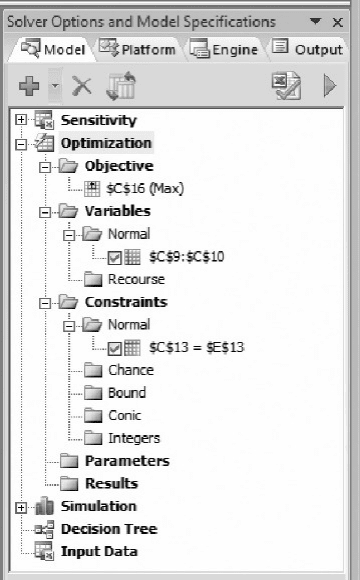
Finally, we press OK and observe that the task pane displays the model’s speci-
fication, as shown in Figure 1.5. In summary, our model specification is the following:
Objective: C16 (maximize)
Variables: C9:C10
Constraint: C13 ¼ E13
This model is simple enough that we need not address the information on the
Platform tab. (However, it is generally a good idea to set the Nonsmooth Model
Figure 1.4. Add Constraint window.
12 Chapter 1 Introduction to Spreadsheet Models for Optimization
Transformation option to Never.) At the top of the Engine tab, we observe the default
selection of the Standard GRG Nonlinear Engine, which we refer to as the nonlinear
solver. (To ensure this selection, we uncheck the box for Automatically Select
Engine.) This solution algorithm is appropriate for our optimization problem, and
we do not need to address most of the other information on the tab. However, one
of the options is important.
Although we may guess that the optimal price is a positive quantity, the model as
specified permits the price decision to be negative. Such an outcome would not make
sense in this problem, so it may be a good idea to limit the model to nonnegative prices.
In fact, virtually all of the models in this book involve decision variables that make
practical sense only when they are nonnegative, so we will impose this restriction rou-
tinely. On the Engine tab of the task pane, we find the Assume Non-Negative option in
the General group and change it to True, using the drop-down menu on the right-hand
side, as shown in Figure 1.6.
Finally, we proceed to the Output tab (or return to the Model tab) and click the
Solve icon. Solver searches for the optimal price and ultimately places it in the
price cell. In this case, the optimal price is $100, and the corresponding quarterly
profit contribution is $18,000 as shown in Figure 1.7.
Figure 1.5. Model specification.
1.5. Using Solver 13
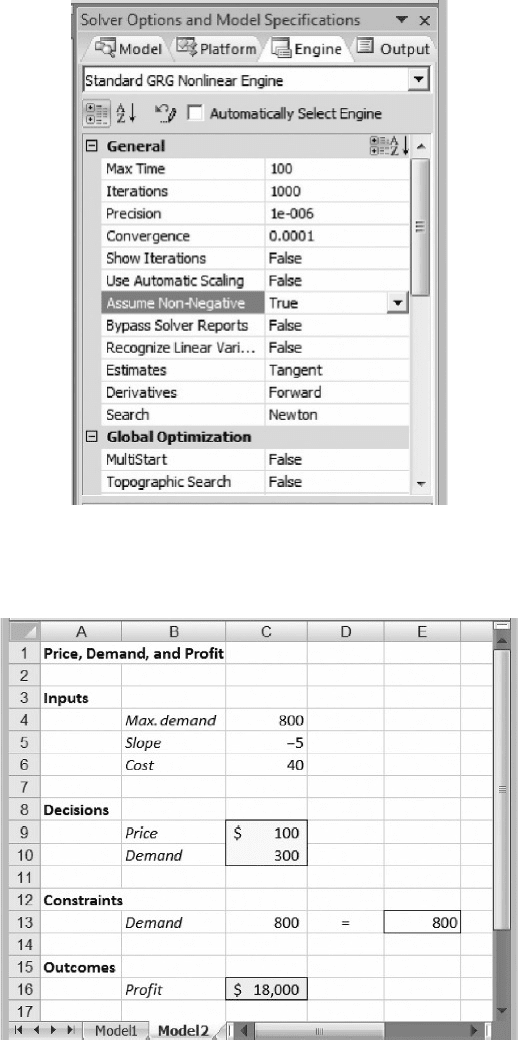
Figure 1.6. Setting the Assume Non-Negative option.
Figure 1.7. Optimal solution for Example 1.1.
14 Chapter 1 Introduction to Spreadsheet Models for Optimization

Meanwhile, the Output tab’s window displays the solution log for the optimiz-
ation run. (The detail in this log is controlled by the Log Level option on the
Platform tab, but the default setting of Normal is usually adequate.) The most impor-
tant part of the log is the Solver Results message, which in this case states:
Solver found a solution. All
constraints and optimality conditions
are satisfied.
This optimality message, which is repeated at the very bottom of the task pane, tells us
that no problems arose during the optimization and Solver was able to find an optimal
solution. The profit-maximizing price is $100, yielding an optimal profit of $18,000.
No other price can achieve more than this level. Thus, if we are confident that the
demand curve continues to hold, the profit-maximizing decision would be to set
price at $100.
We have used Example 1.1 to introduce Solver and its interface. The task pane
contains many user-selected options that are not a concern in this problem. In later
chapters, we cover many of these settings and discuss when they become relevant.
We also discuss the variations that can occur in optimization runs. For example,
depending on the initial values of the decision variables, the nonlinear solver may gen-
erate the following result message in the solution log:
Solver has converged to the current
solution. All constraints are satisfied.
This convergence message indicates that Solver has not been able to confirm optim-
ality. Usually, this condition occurs because of numerical issues in the solution algor-
ithm, and the resolution is to rerun Solver from the point where convergence occurred.
Normally, one or two iterations are sufficient to produce the optimality message. We
discuss Solver’s result messages in more detail later.
With Solver, we can minimize an objective function instead of maximizing it.
We return to the specification in the window of the Model tab of the task pane and
double-click on the entry in the Objective folder. The Change Objective window
appears, as shown in Figure 1.8, and we can select the button for Min rather than
Max. (A third option allows us to specify a target value and find a set of variables
Figure 1.8. Selecting minimization of an objective.
1.5. Using Solver 15