Balakumar Balachandran, Magrab E.B. Vibrations
Подождите немного. Документ загружается.

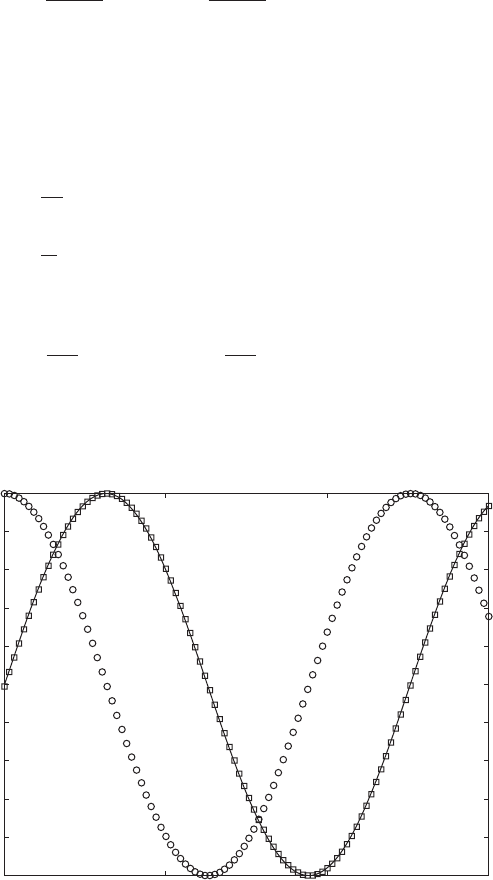
Since the only system parameter that determines the displacement response is
the stiffness k, we call this region the stiffness-dominated region. In this re-
gion, the displacement is in phase with the force.
The velocity response is determined from Eq. (5.27) to be
(5.28)
Therefore, as expected, the velocity response leads the displacement response
by p/2; that is, the maximum value of the velocity occurs before the maxi-
mum value of the displacement. These results are illustrated in Figure 5.10.
1 At this value of , Eqs. (5.18) simplify to
(5.29)
Therefore, the displacement response given by Eq. (5.17) takes the form
(5.30)
Thus, for a given excitation amplitude F
o
and natural frequency v
n
, the am-
plitude of the displacement is determined by the damping coefficient c. This
x
ss
1t 2
F
o
2kz
sin 1t p/2 2
F
o
cv
n
sin 1t p/2 2
u11 2
p
2
H11 2
1
2z
v
ss
1t 2
v
n
F
o
k
cos 1t2
v
n
F
o
k
sin1t p/2 2
200 CHAPTER 5 Single Degree-of-Freedom Systems Subjected to Periodic Excitations
FIGURE 5.10
Phase relationships among displacement, velocity, and force in the stiffness-dominated
region: 1. [— f(t)/F
o
; 䊐 x(t)/(F
o
/k); 䊊 v (t)/(v
n
F
o
/k).]
0 50 100 150
1
0.8
0.6
0.4
0.2
0
0.2
0.4
0.6
0.8
1
Ωt
Amplitude
region, therefore, is called the damping-dominated region. We also see that
the displacement lags the force by p/2 and that this phase lag is independent
of z. For z 0, it is mentioned that H() is not a maximum when 1. We
shall determine this maximum value and the value of at which it occurs
subsequently. The amplitude response is characterized by a peak close to the
natural frequency for values of z in the range 0 z 0.3, as can be seen from
Figure 5.2a.
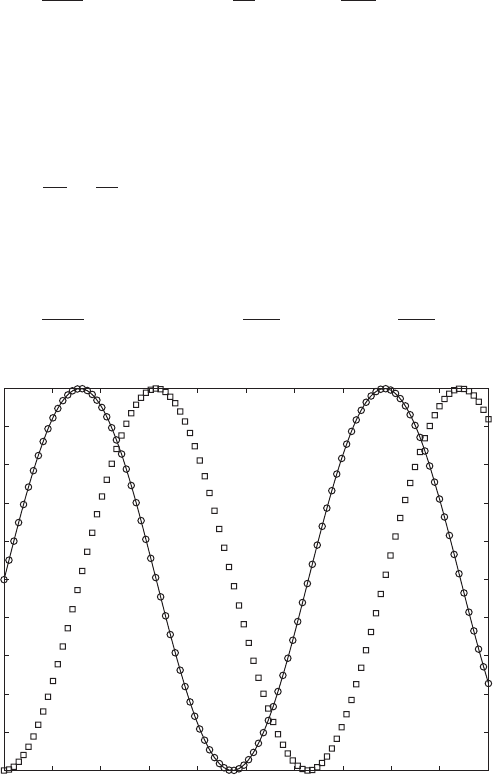
The velocity response is obtained from Eq. (5.30) to be
(5.31)
Therefore, in this region, the velocity is in phase with the force. These results
are illustrated in Figure 5.11.
1 In this region, the amplitude and phase responses given by
Eqs. (5.18) simplify to
(5.32)
and, therefore, the displacement response given by Eq. (5.17) simplifies to
(5.33)x
ss
1t 2
F
o
v
2
n
kv
2
sin 1t p 2
F
o
mv
2
sin 1t2
f 1t2
mv
2
u12씮 p
H12씮
1
2
v
2
n
v
2
v
ss
1t 2
F
o
v
n
2kz
cos 1t p/2 2
F
o
c
sin 1t2
f 1t2
c
5.2 Response to Harmonic Excitation 201
FIGURE 5.11
Phase relationships among displacement, velocity, and force in the damping-dominated
region: 1. [— f (t)/F
o
; 䊐 x(t)/(F
o
/(2zk)); 䊊 v(t)/(F
o
/c).]
0 1 2 3 4 5 6 7 8 9 10
1
0.8
0.6
0.4
0.2
0
0.2
0.4
0.6
0.8
1
Ωt
Amplitude
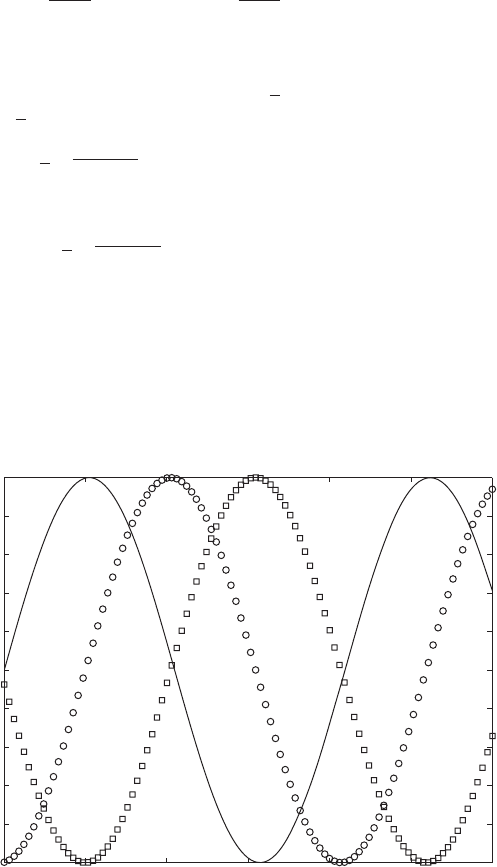
Thus, the displacement response is 180° out of phase with the applied force.
For a given f(t), the amplitude of the displacement is inversely proportional
to m, the mass. This region, therefore, is called the inertia-dominated region.
The velocity is determined from Eq. (5.33) to be
(5.34)
Hence, in this region, the velocity lags the force by p/2. These results are
shown in Figure 5.12.
It can be shown that when for 0, and when
H() 1 for
or
These response characteristics can also be seen in Figure 5.2.
The dependence of the system response on the different system parame-
ters is summarized as a function of the excitation frequency as shown in Fig-
ure 5.13. Further discussion about the response magnitude and the response
phase as a function of the excitation frequency is provided in Section 5.3.
v v
n
1221 2z
2
12 21 2z
2
z 1/ 12,
z 1/ 12
, H12 1
v
ss
1t 2
F
o
v
n
k
cos 1t p 2
F
o
v
n
k
sin 1t p/2 2
202 CHAPTER 5 Single Degree-of-Freedom Systems Subjected to Periodic Excitations
FIGURE 5.12
Phase relationships among displacement, velocity, and force in the inertia-dominated region:
1. [— f(t)/F
o
; 䊐 x(t)/(F
o
/(k
2
)); 䊊 v(t)/(F
o
v
n
/(k)).]
0 0.5 1 1.5 2 2.5 3
1
0.8
0.6
0.4
0.2
0
0.2
0.4
0.6
0.8
1
Ωt
Amplitude
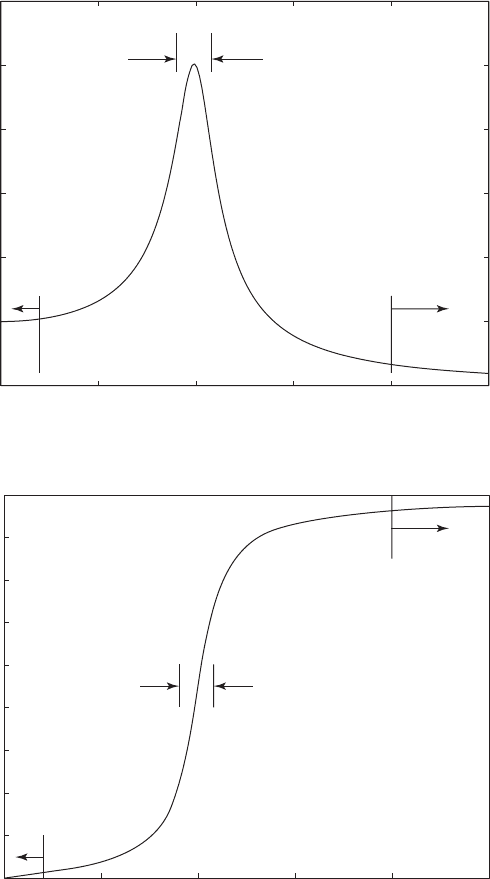
FIGURE 5.13
Three regions of a single degree-of-freedom system: (a) amplitude response and
(b) phase response.
0 0.5 1 1.5 2 2.5
(a)
(b)
0
1
2
3
4
5
6
Inertia
dominated
x(t)~1/m
Stiffness
dominated
x(t)~1/k
Damping
dominated
x(t)~1/c
Ω
H(Ω)
180
160
140
120
100
80
60
40
20
0
0 0.5 1 1.5
Damping
dominated
x(
t)~1/c
Stiffness
dominated
x(
t)~1/k
Inertia
dominated
x(
t)~1/m
2 2.5
Ω
u (Ω) (deg)
5.3 FREQUENCY-RESPONSE FUNCTION
5.3.1 Introduction
In Section 5.2, the responses of undamped and underdamped systems to har-
monic excitations were discussed and the notions of resonance of a linear vi-
bratory system, steady-state motion, and frequency-response function were
introduced. In this section, the concept of a frequency-response function is
further treated.
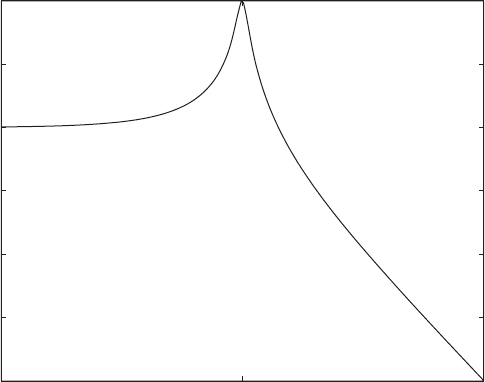
As illustrated in Figure 5.14, for a linear vibratory system, a frequency-
response function provides a relationship between a system’s input and a sys-
tem’s output. The frequency-response function G() is a complex-valued
function of frequency, and this function provides information about the mag-
nitude and phase of the steady-state response of a linear vibratory system as
a function of the excitation frequency.
204 CHAPTER 5 Single Degree-of-Freedom Systems Subjected to Periodic Excitations
Frequency-response function
of a system G(Ω)
Force input
Displacement
output
FIGURE 5.14
Conceptual illustration of the frequency-response function.
Observations
Stiffness-dominated region: When the amplitude of the harmonic ex-
citing force is constant and the excitation frequency is much less than
the natural frequency of the system, the magnitude of the displacement
is determined by the system’s stiffness. The displacement response is
in phase with the excitation force.
Damping-dominated region: When the amplitude of the harmonic ex-
citing force is constant and the excitation frequency equals the natural
frequency of the system, the magnitude of the displacement response is
magnified for 0 z 1, and the amount of magnification is deter-
mined by the system’s damping coefficient. The displacement response
lags the excitation force by 90°.
Inertia-dominated region: When the amplitude of the harmonic excit-
ing force is constant and the excitation frequency is much greater than
the natural frequency of the system, the magnitude of the displacement
response is determined by the system’s inertia. When is greater than
, the magnitude of the amplitude response is always less than 1.
The displacement response is almost 180° out of phase with the excita-
tion force.
1/ 12

For the cases treated in Section 5.2, one can define the frequency-response
function G() in terms of the force input and displacement output of the linear
vibratory system. In its general representation, this function has the form
(5.35)
where v/v
n
is the ratio of the excitation frequency v to the natural
frequency of the system v
n
, k is the stiffness of the vibratory system, the
nondimensional function H() provides the magnitude, and u()
is the phase lag associated with the response. In Eq. (5.35), the frequency-
response function has dimensions of displacement/force; that is, m/N. If the
frequency-response function is desired in nondimensional form, it is defined as
(5.36)
where the complex-valued function is now nondimensional.
For a linear vibratory system, where the forcing is applied to the mass di-
rectly as in Figure 5.1, the nondimensional function H() and the phase u()
are given by Eqs. (5.8). These functions have different forms when the exci-
tation is either applied to the base or the source of the excitation is a rotating
unbalance, as discussed in Sections 5.4 and 5.5, respectively.
Based on Eqs. (5.8) and (5.35), the magnitude of the frequency-response
function is given by
(5.37)
As evident from Eq. (5.37), this function contains information about the sys-
tem parameters such as the stiffness k, and the system characteristics such as
the natural frequency v
n
and the damping factor z. In Section 5.3.2, we dis-
cuss how the frequency-response function magnitude can be curve-fit to ex-
tract information about the characteristics of a linear vibratory system. In Sec-
tion 5.3.3, the sensitivity of the frequency-response function magnitude to
different system parameters is examined, and in Section 5.3.4, the relation-
ship between a frequency-response function and a transfer function is ex-
plained. Finally, in Section 5.3.5, we discuss alternative forms of the fre-
quency response function.
5.3.2 Curve Fitting and Parameter Estimation
Let us suppose that one conducts an experiment where a sinusoidal forcing is
applied to a system. After the motions of the system reach steady state, that is,
after many cycles of forcing, the forcing and displacement are measured by us-
ing appropriate transducers. From these measured quantities, one can deter-
mine the ratio of the displacement magnitude to the force magnitude. If this ex-
periment is repeated at different frequencies over a frequency range, and if at
each excitation frequency this ratio is determined, the resulting information
0G120
H12
k
1
k211
2
2
2
12z2
2
G
ˆ
1 2
H1 2e
ju12
G
ˆ
1 2 kG12
j 11
,
G12
1
k
H12e
ju12
5.3 Frequency-Response Function 205
(a)
(b)
0 0.5 1 1.5 2
0
0.5
1
1.5
2
2.5
3
3.5
(v/1.5)
H(v)
0 0.5 1 1.5 2 2.5 3
0
0.005
0.01
0.015
0.02
0.025
0.03
0.035
0.04
0.045
0.05
v
|G(v)|
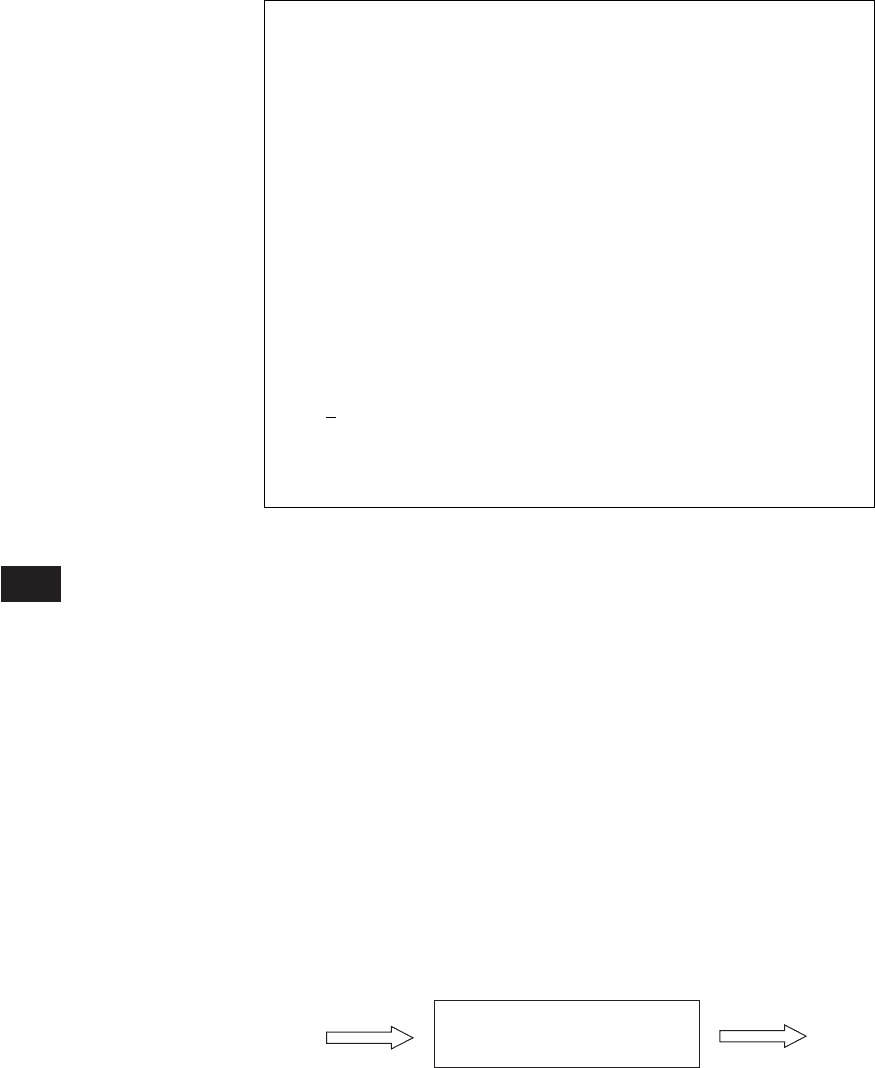
FIGURE 5.15
Model identification using Eq. (5.37): (a) experimental data along with identified model 0G(v) 0
and (b) experimental data along with identified model H() k 0G(v) 0.
can be plotted as a function of frequency as shown in Figure 5.15a where the
open circles represent the experimental data. We assume that the physical sys-
tem of interest is a linear vibratory system and use Eq. (5.1) to describe the sys-
tem. Then, based on Eq. (5.37), one can curve-fit the experimental data and
estimate the values of the stiffness k, the natural frequency v
n
, and the damping
factor z. For the data shown in Figure 5.15a, it is found
7
that z 0.15, v
n
1.5 rad/s, and k 71.5 N/m. These values were inserted in Eq. (5.37) to obtain
the solid line passing through the data. In Figure 5.15b, the nondimensional
function H() k 0G(v)0is shown along with the experimental data.
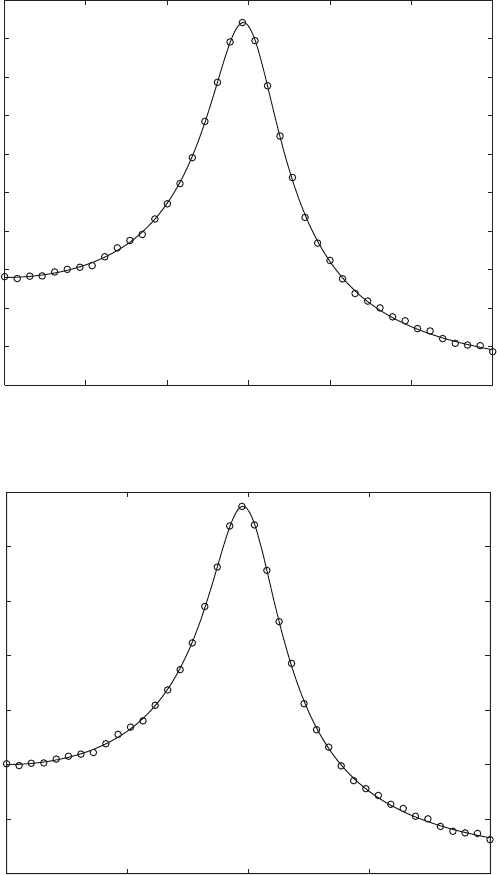
In Figure 5.16, the nondimensional function H() is plotted on a graph
with a logarithmic scale for the frequency axis and a logarithmic scale for the
magnitude axis. This type of graph helps highlight the location of a resonance
and the overall response characteristics as a function of frequency over several
decades of frequency. In such log-log plots, the magnitude is expressed in terms
of decibels (dB), which is discussed in Appendix C.
The frequency-response function provides an alternate means to the
logarithmic-decrement method given in Section 4.2.3, which was based on
free-oscillation data for estimating the damping factor in a vibratory system
model. In addition, as discussed in Section 5.3.1, and later in Chapter 6, the
frequency-response function of a vibratory system also can be determined for
force inputs other than sinusoidal excitations.
5.3 Frequency-Response Function 207
7
The MATLAB function lsqcurvefit from the Optimization Toolbox was used.
0.1 1 10
40
30
20
10
0
10
20
H(Ω) (dB)
Ω
FIGURE 5.16
Logarithmic plot of H().

5.3.3 Sensitivity to System Parameters and
Filter Characteristics
In this section, we illustrate how the sensitivity of a mechanical system’s re-
sponse to an applied forcing is determined and how a mechanical system can
be viewed as a filter. The notions of sensitivity and filters are important for the
design of many mechanical systems, in particular, sensors used for vibration
measurements.
Sensitivity
The amplitude response of a single degree-of-freedom system can be used to
determine the response sensitivity. The system’s sensitivity is defined as the
ratio of the change in the displacement to a change in the applied force. Thus,
when 1, we find from Eq. (5.27) that the sensitivity as determined by
the response magnitude and force magnitude is
(5.38)
where x and F represent the changes in the response and force magnitudes,
respectively. Let us suppose that the parameters c and m are held constant and
that we consider two systems, one with a spring constant k
1
and another with
a spring constant k
2
. Then, the sensitivity for the first system is
(5.39)
Let
(5.40)
Furthermore, we have the following expressions for the corresponding natural
frequencies, static displacements, and damping factors of the two systems:
(5.41)
Then, from Eqs. (5.17) and (5.18), the sensitivity S
2
for the modified sys-
tem is given by
(5.42a)S
2
`
¢x
¢F
`
a
o
k
1
1
211 a
o
2
2
2
12a
o
z
1
2
2
z
2
c
21k
2
m
z
1
1a
o
z
1
c
21k
1
m
d
st2
mg
k
2
a
o
d
st1
v
n2
B
k
2
m
v
n1
1a
o
d
st1
mg
k
1
v
n1
B
k
1
m
a
o
k
1
k
2
0
S
1
1
k
1
S `
¢x
¢F
`
1
k
208 CHAPTER 5 Single Degree-of-Freedom Systems Subjected to Periodic Excitations
where the frequency ratio v/v
n1
. For 1, Eq. (5.42a) is approxi-
mated as
(5.42b)
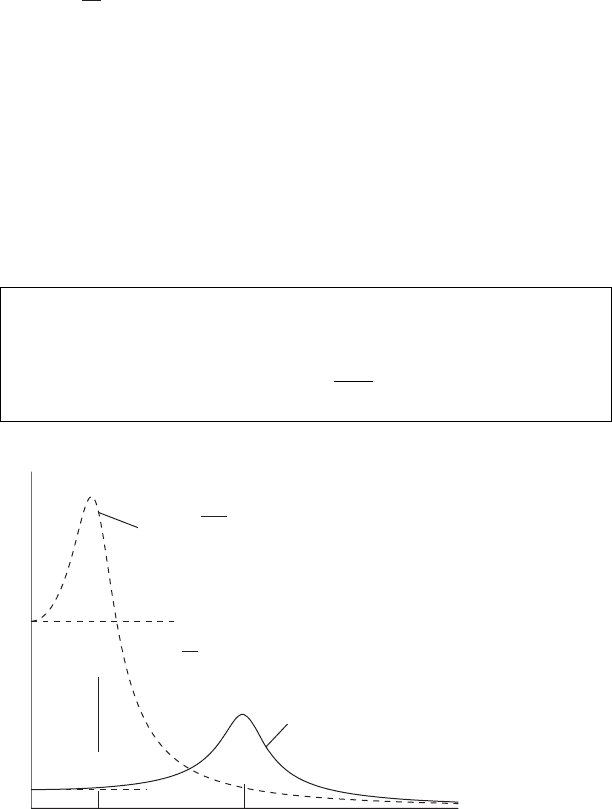
Equation (5.42a) is plotted in Figure 5.17 for a
o
1. We see from this
figure and from Eqs. (5.41) that as the sensitivity increases, the natural fre-
quency of the system decreases (and the static displacement increases) and
the damping ratio increases. This tradeoff between sensitivity and the location
of the natural frequency is important in the design of vibration sensors, where
a frequent desire is to have a device with a high sensitivity and a high natural
frequency.
8
This discussion presents a broader view of the ideas presented in
Example 3.7, where only the influence of the different system parameters on
z was discussed.
S
2
a
0
k
1
a
0
S
1
5.3 Frequency-Response Function 209
S
1
1/k
1
S
2
a
o
/k
1
v
n
1
vv
n
2
n
1
/√a
o
z
2
z
1
√a
o
z
1
Sensitivity
Frequency
FIGURE 5.17
Effect of change in sensitivity with respect to the natural frequency and damping ratio
when c and m remain constant: a
o
k
1
/k
2
0.
Design Guideline: If c and m are held constant and the stiffness of a
single degree-of-freedom system is changed from k
1
to k
2
, then the re-
sponse sensitivity of the system changes from S
1
to k
1
S
1
/k
2
and the
damping ratio changes from z
1
to z
1
1k
1
/
k
2
.
8
See, for example: S. Valoff and W. J. Kaiser, “Presettable Micromachined MEMS Accelerome-
ters,” 12th IEEE International Conference on Micro Electrical Mechanical Systems, Orlando, FL,
pp. 72–76, (January 1999); and A. Partridge, et al., “A High-Performance Planar Piezoresistive
Accelerometer,” J. Microelectromechanical Systems, Vol. 9, No. 1, pp. 58–65 (March 2000).