Balakumar Balachandran, Magrab E.B. Vibrations
Подождите немного. Документ загружается.


320 CHAPTER 6 Single Degree-of-Freedom Systems Subjected to Transient Excitations
To obtain x(t), we first make use of Eqs. (6.46) and (6.17). Thus, we
obtain
(6.55)
From the transform pairs 15 and 3 in Table A of Appendix A, the inverse of
X(s) given by Eq. (6.55) is
(6.56)
where, for the system with z 1,
(6.57)
and w is given by Eq. (6.8). It is noted that in this notation t v
n
t
(c
r
/
c
)(t/t
o
) and v
n
t
o
c
r
/
c
.
Equations (6.44), (6.48), (6.54), and (6.56) are plotted in Figure 6.24 for
two different values of z and three different values of
c
, which is the ratio of
the cutoff frequency to the system natural frequency. The displacement
response of the mass can be interpreted from the corresponding amplitude
spectrum. The displacement response for
c
0.04 is similar to the response
of the pulse train shown in Figure 5.41 and to the response to a step change in
the applied force, which is shown in Figure 6.10. In all three cases, the
oscillations about the respective steady-state positions are caused by spectral
components of the forcing that are in the frequency range of the single
degree-of-freedom system’s natural frequency. As discussed in Example 5.17,
the excitation components in this range are magnified by the system’s
frequency-response function. The period of these oscillations is equal to the
period of the damped natural frequency of the system. Thus, when damping
is increased, the magnitude and duration of the oscillations decrease, because
the magnification of the force’s spectral energy in this region is considerably
less than that when the damping is small. The amount of spectral energy in
the force’s pulse that is in the region of the system’s natural frequency is a
function of the cutoff frequency; the shorter the duration of the pulse, the
larger the amount of energy there is in the region of the system’s natural fre-
quency. In the limit, as the spectrum approaches that of the spectrum
of an impulse function; that is, one whose amplitude spectrum is constant
over the entire frequency range. For relatively long t
o
, the displacement
response of the linear single degree-of-freedom system resembles that of a
step response. As t
o
decreases, the displacement of the mass response looks
less and less like the form of the rectangular pulse, and as t
o
decreases still fur-
ther, the response approaches the system’s impulse response.
t
o
씮 0,
1
e
z1c
r
/
c
21t/t
o
2
21 z
2
sin31c
r
/
c
21t/t
o
221 z
2
w4
g1t 2 1
e
zv
n
t
21 z
2
sin1v
d
t w2
x1t 2
E
o
/k
2
c
3g1t2u1t 2 g1t t
o
2u1t t
o
24
X1s 2 G1s 2F1s2
F
o
m
c
1
sD1s 2
e
st
o
sD1s 2
d
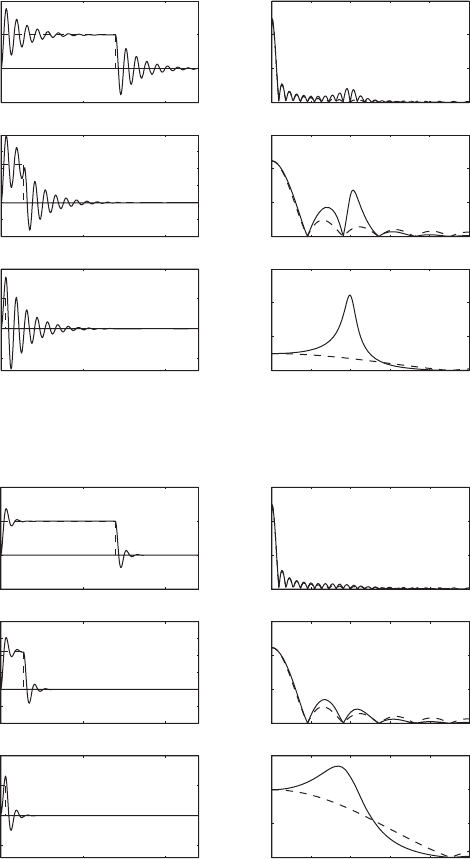
FIGURE 6.24
Comparison of responses to rectangular pulse in the time domain and the frequency domain for three different values of
c
v
c
/v
n
:
(a) z 0.08, and (b) z 0.3. Dashed lines are used to represent the applied force f(t)/E
o
in the time domain and the force amplitude
spectrum G
r
(v)/E
1
in the frequency domain. The solid lines are used to represent the displacement response x(t)/(E
o
/k) in the time do-
main and the displacement amplitude spectrum X
r
(v)/(E
1
/k) in the frequency domain.
Time domain Frequency domain
0 0.5 1 1.5 2 2.
5
0
2
4
6
0 50 100
0.2
0
0.2
0.4
Ω
c
0.04
0 0.5 1 1.5 2 2.5
0
1
2
3
Amplitude
0 50 100
0.4
0.2
0
0.2
0.4
0.6
0.8
Amplitude
0 0.5 1 1.5 2 2.5
0
2
4
6
Ω
0 50 100
1
0
1
2
t
(a)
Time domain Frequency domain
0 0.5 1 1.5 2 2.5
0
2
4
6
0 50 100
0.2
0
0.2
0.4
0 0.5 1 1.5 2 2.5
0
1
2
3
Amplitude
0 50 100
0.4
0.2
0
0.2
0.4
0.6
0.8
Amplitude
0 0.5 1 1.5 2 2.5
0
0.5
1
1.5
Ω
0 50 100
1
0
1
2
t
(b)
Ω
c
0.2
Ω
c
1
Ω
c
0.04
Ω
c
0.2
Ω
c
1
Ω
c
0.04
Ω
c
0.2
Ω
c
1
Ω
c
0.04
Ω
c
0.2
Ω
c
1

6.7 RESPONSE TO HALF-SINE WAVE PULSE
In the previous section, we introduced a relationship between the cutoff fre-
quency of the spectral content of the applied force to its duration. For pulse
shapes different from a rectangular shape, apart from the pulse duration, other
characteristics such as the rise time of the input can be used. Therefore, in
this section, we shall develop a relationship between the rise time of the
applied force and its cutoff frequency, and illustrate the effect on the system’s
response.
The force pulse is considered to have the form of a half-sine wave as
shown in Figure 6.25. Thus,
(6.58)
where the pulse duration is t
o
p/v
o
. From Section 6.3, the rise time of the
half-sine wave is
(6.59)
The Laplace transform of f(t) given by Eq. (6.58) is obtained from trans-
form pair 10 in Table A of Appendix A. Thus, we have
(6.60)
The corresponding spectrum of the half-sine wave force pulse is obtained by
setting s jv. This leads to
(6.61)
where the amplitude function G
hs
(v) is given by
(6.62)
and the phase function c(v) is given by
(6.63)c1v 2 tan
1
sin1pv/v
o
2
1 cos1pv/v
o
2
tan
1
atan
pv
2v
o
b
pv
2v
o
2F
o
v
o
p
4
for
v v
o
G
hs
1v 2
2F
o
v
o
2
cos3pv/12v
o
24
1 1v/v
o
2
2
2
for
v v
o
G
hs
1v2e
jc1v2
F
o
v
o
v
o
2
v
2
31 cos1pv/v
o
2 j sin1pv/v
o
24
F1jv2
F
o
v
o
v
o
2
v
2
31 e
jpv/v
o
4
F1s 2
F
o
v
o
s
2
v
o
2
31 e
ps/v
o
4
v
o
t
r
1.02
f 1t 2 F
o
sin1v
o
t23u1t2 u1t p/v
o
24
322 CHAPTER 6 Single Degree-of-Freedom Systems Subjected to Transient Excitations
0
0
1
f (t)/F
o
v
o
t
p
FIGURE 6.25
Half-sine force pulse.
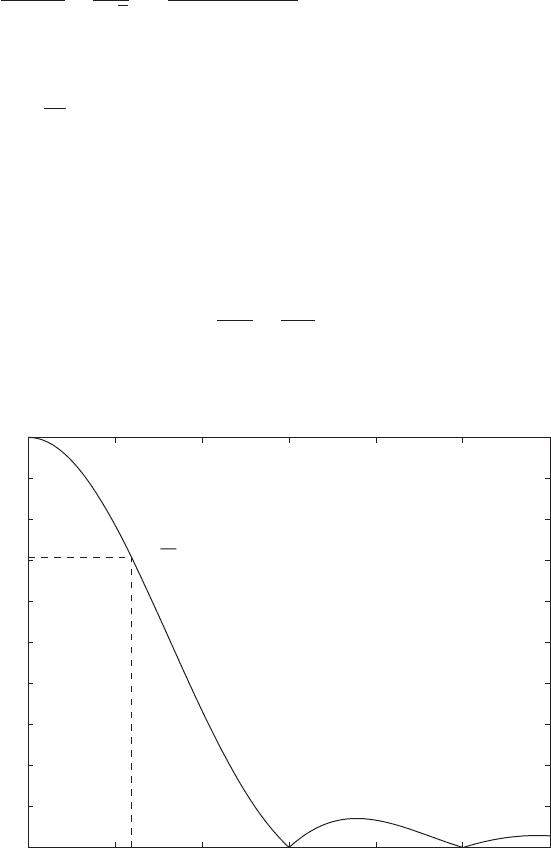
The function G
hs
(v) is plotted in Figure 6.26.
From Eq. (6.62), the cutoff frequency of the pulse’s amplitude density
spectrum is obtained from the numerical solution to
(6.64)
which leads to
21
(6.65a)
or, upon using Eq. (6.59),
(6.65b)
The total energy in the pulse is
(6.66)E
T
F
2
o
p/v
o
0
sin
2
1v
o
t2dt
F
o
2
p
2v
o
F
o
2
t
o
2
v
c
t
r
1.21
c
s
v
c
v
o
1.189
G
hs
1v
c
2
2F
o
/v
o
1
22
2
cos3pv
c
/12v
o
24
1 1v
c
/v
o
2
2
2
for
v
c
v
o
6.7 Response to Half-Sine Wave Pulse 323
21
The MATLAB function fzero was used.
0 1 2 3 4 5 6
0
0.1
0.2
0.3
0.4
0.5
0.6
0.7
0.8
0.9
1
v/v
o
G
hs
(v)/(2F
o
/v
o
)
v
c
/v
o
1.189
1/ √2
FIGURE 6.26
Amplitude density spectrum of half-sine wave pulse of duration p/v
o
.

Comparing this result with that shown in Eq. (6.45) for a rectangular pulse,
we see that the total energy of a half-sine wave whose duration is equal to that
of a rectangular pulse has one-half of the total energy of a rectangular pulse.
Notice that for the energy of the half-sine wave pulse to remain constant, ei-
ther F
o
or v
o
has to be adjusted so that F
o
varies as
The fraction of total energy that is in the frequency range 0 v v
c
is
(6.67)
where and the integral has been evaluated numeri-
cally.
22
Thus, 78.4% of the total energy of the half-sine wave pulse lies within
its bandwidth. In addition, it is numerically found that E(3)/E
T
0.995,
or about 99.5% of the energy of the half-sine pulse lies in the bandwidth
0 v 3v
o
.
Proceeding along the lines of the previous section used to determine the
displacement response function given by Eq. (6.54), we find that
(6.68)
where
(6.69)
o
v
o
/v
n
, c() is given by Eq. (6.63), and
The displacement of the mass is obtained by substituting Eq. (6.58) in
Eq. (6.1b), which yields
(6.70)
x1t2
E
so
/k
2
o
cu1t2
t
0
g1j,t 2dj u1t p/
o
2
t
p/
o
g1j,t2dj d
E
s1
B
8E
T
pv
n
X
s
1 2
1
2
o
211
2
2
2
12z2
2
2
cos1p/2
o
2
1 1/
o
2
2
2
X1jv2
E
s1
/k
X
s
1 2e
j1u12c122
x v/v
o
, c
s
v
c
/v
o
,
8
p
2
c
s
0
2
cos3px/2 4
1 x
2
2
2
dx 0.784
E1v
c
2
E
T
8
v
o
p
2
v
c
0
2
cos3pv/12v
o
24
1 1v/v
o
2
2
2
2
dv
2v
o
.
324 CHAPTER 6 Single Degree-of-Freedom Systems Subjected to Transient Excitations
22
The MATLAB function quadl was used.
Time domain Frequency domain
0 1 2 3
0
2
4
0 10 20 30 40
0.5
0
0.5
0 1 2 3
0
1
2
Amplitude
0 10 20 30
0.5
0
0.5
1
Amplitude
0 1 2 3
0
0.5
1
1.5
Ω
0 10 20 30
1
0
1
2
t
(b)
Time domain Frequency domain
0 1 2 3
0
2
4
0 10 20 30 40
0.5
0
0.5
Ω
o
0.1
Ω
o
0.3
0 1 2 3
0
1
2
Amplitude
0 10 20 30
0.5
0
0.5
1
Amplitude
0 1 2 3
0
2
4
6
Ω
0 10 20 30
2
0
2
t
(a)
Ω
o
1
Ω
o
0.1
Ω
o
0.3
Ω
o
1
Ω
o
0.1
Ω
o
0.3
Ω
o
1
Ω
o
0.1
Ω
o
0.3
Ω
o
1
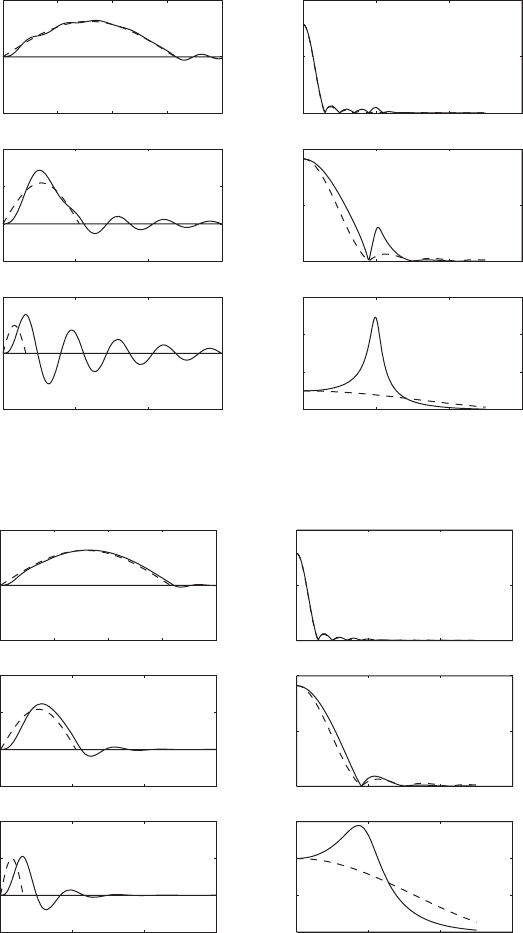
FIGURE 6.27
Comparison of responses to half-sine pulse in the time domain and the frequency domain for three different values of
o
v
o
/v
n
: (a) z 0.08, and (b) z 0.3. Dashed lines are used to represent the applied force f (t)/E
so
in the time domain
and the force amplitude spectrum G
hs
()/E
s1
in the frequency domain. Solid lines are used to represent the displacement
response x(t)/(E
so
/k) in the time domain and the displacement amplitude spectrum X
s
() in the frequency domain.
326 CHAPTER 6 Single Degree-of-Freedom Systems Subjected to Transient Excitations
23
Although the MATLAB function trapz can be used to solve Eq. (6.70), the MATLAB func-
tion ode45 was used instead to solve Eq. (3.8) with Eq. (6.58) as the forcing.
0 0.5 1 1.5 2 2.5 3
0
0.5
1
1.5
z
0.05
z
0.15
z
0.3
z
0.7
Ω
o
x
max
/(E
so
/k)
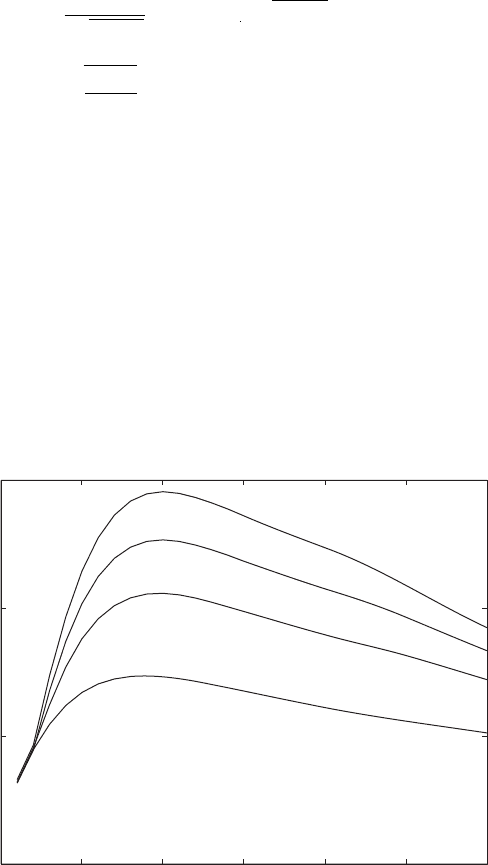
FIGURE 6.28
Maximum amplitude of response of single degree-of-freedom system to half-sine pulse for
different pulse durations and different values of damping factor.
where u(t) is the unit step function, t v
n
t, and
Equation (6.70) is solved numerically
23
and the results are shown in Figure
6.27. We see from Eqs. (6.65a) and (6.65b) that for a fixed v
n
, as
o
increases
v
c
increases and, therefore, the rise time decreases. The results of Figure 6.27
are examined in the same manner as was done for the results shown in Figure
6.24 for the rectangular pulse. The introduction of E
so
was made to ensure
that the response x(t) takes into account the differing amounts of spectral
energy in the pulse as
o
varies. This permits us to make comparisons of the
response x(t) for different
o
, since the input spectral energy is constant as
o
changes.
It is often of interest to determine the maximum of the displacement
response as a function of the pulse duration. In order to provide an idea of how
this maximum varies as a function of the frequency ratio
o
and the damping
E
so
B
2v
n
E
T
p
g1j,t 2
e
z1tj2
21 z
2
sin a1t j 221 z
2
bsin1
o
j2

6.7 Response to Half-Sine Wave Pulse 327
factor z, Eq. (6.70) is solved numerically
24
for the maximum displacement
x
max
and the results obtained are shown in Figure 6.28. It is seen from the
graphs that the maximum of the response decreases as the damping factor in-
creases and as the pulse duration decreases. The results are consistent with the
results presented in Figure 6.27.
EXAMPLE 6.8
Response to half-sine pulse base excitation
25
The governing equation describing the motion of a linear single degree-of-
freedom system with a moving base is given by Eq. (3.28). Rewriting this
equation in terms of the nondimensional time t v
n
t, we obtain
(a)
We also recall from Eq. (3.29) that the relative motion of the mass with re-
spect to the base is z(t) x(t) y(t). If we assume that the motion to the base
is a half-sine pulse of frequency v
o
and magnitude y
o
, then we can describe
the base motion as
(b)
where t
o
v
n
t
o
pv
n
/v
o
p/
o
,
o
v
o
/v
n
T
n
/(2t
o
), v
o
t
o
p, and
T
n
2p/v
n
is the period of the natural frequency of the single degree-of-
freedom system. After substituting Eq. (b) into the right-hand side of Eq. (a)
we obtain
(c)
where
(d)
and we have used Eq. (d) of Example 6.5.
3sin1
o
t2 2z
o
cos1
o
t243u1t 2 u1t t
o
24
f
b
1t 2 2z sin1
o
t23d1t 2 d1t t
o
24
d
2
x
dt
2
2z
dx
dt
x y
o
f
b
1t 2
y1t 2 y
o
sin1
o
t23u1t2 u1t t
o
24
d
2
x
dt
2
2z
dx
dt
x 2z
dy
dt
y
24
Although the MATLAB functions trapz and max can be used to solve Eq. (6.70) to obtain
x
max
, the MATLAB function ode45 was used instead to solve the Eq. (3.8) with Eq. (6.58) as the
forcing and the MATLAB function max was used to estimate x
max
.
25
Extensions of these types of models to include nonlinear springs and dissipative elements can
be found in the following studies: N. C. Shekhar et al., “Response of Nonlinear Dissipative Shock
Isolators,” J. Sound Vibration, Vol. 214, No. 4, pp. 589–603 (1998); and N. C. Shekhar
et al., “Performance of Nonlinear Isolators and Absorbers to Shock Excitation,” J. Sound Vibra-
tion, Vol. 227, No. 2, pp. 293–307 (1999).

328 CHAPTER 6 Single Degree-of-Freedom Systems Subjected to Transient Excitations
The solution to Eq. (c) is given by Eq. (5.2); that is, the convolution inte-
gral which, when written in terms of the nondimensional time variable t,
takes the form
(e)
where
(f)
After substituting Eqs. (d) and (f) into Eq. (e) and using Eq. (6.3), we obtain
(g)
where
(h)g
b
1j,t 2 3sin1
o
t2 2z
o
cos1
o
t24h1j,t2
x 1t2
y
o
k
c
t
0
g
b
1j,t 2dj u1t t
o
2
t
t
o
g
b
1j,t2djd
h1j,t 2
e
z1tj2
21 z
2
sin 321 z
2
1t j24
x1t2
y
o
k
t
0
h1j,t2f
b
1j 2dj
0 20 40 60 80
Ω
o
0.05
0 20 40 60 80
0.05
0
0.05
0 20 40 60 80
x(
t)/y
o
0 20 40 60 80
0.1
0
0.1
(x(t)
y(t))/y
o
0 20 40 60 80 0 20 40 60 80
0.2
0
0.2
0 20 40 60 80
0.5
0
0.5
1
1.5
0.5
0
0.5
1
1.5
0.5
0
0.5
1
1.5
0.5
0
0.5
1
1.5
t
0 20 40 60 80
0.5
0
0.5
t
(a) (b)
Ω
o
0.1
Ω
o
0.2
Ω
o
0.4
Ω
o
0.05
Ω
o
0.1
Ω
o
0.2
Ω
o
0.4
FIGURE 6.29
(a) Absolute displacement and (b) relative displacement of the mass of single degree-of-
freedom system subjected to half-sine wave displacement to the base with z 0.1.

The integral is solved numerically
26
and the results obtained for x(t)
and z(t) are shown in Figure 6.29, where we see that when
o
1, the
mass follows the movement of the base as if it were rigidly connected to it.
As
o
approaches 1, the mass amplifies the base motions and has large
excursions relative to the base. This example leads to the following design
guideline.
6.7 Response to Half-Sine Wave Pulse 329
L
st
x(t)
y(t)
c
mg
FIGURE 6.30
Base excitation of a single degree-
of-freedom system with a nonlinear
spring. L is the unstretched length
of the spring.
26
Although the MATLAB function trapz can be used to solve Eq. (g), the MATLAB function
ode45 was used instead to solve Eq. (c) with Eq. (d) as the forcing.
27
N. Chandra, H. Shekhar, H. Hatwal, and A. K. Mallik, “Response of non-linear dissipative
shock isolators,” J. Sound Vibration, Vol. 214, No. 4, pp. 589–603 (1998).
EXAMPLE 6.9 Single degree-of-freedom system with moving base
and nonlinear spring
27
Consider the single degree-of-freedom system whose base is subjected to a
known displacement y(t) as shown in Figure 6.30. The spring is nonlinear
with a force-displacement relationship given by Eq. (2.23); that is,
Then, carrying out the force balance for vertical motions of mass m, as dis-
cussed in Sections 3.2 and 3.4, we arrive at the following equation of motion
of the system
(a)
where x is measured from the static equilibrium position of mass m, y is the
absolute displacement of the base, and d
st
is the static deflection. From the
static equilibrium of the system, we have that
(b)
Upon substituting Eq. (b) into Eq. (a), we obtain
(c)mx
$
c1x
#
y
#
2 k1x y2 ka1x d
st
y2
3
kad
st
3
kd
st
kad
st
3
mg
mx
$
c1x
#
y
#
2 k1x d
st
y2 ka1x d
st
y2
3
mg
F1x 2 kx akx
3
Design Guideline: In order to minimize the amplification of the mo-
tion of the base of a single degree-of-freedom, one should keep the
pulse duration of the displacement applied to the base long compared
to the period of the natural frequency of the system. Stated differently,
for a given pulse loading it is preferable to have a system with as high
a natural frequency as possible to minimize the amplification of the
base motion.