Bhushan B. Handbook of Micro/Nano Tribology, Second Edition
Подождите немного. Документ загружается.


© 1999 by CRC Press LLC
(4.5.12)
where k(a) = 1/R is the curvature as a function of spot area, H is the surface hardness of the softer of
the two surfaces, and E is the elastic modulus of the equivalent surface (given in Equation 4.5.5) such
that φ = (πH/2E)
2
is a nondimensional material property. It is assumed that φ is independent of the spot
area a. This may not be a good assumption when the material hardness varies with the depth from the
surface as found in surface-hardened materials
(Suh, 1986). In such cases, the properties of the smaller
spots are determined by the material close to the surface, whereas those of larger spots are dictated by
the hardness deeper in the material. For simplicity, however, it will be assumed that the hardness H is a
constant although its dependence on depth or spot area can be included.
The criterion for the inception of plastic deformation is that δ > δ
c
. When the deformation is further
increased, the fraction of the load carried by the elastic deformation diminishes whereas that by plastic
deformation increases until the asperity is completely under plastic deformation
(Johnson, 1985). There-
fore, the transition between purely elastic to purely plastic is not drastic and occurs over a range of load
and deformation. In this study, however, we will assume the transition to be drastic to keep the analysis
simple. Since the deformation δ depends on the asperity size, a statistical estimate of d from the fractal
surface analysis is δ = G
(D–1)
a
(2–D)/2
. In addition, the curvature varies as k(a) = G
D–1
/a
D/2
. By using this in
Equation 4.5.12 and comparing it with δ, it can be derived that there exists a critical contact spot area
a
c
such that all spots smaller than a
c
deform plastically whereas those that are larger than a
c
deform
elastically. The relation for a
c
is given as follows:
(4.5.13)
The derivation above is true for fractal surfaces As discussed in Section 4.3.4, not all surfaces are fractal
and therefore a new method of characterizing rough surfaces was introduced. Using this technique a
good statistical estimate of the asperity deformation δ is V(a). By using Equation 4.5.12 for the critical
deformation δ
c
, the criterion for plastic deformation can be written as
(4.5.14)
Here Ψ(a) = V(a)k(a) is a nondimensional number which we call the “plasticity index.” Therefore, plastic
deformation occurs when the plasticity index is larger than a critical number φ which depends only on
material properties as
(4.5.15)
In this analysis, what is needed is dependence of V(a) and k(a) on the asperity base area a. The
generalized roughness analysis of Section 4.3.4 provides this data from the measured roughness.
Figure 4.27 shows the V vs. a and the k vs. a curves for the magnetic tape A surface. There exists a critical
contact spot area, a
c
, which demarcates the elastic and the plastic regime.
Figure 4.30 shows a plot of Ψ as a function of spot area, a, for the magnetic tape A whose roughness
statistics are shown in Figure 4.27. By using the values of H = 0.25 GPa and E = 1.75 GPa for the magnetic
tape contacting a flat hard plane, the critical plasticity index is found to be φ = 0.4 which is a horizontal
δφ
φ
c
H
E
RR
ka
=
π
==
()
2
2
aa aa a
G
ccc
D
<> =
−
()
plastic; elastic;
2
11
φ
Va
ka
Vaka
()
>
()
>=
()()
φ
φ or where ΨΨ
φ=
π
H
E2
2
© 1999 by CRC Press LLC
line in Figure 4.27. It is also found that the critical contact spot area is a
c
= 7 × 10
–15
m
2
or 0.7 µm
2
such
that all contact spots a < a
c
deform plastically whereas for those satisfying a > a
c
deform elastically. The
magnetic particles present on the magnetic tape are observed to be oblong with a length-to-width ratio
of about 10. Thus, contact would produce an approximately elliptical spot with the major axis L about
ten times the minor axis d . The area of the spot is therefore a = πLd = 10πd
2
. By equating this to 0.35 µm
2
,
the minor axis is found to be equal to d = 0.15 µm. This is approximately the diameter of the magnetic
particles observed by atomic force microscopy as shown in Figure 4.14. Thus, it can be concluded that
the individual magnetic particles deform plastically, whereas, when deformed together with other parti-
cles, they deform elastically. Such an analysis to determine the nature of deformation is very useful to
predict the type of surface wear and the failure mechanisms.
It is important to note that both the MB model and the generalized analysis show that smaller spots
tend to deform plastically whereas larger spots deform elastically. One may argue that this may be due
to the assumption of the fractal scaling behavior which surfaces do not always follow. However, the
generalized analysis makes no such assumptions and is obtained directly from raw data of roughness
measurements. Figure 4.30 clearly shows that the plasticity index for smaller contact spots are larger than
that of bigger spots. This prediction is radically different from the classical theories such as the GW
model which predicts just the opposite. The question is why there is so much of discrepancy.
The problem lies in the assumption of a constant radius of curvature R or a curvature k in the GW
model. Equation 4.5.12 will still hold since no assumption is made in its derivation. Plasticity will occur
when the asperity deformation V(a) is larger than δ
c
, V(a) > δ
c
. Now by Hertzian analysis, V(a) = a/πR
for an elastic contact (see Equation 4.5.6) with R assumed to be constant. Therefore, for plastic defor-
mation, the following condition must be met
(4.5.16)
It follows that all spots larger than a critical spot a
c
= πR
2
φ deforms plastically and all spots smaller than
this deform elastically, summarized as follows
(4.5.17)
FIGURE 4.30 Variation of the plasticity index, Ψ, on the contact spot area, a, for the magnetic tape A surface whose
roughness was measured by atomic force microscopy.
a
R
R
π
>φ
GW predictions: plastic
< elastic
2
aR
aR
>π
π
2
φ
φ
© 1999 by CRC Press LLC
This is exactly opposite of what the MB model and the generalized analysis predict. Since roughness
measurements at different resolutions will produce different values of R, as shown clearly in Figure 4.27,
the predictions of the elastic–plastic regime by Equation 4.5.17 will be misleading.
With regard to the predictions of the MB model and the generalized analysis, there is one question
that must be resolved. One may ask how is it that, under increasing load, smaller asperities under plastic
deformation may merge to form a larger spot which can be under elastic deformation. A qualitative
answer can be provided now since there is no experimental evidence yet. When the loads are low, only
small asperities are deformed. Since the radius of curvature of these asperities is small, these points have
high stress concentrations making plastic deformations likely. When the load is increased, they can merge
to form a larger spot with a higher radius of curvature. This can lead to stress relief and therefore a
change from plastic to elastic deformation. One must note that although the stress has reduced, the load-
bearing capacity can be increased since the area is increased by merging smaller spots into one large one.
Thus, increase in load does not necessarily mean higher local stresses.
When an asperity deforms elastically under a compressive load from a flat hard plane, the elastic load,
f
e
, and the asperity deformation, δ, can be obtained from Hertz’s analysis (Timoshenko and Goodier,
1970; Johnson, 1985) as
(4.5.18)
By using Equation 4.4.8 for the microcontact area, a, the elastic load can be written as a function of
contact spot area a as
(4.5.19)
When an asperity is under plastic deformation, we will assume a simple linear relation between the load
and the area as
(4.5.20)
where H is the surface microhardness. It is assumed here that H is a constant and does not vary with
depth. Nevertheless, a functional dependence of H with deformation δ and in turn the contact spot area,
a, can easily be incorporated. The total normal load on the surface can be calculated to be
(4.5.21)
Here a
c
is the critical spot area demarcating the elastic and the plastic regimes and a
L
is the largest spot
area. The first integral represents the total plastic load and the second term represents the total elastic
load. In Equation 4.5.21 it is assumed that a
L
> a
c
. If a
L
< a
c
, then the surface deformation will be
predominantly plastic and only the first term will remain in Equation 4.5.21.
The model for contact between fractal surfaces was first developed by Majumdar and Bhushan
(1991).
This subsection gives a synopsis of the model. A fractal surface is characterized by scaling behavior such
that the curvature follows the power law k(a) = G
D–1
/a
D/2
, where D is the profile dimension. Using this
in Equation 4.5.19, the elastic load on a single contact spot of area a becomes
(4.5.22)
fER
E
ka
e
==
()
4
3
4
3
12 32
32
12
δ
δ
fa
Ek a a
e
()
=
()
π
4
3
32
32
fa Ha
p
()
=
F f an ada f an ada
npp
a
ee
a
a
c
c
L
=
() ()
+
() ()
∫∫
0
fa
EG a
e
DD
()
=
π
−
()
−
()
4
3
13 2
32
© 1999 by CRC Press LLC
It is interesting to note that for a fractal surface, the load and the area are related by the power law f
e
≈
a
(3-D)/2
, whereas under the GW model the relation is f
e
≈ a
3/2
. The plastic load remains the same as that
given in Equation 4.5.20. The size distribution of contact spots for a fractal surface of profile dimension
D is given by Equation 4.4.4. By using this in conjunction with the elastic and microcontact load in
Equation 4.5.21 the total load can be found as
(4.5.23)
The real area of contact, A
r
, can be found using the fractal size distribution as
(4.5.24)
The linear relationship between A
r
and a
L
suggests that when a
L
> a
c
, the elastic load depends on the real
area of contact as F
e
≈ A
r
(3–D)/2
, whereas the plastic load varies as F
p
≈ A
r
D/2
. When a
L
< a
c
, then the
deformation is predominantly plastic and the load varies linearly with area as F
p
≈ A
r
.
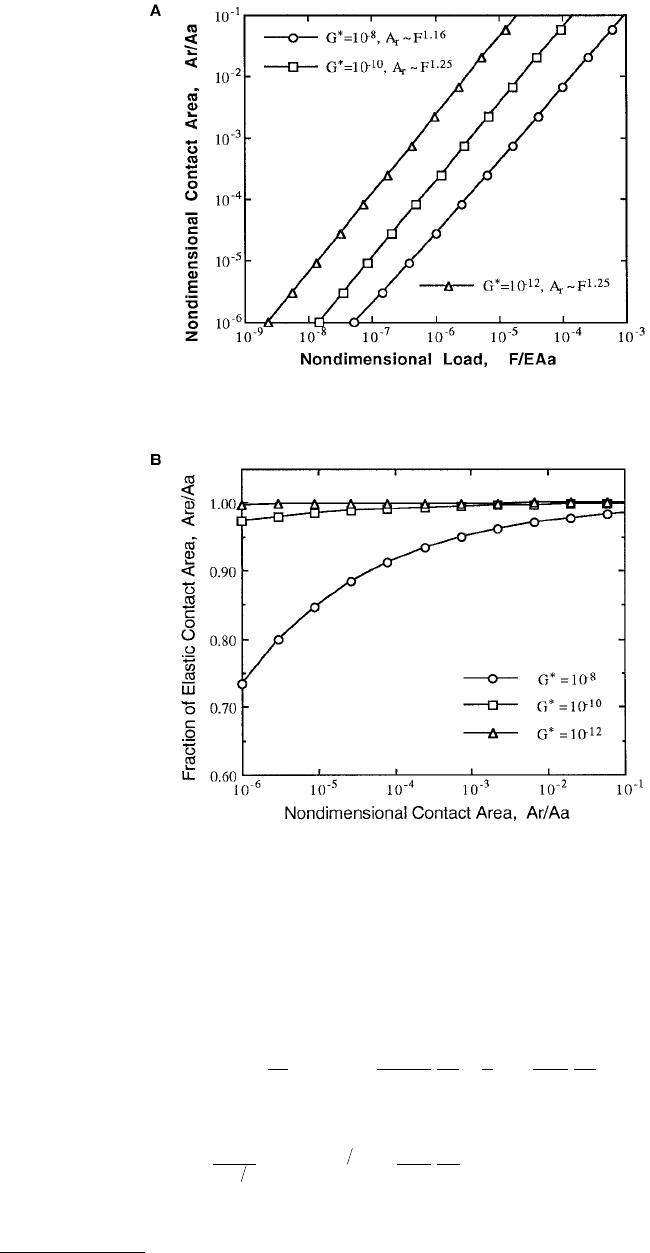
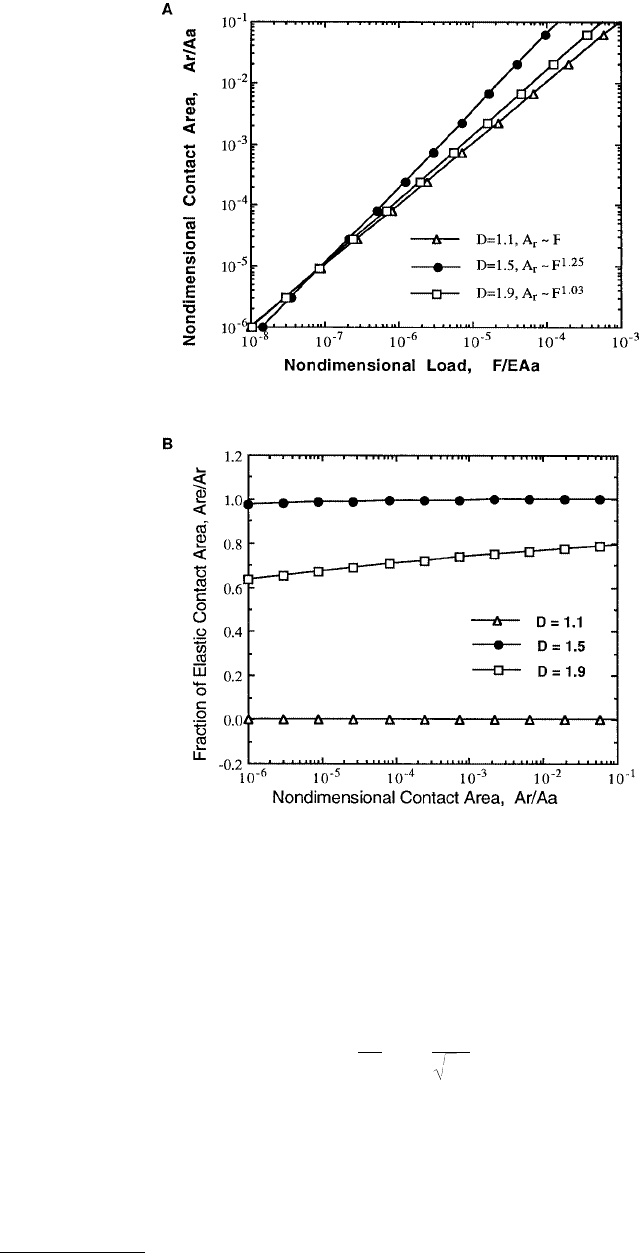
The main results of the fractal model are listed in Table 4.2. The predictions for the real area of contact
and fraction of elastic contact area are graphically shown in Figures 4.31a and 4.32a for variation of one
parameter keeping the others constant. Figures 4.31b and 4.32b correspondingly show the fraction of the
real area of contact in elastic deformation. For D = 1.5 and φ = 0.01 in Figure 4.31a, it is evident that as
G* = G/ is increased, the load required to produce a particular real area of contact increases. An
increase in G* implies, an increase in asperity deformation δ, which therefore requires a higher load.
Figure 4.31b shows that as G* is increased, the percentage of elastic contact decreases. This is because
increase in G* increases the critical spot area, as given by Equation 4.5.13, thus increasing the plastic
regime and reducing the elastic regime. Also, when the real area of contact is increased, the fraction of
elastic contact area increases. This results from merging of small contact spots in plastic deformation to
form larger spots in elastic deformation.
The effects of fractal dimension on the real area of contact and elastic contact area is interesting indeed
and are shown in Figure 4.32 for G* = 10
–10
and φ = 0.01. It is observed that as the value of dimension
is increased, the real area of contact first increases until D = 1.5 and then decreases for D = 1.9 for a
given load. A similar reversal is observed for the fraction of elastic contact area in Figure 4.32b. The
reason for this behavior is that as the dimension is increased from 1.1 to 1.9, the value of a
c
*= a
c
/A
a
decreases from 10
16
to 10
–16
, respectively, for the above values of G
*
and φ. Therefore, for D = 1.1, all the
contact spots are smaller than the critical contact area and so in plastic contact as evident in Figure 4.32b.
As D is increased, the value of a*
c
decreases which results in a larger number of elastic contact spots.
Therefore, the fraction of elastic contact area for D = 1.5 is nearly unity. As the value of D is further
increased, the critical area decreases further and one may expect that the fraction of elastic contact should
increase. However, as D is increased, the number and the contribution of smaller contact spots to the
total area become significant as suggested by the size distribution. The increase in the value of fractal
dimension therefore leads to two competing effects — the critical contact area decreases and the number
of contact spots below the critical increases. This results in the reversal behavior.
F
DHa
da
a
DEG a
da
a
DHa a
D
DEG a
D
a
a
n
L
D
D
a
D
L
D
D
a
a
L
D
c
DD
L
D
c
L
D
c
c
L
=+
π
=
−
()
+
π−
()
−
∫∫
−
()
−
−
()
−
()
−
()
−
()
2
2
0
1
2
32
2
22 132
32
32 2
2
2
3
2
4
332
1
1
2
forfor
for
.
ln .
D
Ha a
EG a a
a
D
Lc
LL
c
≠
=+
π
=
15
315
34 14
12 34
32
A n a ada
D
D
a
r
a
L
L
=
()
=
−
∫
0
2
A
a
© 1999 by CRC Press LLC
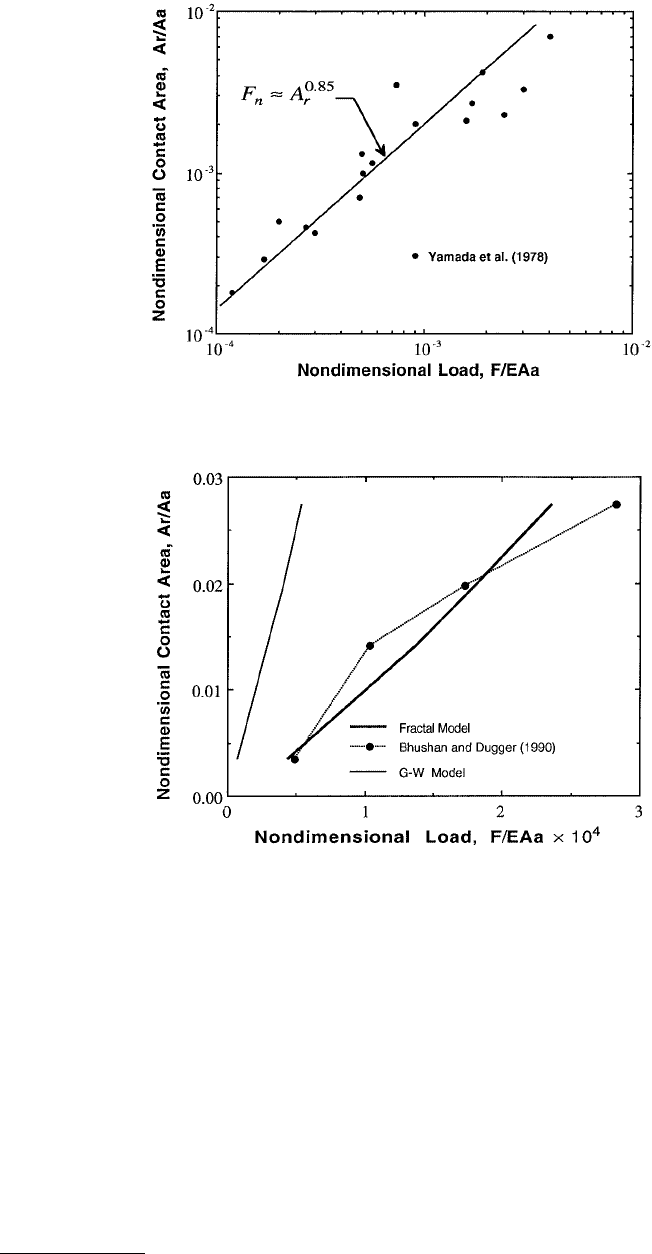
Figure 4.33 shows the experimental results for two Pyrex glass surfaces compressed against each other
(Yamada et al., 1978). It can be observed that the area–load relation is A
r
≈ F
1.19
. The exponent corresponds
to a fractal dimension of the surface profile to be 1.4 and of the surface to be 2.4. Note that for F
n
/EA
a
>
2 × 10
–3
the experimental results start to deviate from the predictions. It is speculated that this may be
due to interactions between asperities in contact which has been neglected in the fractal model. Figure 4.34
shows the comparison between the predictions of the GW model, the fractal model, and experiments
on contact between a magnetic thin-film rigid disk and a planoconvex lens (Bhushan and Dugger, 1990).
The predictions of the fractal model are evaluated for experimentally observed values of D = 1.38
(Majumdar and Bhushan, 1990)
and φ = 0.05
(Bhushan and Doerner, 1989)
for disk type C, and an
assumed value for G
*
= 10
–10
for curve fitting. It can be seen that, first, the trends of the fractal model
are in better agreement than that of the GW model. In addition, the GW model predicts a linear load–area
relation which is not observed experimentally. However, one should note that having four data points
in Figure 4.34 may not provide enough evidence for the validity of the fractal model. In that respect,
Figure 4.33 provides a more conclusive agreement between theory and experiments.
4.5.3 Generalized Model for Fractal and Nonfractal Surfaces
The structure function data of several types of machined metals, thin-film disks, and magnetic tape in
Section 4.3.3.3 show such surfaces have a multiscale structure and yet do not necessarily follow a fractal
scaling behavior over all length scales. For such surfaces neither the GW model nor the fractal model
can be used. A more generalized analysis is therefore necessary and is developed here for the first time.
In Section 4.4.2 we saw that the size distributions for elastically and plastically deformed asperities are
not the same as was assumed in the fractal analysis. By using the size distributions for elastic
TABLE 4.2 Profile Structure Function, Critical Contact Spot, Size-Distribution of Spots, Real Area of Contact,
Fraction of Elastic Contact Area and Total Load — Predictions of Fractal Contact Model
Surface profile structure function
Critical contact for spot area
Size-distribution of contact spots,n(a)
Real area of contact
Fraction of elastic contact area
Total elastic-plastic load (a
ı
> a
c
)
Total plastic load (a
ı
< a) F
n
= HA
r
Fana
f
L
=
() ()
∫
τ
0
a
G
HE
c
D
=
π
()
−
()
2
11
2
na
D
a
a
L
D
D
()
=
+
2
2
21
A
D
D
a
rL
=
−2
A
A
Da
DA
re
r
c
r
D
=−
−
()
−
()
1
2
22
F
DHa a
D
DEG a
D
a
a
D
Ha a
EG a a
a
n
L
D
c
DD
L
D
c
L
D
Lc
LL
c
=
−
+
π−
−≠
=+
π
−−−
−
() ()()
()
()
()
2
22 132
32
32 2
34 14
12 34
32
2
4
332
115
3
.
ln
for
for DD = 15.
© 1999 by CRC Press LLC
(Equation 4.4.10) and plastic (Equation 4.4.20) contact spots, the total load can be found from
Equation 4.5.23 to be
(4.5.25)
FIGURE 4.31 Effect of varying roughness parameter G on (a) real area of contact (b) fraction of real area of contact
in elastic deformation.
FgdA
H
ka
ka
dk
da
a
ka
dk
da
da
E
kaa
a
ka
dk
da
da
na
a
a
a
c
c
L
=
()
π
()
−
π
()
++
()
+
π
()
+
()
∫
∫
0
3
52
212
2
1
2
1
4
3
1
φ
© 1999 by CRC Press LLC
We saw earlier in Section 4.4.2 that the largest contact spot area, a
L
, is related to the surface mean
separation d/σ by Equation 4.4.22. Therefore, Equation 4.5.25 establishes a relation between the total
compressive load, F
n
, and the separation d/σ. If a Gaussian height distribution is assumed for the magnetic
tape, the real area of contact is related to the separation as
(4.5.26)
To solve the integrals in Equation 4.5.25 we need the relation between the curvature k(a) and the
contact spot area, a. In the fractal model a scaling relation of the form k(a) = G
D–1
/a
D/2
is assumed. In
contrast, the generalized model does not make any assumption for the curvature k(a) but directly uses
the experimental roughness data that is processed by the generalized characterization techniques
FIGURE 4.32 Effect of varying roughness parameter D on (a) real area of contact (b) fraction of real area of contact
in elastic deformation.
A
A
d
r
a
=
2
2
erfc
σ
© 1999 by CRC Press LLC
described in Section 4.3.4. We demonstrate the application of the generalized analysis by studying the
contact between magnetic thin-film rigid disk C and a hard Pyrex glass surface. The hardness of the
magnetic film is H = 6.2 GPa and the elastic modulus of the equivalent surface is E = 52 GPa. Figure 4.16
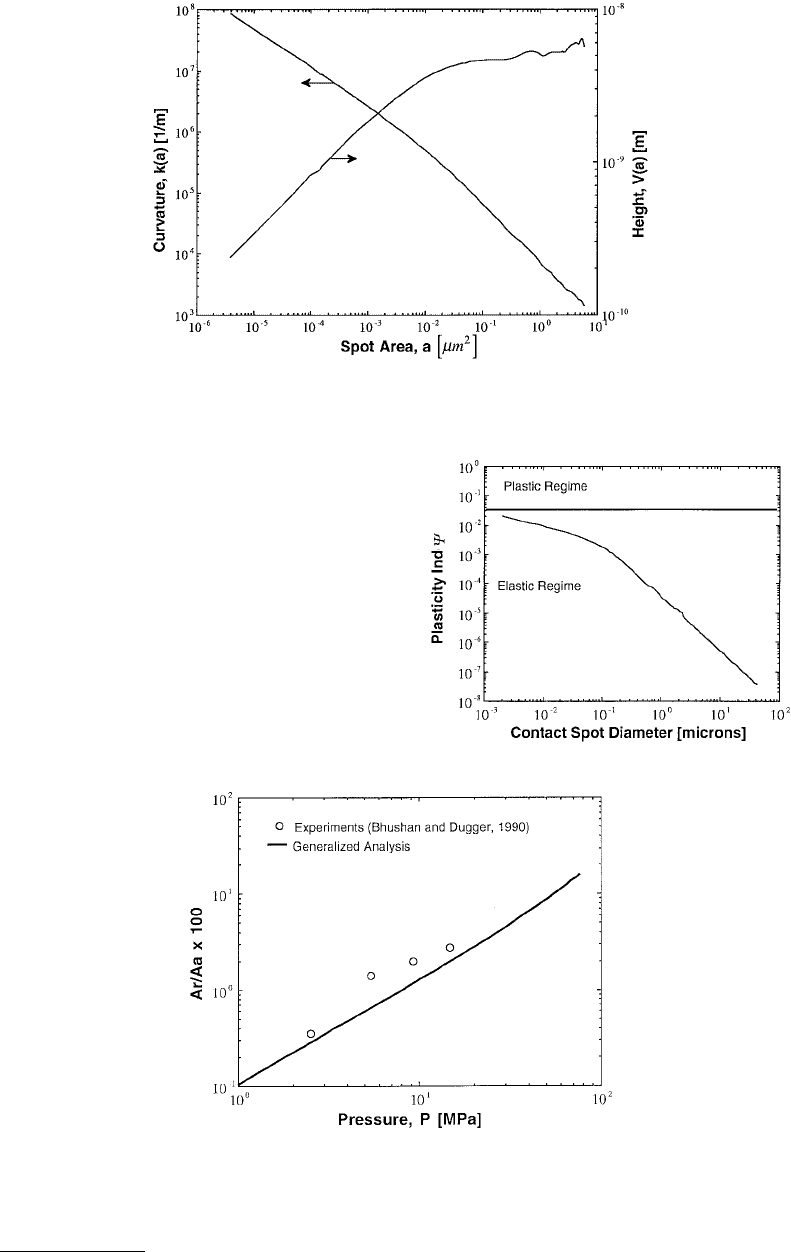
shows the surface image of disk C, whereas Figure 4.17 shows its structure function. Figure 4.35 plots
the surface height, V(a) and the curvature k(a) as a function of spot area, a, for this rough surface. This
data can be used in Equation 4.5.25 along with numerical integration of the integrals to obtain the normal
load. Figure 4.36 shows the elastic–plastic regime map for the this surface. Using the values of hardness
and elastic modulus, the critical plasticity index is equal to φ = 0.035. The plasticity index, Ψ = V(a)k(a)
is found to be always less than φ, thereby leading to the conclusion that all the asperities deform elastically.
Figure 4.37 compares the results of the generalized theory and the experiments (Bhushan and Dugger,
1990) in terms of the apparent pressure, F
n
/A
a
and the nondimensional real area of contact, A
r
/A
a
. Not
only are the trends quite similar, the values for the predicted A
r
/A
a
are reasonably close to those measured.
FIGURE 4.33 Comparison between predictions of fractal model and experiments of Yamada et al. (1978).
FIGURE 4.34 Comparison among predictions of the fractal model, the GW model, and experiments of Bhushan
and Dugger (1990) for contact of a magnetic rigid disk.
© 1999 by CRC Press LLC
FIGURE 4.35 Plot of surface height, V(a) and curvature k(a) for the magnetic thin-film rigid disk C surface used
in the computations of the generalized model.
FIGURE 4.36 Elastic–plastic regime of the magnetic
thin-film rigid disk surface. The critical plasticity index
φ = 0.035.
FIGURE 4.37 Comparison of the experimental data (Bhushan and Dugger, 1990) and the predictions of the
generalized theory for the magnetic thin-film rigid disk C in terms of compressive apparent pressure, F
n
/A
a
, and the
nondimensional real area of contact, A
r
/A
a
.
© 1999 by CRC Press LLC
Keeping in mind the variability of surface mechanical properties, particularly for thin films, the agreement
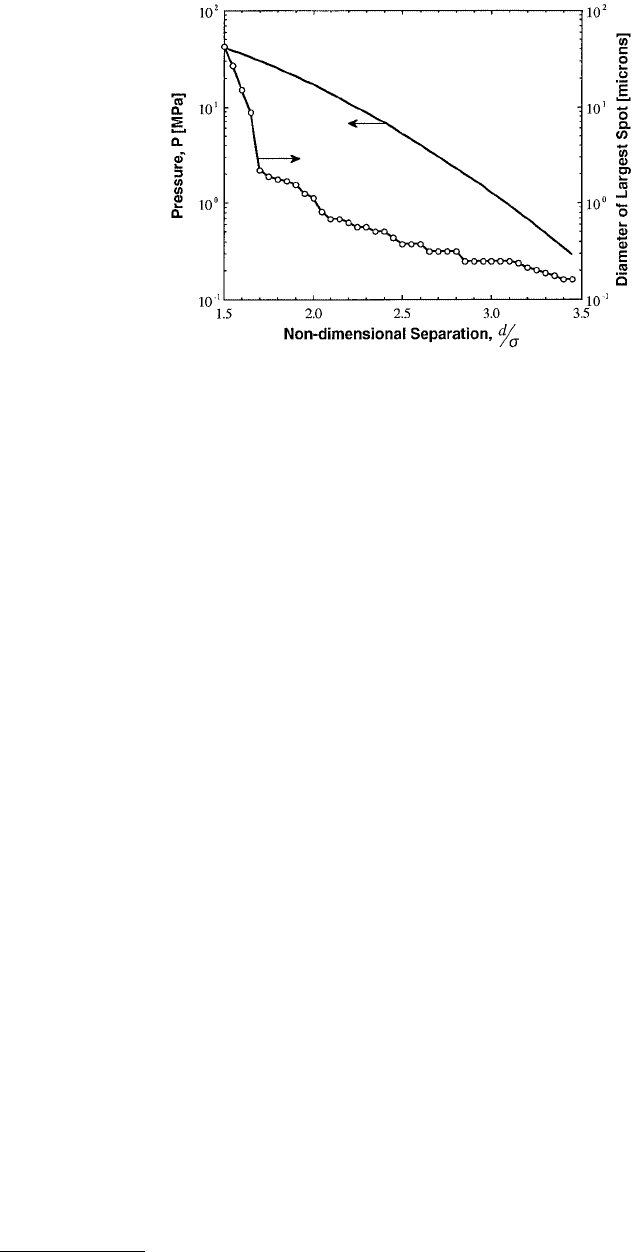
is quite good and any better agreement would only be by chance. Figure 4.38 shows the predicted
compressive pressure and the diameter of the largest contact spot as a function of the nondimensional
separation, d/σ. It is evident that the largest spot size decreases drastically as the separation is increased
slightly.
Figure 4.39a shows histograms of the experimentally (Bhushan and Dugger, 1990) obtained size dis-
tribution n(a)∆a/A
a
per 1 mm
2
of the apparent area, A
a
, of rigid disk C. The observations were made by
an optical microscope. The contact spots are placed into bins of different spot areas and then the numbers
are counted for each bin. The two sets of data are for A
r
/A
a
= 1.64 and 2.51%. The general trend is that
as the size of the contact spot decreases, the number of contact spots increases. To obtain the contribution
of contact spots of a particular size to the real area of contact, A
r
, Figure 4.39b plots the product of
an(a)∆a/A
a
as a percentage. Therefore, this plot shows that when A
r
/A
a
= 2.51%, contact spots of area
100 µm
2
contribute 1.46%, those of area 67.83 µm
2
contribute 0.35%, and those of 30.91 µm
2
contribute
0.91%, and so on. If the percentages of each bin are added up, it should equal to the real area of contact
A
r
/A
a
= 2.51%. However, an addition of the percentages of individual bins equals 3.33%. Similarly when
the real area of contact is claimed to be A
r
/A
a
= 1.64% the addition shows the fraction to be 4.32%.
Therefore, there could be some margin of error in these measurements. Nevertheless, we compared the
cumulative size distribution obtained from the experimental data with that of the predictions of the
generalized theory in Figure 4.40. The agreement between the theory and experiments is quite poor. It
is difficult to say which one is more accurate. The experiments may have flaws as discussed in Figure 4.39b.
In addition, contact spots smaller than 1 µm are near the limit of optical diffraction. Therefore, the
accuracy in observing and counting spots may be poor in this range. This could perhaps explain the
discrepancy for small length scales. With regard to the predictions, they depend on accurate statistics of
the surface roughness. The statistics seem to be accurate for small length scales since the data set needed
for making roughness averages described in Section 4.3.4 is quite large. In contrast, the roughness statistics
may not be accurate for large length scales since the averages needed for accurate roughness character-
ization are made over very few data points and therefore may not be good representative numbers.
However, the optical observations of the contact spots are quite accurate in this size range since this is
well above the optical diffraction limit. In summary, the discrepancy for small and large spots could be
attributed to measurements and observations. It is encouraging to see that at intermediate length scales,
the agreement between theory and experiments is not that terrible.
FIGURE 4.38 Plot of the apparent pressure, F
n
/A
a
, and the diameter of the largest spots size as a function of the
nondimensional surface separation, d/σ.