Bhushan B. Handbook of Micro/Nano Tribology, Second Edition
Подождите немного. Документ загружается.

© 1999 by CRC Press LLC
approach at a constant loading rate, the indenter is first loaded and unloaded typically three times in
succession at a constant loading rate or displacement rate with each of the unloadings terminated at
about 10 to 20% of the peak loading or displacement, respectively, to assure that contact is maintained
between the specimen and the indenter. In a typical indentation experiment, it is usual to have two hold
segments, the first one at the end of unloading to 10 to 20% after multiple loading/unloading cycles and
the second one at the peak load just before final unloading. The reason for performing multiple loadings
and unloadings is to examine the reversibility of the deformation (hysteresis) and thereby making sure
that the unloading data used for calculation of the modulus of elasticity are mostly elastic. In some
materials, there may be a significant amount of creep during the first unloading; thus, displacement
recovered may not be entirely elastic, and because of this, the use of first unloading curves in the analysis
of elastic properties can sometimes lead to inaccuracies. One way to minimize nonelastic effects is to
include peak load hold periods in the loading sequence to allow time-dependent plastic effects to
diminish. In addition, after multiple loadings, the load is held constant for a period of typically 100 s at
10 to 20% of the peak value while the displacement is carefully monitored to establish the rate of
displacement produced by thermal expansion in the system. To account for thermal drift, the rate of
displacement is measured during the last 80 s of the hold period, and the displacement data are corrected
by assuming that this drift rate is constant throughout the test. Following this hold period, the specimen
is loaded for a final time, with another 100 s hold period inserted at peak load to allow any final time-
dependent plastic effects to diminish, and the specimen is fully unloaded. The final unloading curve is
used for calculations of modulus of elasticity.
For an indentation experiment, the sample is placed on the mounting block. An appropriate region
is selected by observing through the optical microscope. In a typical experiment, the tip of the indenter
is moved toward the surface of the sample by gradually increasing the load on the indenter shaft. With
a constant loading rate of typically 1 µN/s, the tip of the indenter travels downward at a velocity (approach
rate) of about 10 nm/s. When the tip contacts the surface, its velocity drops below 1 nm/s, and the
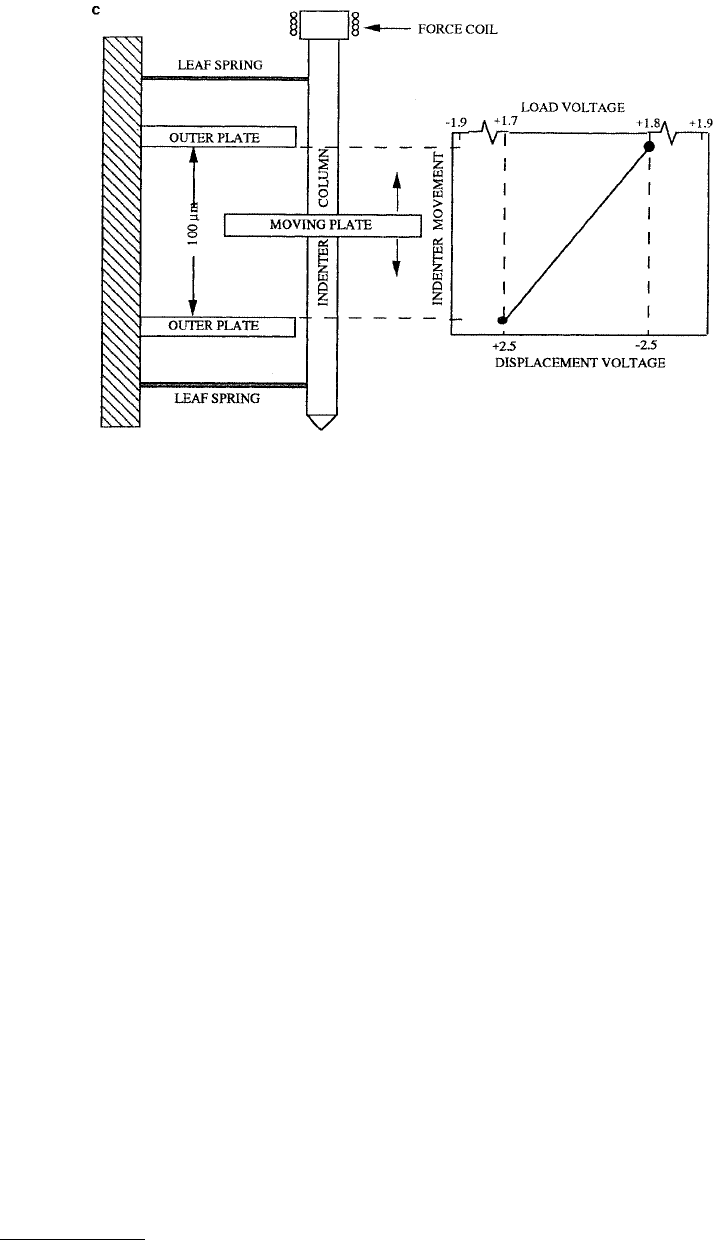
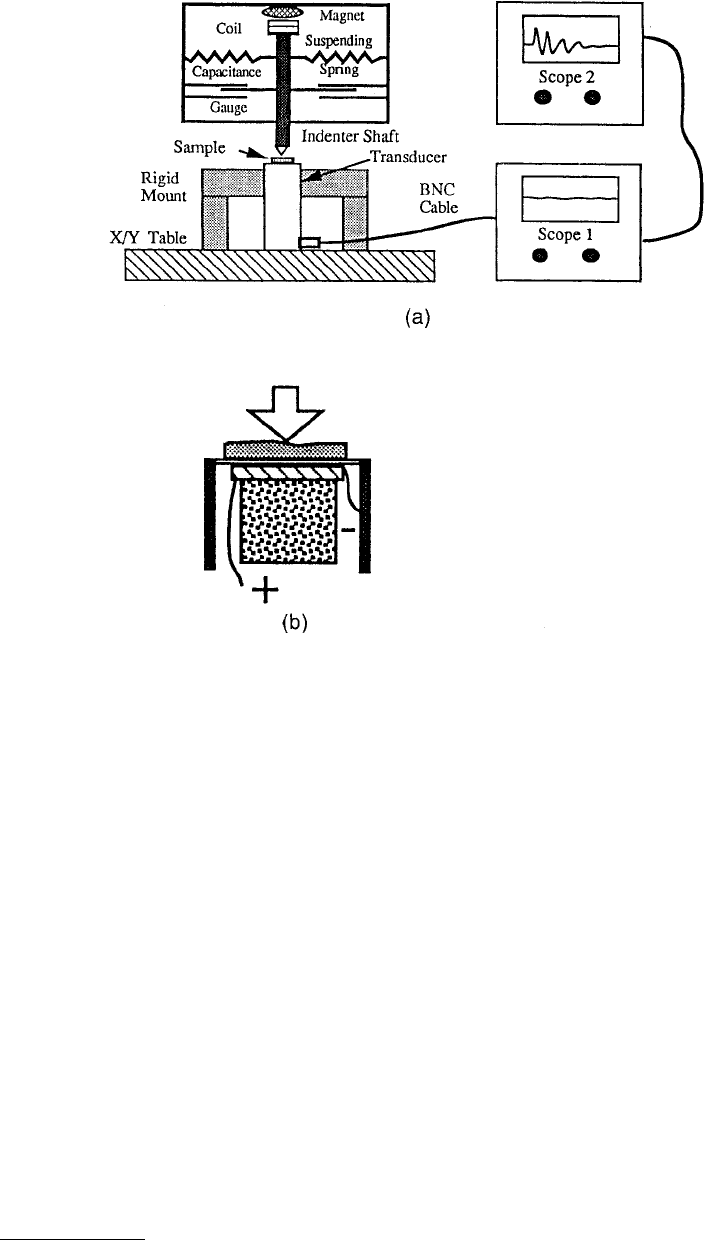
FIGURE 10.13 Schematics of the Nanoindenter II, (a) showing the major components — the indenter head, an
optical microscope, and an X–Y–Z motorized precision table, (b) showing the details of indenter head and controls
(microscope, which is directly behind the indenter, and the massive U bar are not shown for clarity), (c) showing
the three-plate capacitor and indenter column that form the displacement-sensing system (not to scale). For the sake
of clarity, only the left halves of the 50-mm-diameter, circular outer plates of the capacitor are shown. (Courtesy of
Nano Instruments, Knoxville, TN.)
© 1999 by CRC Press LLC
computer records the displacement of the tip. This is the point at which the indentation experiment
begins. The load is incremented in order to maintain a constant loading rate of about 10% of peak load/s
or to maintain a constant displacement rate of 10% of peak displacement/s. The drift rate of the
nanoindenter is about 0.01 nm/s; therefore, a loading duration of 10 s minimizes the measurement errors.
Loading is followed by unloading and multiple loading/unloading and hold cycles.
Now we describe various steps in some detail based on Anonymous (1991). The first step is always
the “Approach segment” in which the tip makes contact with the sample surface. The purpose of the
approach segment is to determine accurately the “zero” of the indenter tip, that is, the values of the load
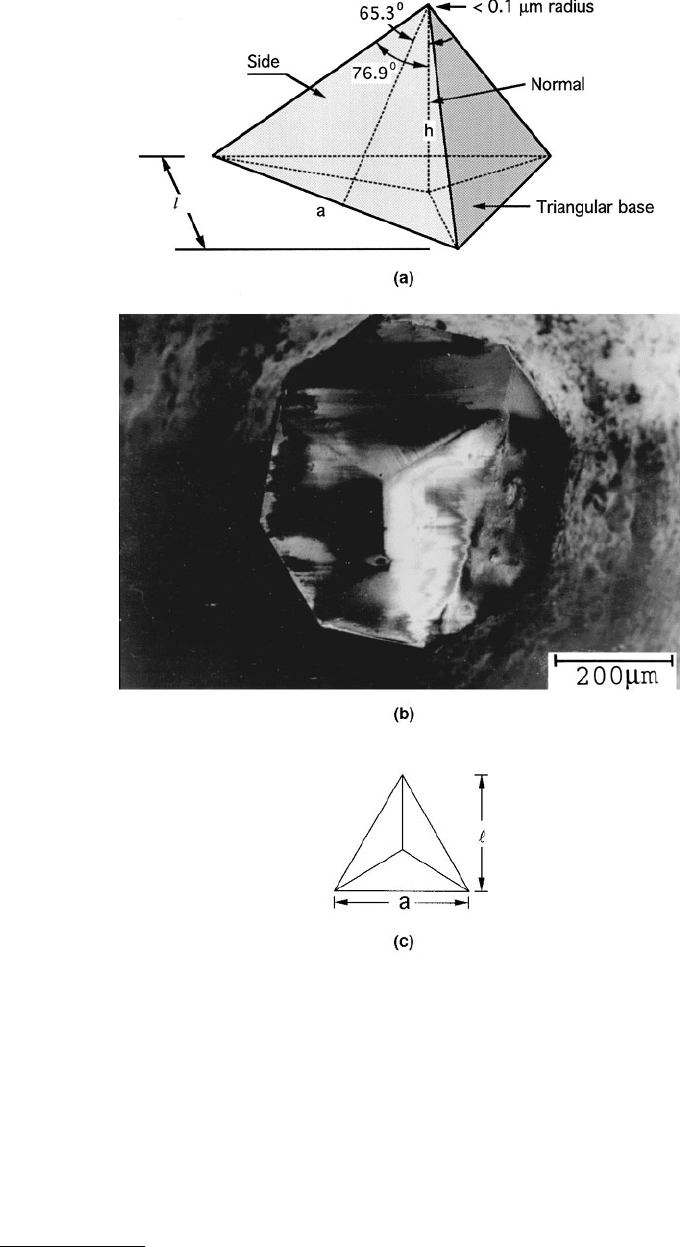
FIGURE 10.14 (a) Schematic, (b) photograph of the shape of a Berkovich indenter, and (c) indent impression.
© 1999 by CRC Press LLC
and displacement at the point where the tip just touches the sample surface. Based on Anonymous (1991),
these values are obtained in the following manner. The computer moves the sample from the microscope
to a point below the indenter such that the position selected for the initial indent is offset from the
indenter by a user-selected distance and angle (the default values are 50 µm and 180°). With the center
plate of the capacitor (to which the indenter is attached) on its bottom stop, the table moves upward at
a relatively high rate of speed until the indenter contacts the surface and makes the initial surface-finding
indent. When contact occurs, the indenter is pushed upward, tripping the Z-motor interrupts and
stopping the Z-motor of the table. The table is then moved downward at slow speed for 15 s before being
moved in the X, Y plane until the point on the sample halfway between the initial surface-finding indent
and the location of the first indent is under the indenter. The table is now raised once more, but at slow
speed until contact with the specimen is made once more. This second contact gives the best estimate
of the surface elevation that can be obtained by moving the table alone.
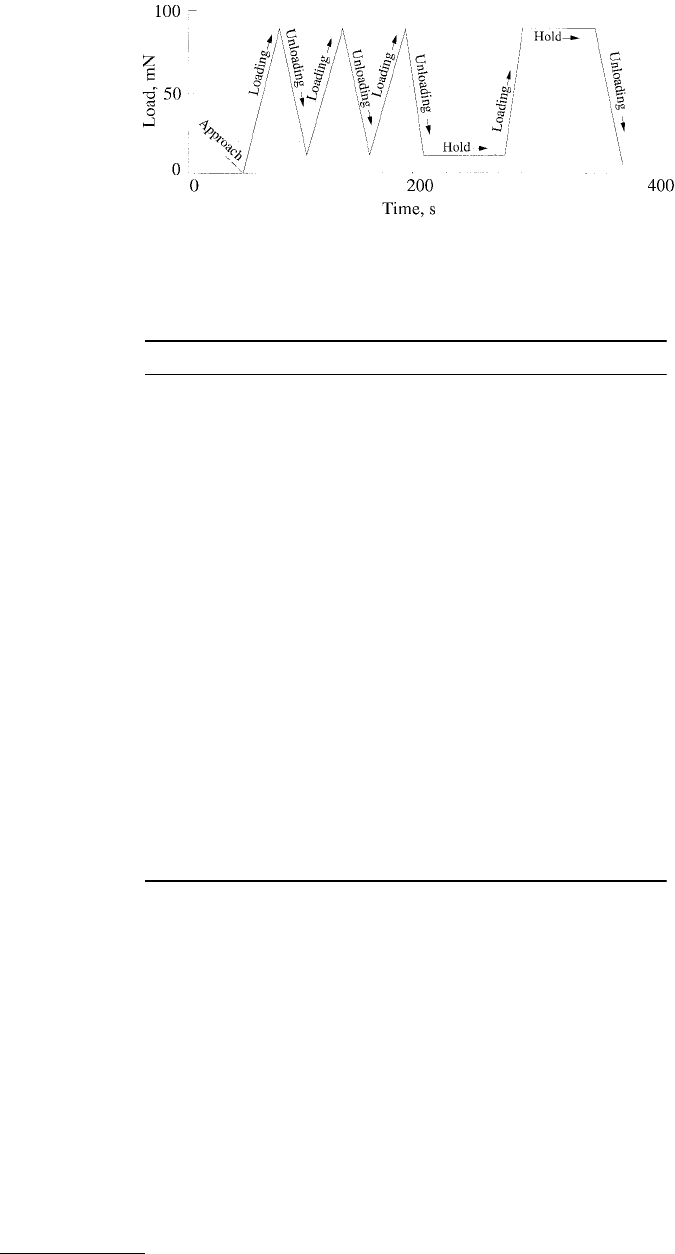
FIGURE 10.15 Different segments of a typical constant-loading indentation experiment.
TABLE 10.2 Examples of Two Typical Indentation Experiments
Segments
a
Rate Maximum Value
(a) Constant Loading Experiment
Approach 10 nm/s —
Loading at constant loading rate 12 mN/s 120 mN
Unloading at constant unloading rate 12 mN/s 10–20% of 120 mN
Multiple loading/unloading cycles
(typically three times)
•
•
Hold for 100 s Data rate 1/s 100 points
Loading at constant loading rate 12 mN/s 120 mN
Hold for 100 s Data rate 1/s 100 points
Unloading at constant unloading rate 12 mN/s 0 mN
(b) Constant Displacement Experiment
Approach 10 nm/s —
Loading at constant displacement rate 20 nm/s 200 nm
Unloading at constant displacement rate 20 nm/s 10–20% of 200 nm
(typically three times)
•
•
Hold for 100 s 1 point/s 100 points
Loading at constant displacement rate 10 nm/s 200 nm
Hold for 100 s 1 point/s 100 points
Unloading at constant displacement rate 10 nm/s 0 nm
a
In routine experiments the number of segments does not exceed more than
12, but if needed this number could be high.

© 1999 by CRC Press LLC
After this second surface-finding indent is made, the indenter is left in contact with the surface under
a very small load with the displacement-sensing capacitor near the center of its travel. At this point the
system is allowed to monitor changes in indenter displacement under constant load, and when the drift
rate becomes smaller than the user-prescribed maximum (usually 0.05 nm/s), the displacement of the
indenter is recorded, establishing an initial estimate of the elevation of the sample surface.
The indenter is then raised to near the top of its travel using the coil/magnet assembly (the elevation
of the table remains fixed for the rest of the experiment), and the table is moved so that the chosen location
for the first indent of the specified shape is under the indenter. The indenter is now lowered toward the
surface at a rate of several hundred nanometers per second until the “surface search distance” is reached.
The surface search distance is a user-specified distance (usual 1000 to 2000 nm) above the estimated
elevation of the sample surface. At this point, the rate of approach to the surface is decreased to approx-
imately 10 nm/s, and the load–displacement values that are constantly recorded are used to calculate the
stiffness of the system as reflected initially in the stiffness of the very flexible leaf springs that support the
indenter shaft. When the indenter finally reaches the surface, a large increase in stiffness is sensed, and
when the stiffness increases by a factor of 4, the approach phase of the indentation process is complete.
The computer now discards all but the last 50 sets of load–displacement data taken during the
approach. A plot of load vs. displacement for these data reflects the point of contact of the indenter with
the sample surface in terms of a very sharp change in slope of the load–displacement plot (see
Figure 10.16). For an approach rate of 10 nm/s and factor of four increase in stiffness, experience has
shown that surface contact is made at the 13th or 14th data point from the end of the 50-data-point set.
The zero points for both load and displacement are then taken as the averages of the loads and displace-
ments of 12th and 13th data sets from the end of the approach data. For many materials this procedure
identifies the sample surface to within 0.1 to 0.2 nm. However, for very soft materials such as many
polymers or for other approach rates and stiffness-factor increases, the user may find it advisable to plot
the approach segment data and, if necessary, change the algorithm used to define the precise point of
contact with the sample surface.
Once surface contact is established, the other segments of the indentation process are carried out as
prescribed in the programmed indentation experiment. The final segment always involves load removal.
When the voltage on the indenter coil passes the displacement voltage at which the surface was detected
in the approach portion of the cycle, the current through the coil is fixed while the raw data are recorded
on the hard disk, and plotted on the computer monitor. The indenter is then raised well away from the
surface in preparation for moving the sample to the position of the next indent. For subsequent indents
in a given series of indents, the initial estimate of surface position used is that found in making the
previous indent.
For each indentation step, load voltages, displacement (penetration depth or indentation depth)
voltages, and real time are recorded in separate files. These raw voltage data are converted to load vs.
displacement data by using load and displacement calibration constants. From the displacement data,
the contact depth is calculated for calculations of the hardness. The slope of the unloading curve is used
to calculate the modulus of elasticity.
10.2.3.5 Acoustic Emission Measurements during Indentation
AE measurement is a very sensitive technique to monitor cracking of the surfaces and subsurfaces. The
nucleation and growth of cracks result in a sudden release of energy within a solid; then some of the
energy is dissipated in the form of elastic waves. These waves are generated by sudden changes in stress
and in displacement that accompany the deformation. If the release of energy is sufficiently large and
rapid, then elastic waves in the ultrasonic frequency regime (AE) will be generated and these can be
detected using PZTs via expansion and compression of the PZT crystals (Yeack-Scranton, 1986; Scruby,
1987; Bhushan, 1996).
Weihs et al. (1992) used an AE sensor to detect cracking during indentation tests using the nanoin-
denter. The energy dissipated during crack growth can be estimated by the rise time of the AE signal.
They mounted a commercial transducer with W-impregnated epoxy backing for damping underneath
© 1999 by CRC Press LLC
the sample as shown in Figure 10.17. The transducer converts the AE signal into voltage that is amplified
by oscilloscopes and used for continuous display of the AE signal. Any correlation between the AE signal
and the load–displacement curves can be observed. (Also see Wu et al., 1990b and Wu, 1991.)
10.2.3.6 Nanoscratch and Tangential Force Measurements
Several micro- and nanoscratch testers are commercially available, such as the Taber shear/scratch tester
model 502 with a no. 139-58 diamond cutting tool (manufactured by Teledyne Taber, North Tonawanda,
NY) for thick films; Revetest automatic scratch tester (manufactured by Centre Suisse d’ Electronique et
de Microtechnique S.A, CH-2007, Neuchatel, Switzerland) for thin films (Perry, 1981, 1983; Steinmann
et al., 1987; Sekler et al., 1988), and nanoindenter for ultrathin films (Wu et al., 1989, 1990b; Wu, 1990,
1991; Anonymous, 1991; Bhushan et al., 1995, 1996, 1997; Bhushan and Gupta, 1995; Gupta and Bhushan,
1995a,b; Patton and Bhushan, 1996; Bhushan and Li, 1997; Li and Bhushan, 1998b,c).
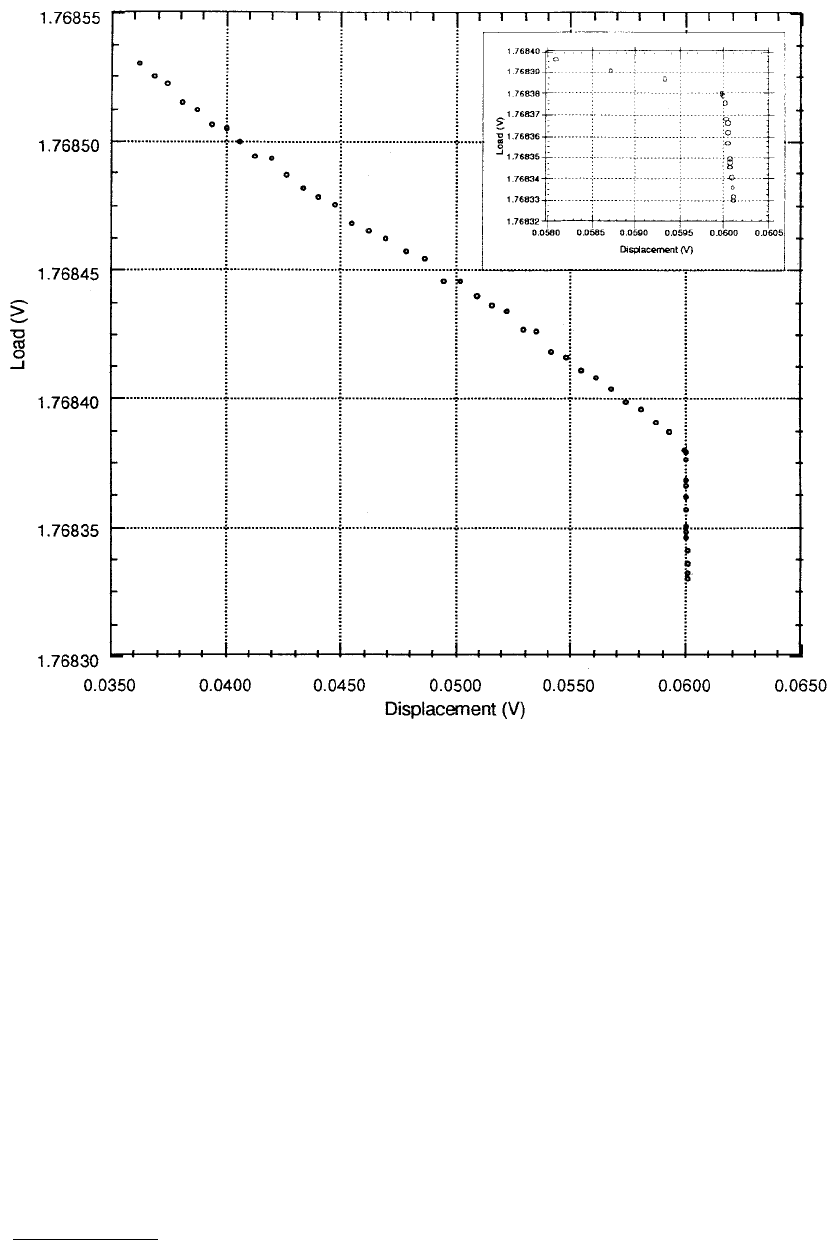
FIGURE 10.16 A plot of load vs. displacement (expressed in volts) for a typical approach segment of an indentation
obtained using the lowest load range and with an approach rate of about 10 nm/s. A factor of four increase in stiffness was
used as the criterion for terminating this segment. The very sharp “knee” at the right end of the plot indicates surface
contact. Data near the knee of the curve are shown on an expanded scale in the inset. Note that the displacement voltage
changes by only 0.1 mV (corresponding to a displacement of about 1.3 nm) between the surface contact and the end of
the approach segment. Thus, it is obvious that the position of the surface (i.e., displacement voltage corresponding to the
surface contact) can be specified to about ±0.1 nm. (Courtesy of Nano Instruments, Knoxville, TN.)
© 1999 by CRC Press LLC
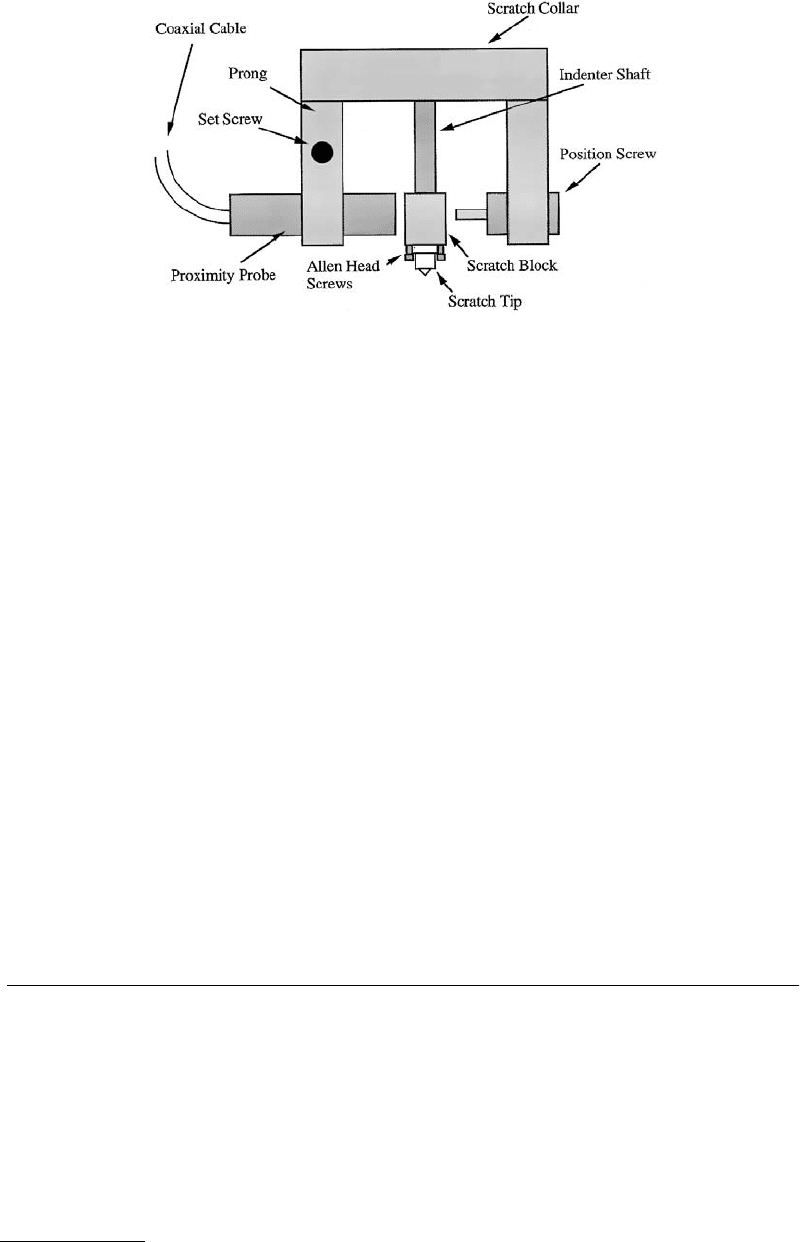
We describe the nanoscratch and tangential force option which allows making of the scratches of
various lengths at programmable loads. Tangential (friction) forces can also be measured simultaneously
(Anonymous, 1991). The additional hardware for the tangential force option includes a set of proximity
(capacitance) probes for measurement of lateral displacement or force in the two lateral directions along
x and y, and a special “scratch collar” which mounts around the indenter shaft with hardness indenter,
Figure 10.18. The scratch collar consists of an aluminum block, mounted around the indenter shaft, with
four prongs descending from its base. Two of these prongs hold the proximity probes and the set screws
set them in place, while the other two prongs hold position screws (and corresponding set screws). The
position screws serve a dual purpose; they are used to limit the physical deflection of the indenter shaft,
and they are used to lock the indenter shaft in place during tip change operations. A scratch block is
mounted on the end of the indenter shaft, in line with the proximity probes and the positioning screws.
Finally, the scratch tip itself is mounted on the end of the indenter shaft, covering the scratch tip. The
scratch tip is attached to the scratch block with two Allen head screws. The scratch tip can be a Berkovich
indenter or a conventional conical diamond tip with a tip radius of about 1 to 5 µm and an included
angle of 60 to 90° (typically 1 µm of tip radius with 60°
of included angle, Wu et al., 1990a,b; Wu, 1991).
A larger included angle of 90° may be desirable for a more durable tip. The tip radius should not be very
small as it will get blunt readily.
FIGURE 10.17 (a) Schematic of nanoindenter with an AE transducer, (b) schematic of commercial transducer with
W-impregnated epoxy backing for damping. (From Weihs, T.P. et al., 1992, in Thin Films: Stresses and Mechanical
Properties III, Symp. Proc., W.E. Nix, et al., eds., Vol. 239, pp. 361–370, Materials Research Society, Pittsburgh. With
permission.)
© 1999 by CRC Press LLC
During scratching a load is applied up to a specified indentation load or up to a specified indentation
depth, and the lateral motion of the sample is measured. In addition, of course, load and indentation
depth are monitored. Scratches can be made either at the constant load or at ramp-up load. Measurement
of lateral force allows the calculations of the coefficient of friction during scratching. The resolution of
the capacitance proves to measure tangential load is about 50 µN; therefore, a minimum load of about
0.5 mN can be measured or a minimum normal load of about 5 mN should be used for a sample with
coefficient of friction of about 0.1. Microscopy of the scratch produced at ramp-up load allows the
measurement of critical load required to break up of the film (if any) and scratch width and general
observations of scratch morphology.
Additional parameters that are used to control the scratch are scratch length (µm), draw acceleration
(µm/s
2
), and draw velocity (µm/s). The latter parameters control the speed with which the scratch is
performed. The default values of 10 µm/s
2
and 10 µm/s provide safe rates for performing the scratch.
Draw velocity is limited by the maximum rate of data acquisition (during a scratch the maximum rate
is approximately 2/s) and the length of the desired scratch. Thus, a scratch with a desired 20 points over
1 mm must have a draw velocity no greater than 100 µm/s.
The lateral deflection calibration is performed with a calibrated cantilever beam (of known stiffness)
mounted on the specimen tray. Lateral force applied to the indenter shaft with the beam can be used to
determine response of the indenter shaft in micrometers per volt of probe or newton per volt (from
known lateral stiffness of the indenter shaft). Calibration for the cross talk of the probe (resulting from
the probe surface not being parallel to the axis of motion in the vertical direction) also needs to be
performed. For this calibration, the scratch tip is moved up and down and any output of the proximity
probe in volts of vertical motion per volt of proximity probe is measured.
10.3 Analysis of Indentation Data
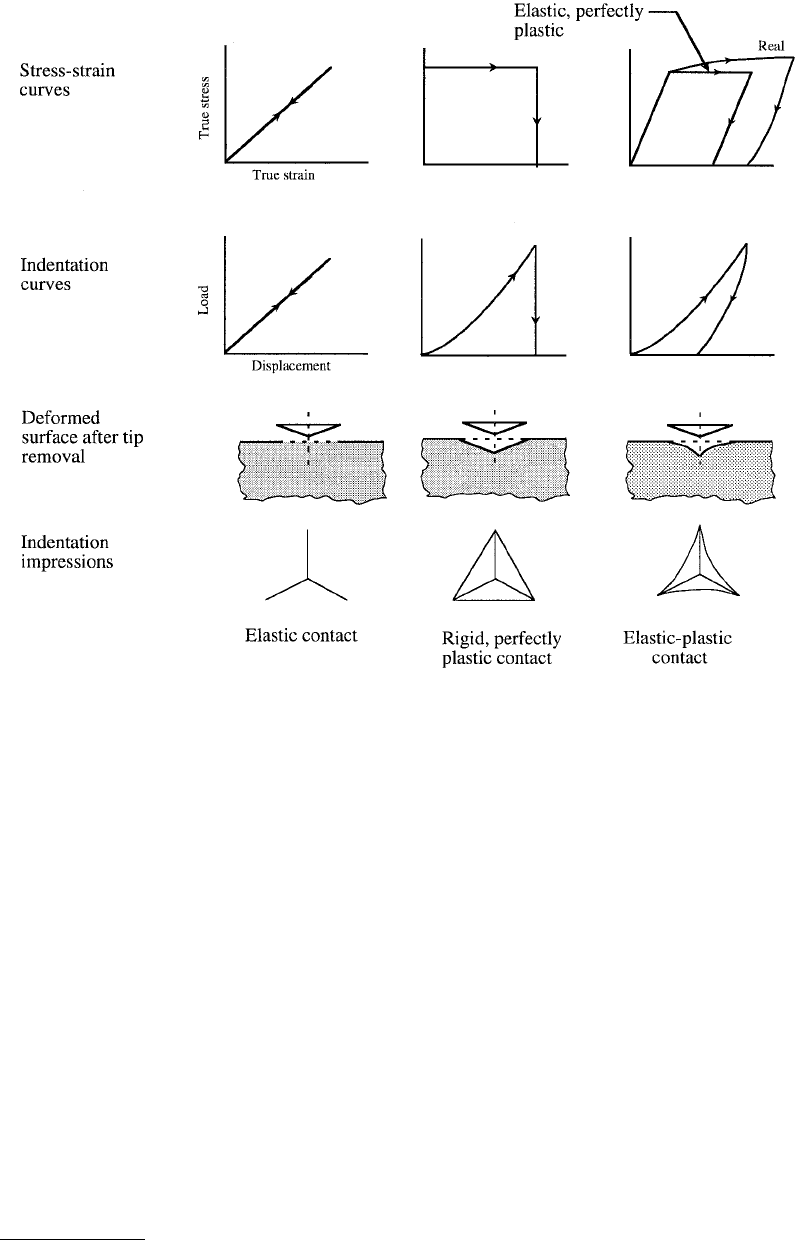
An indentation curve is the relationship between load W and displacement (or indentation depth or
penetration depth) h, which is continuously monitored and recorded during indentation. Stress–strain
curves, typical indentation curves, the deformed surfaces after tip removal, and residual impressions of
indentation for ideal elastic, rigid–perfectly plastic and elastic–perfectly plastic and real elastic–plastic
solids are shown in Figure 10.19. For an elastic solid, the sample deforms elastically according to Young’s
modulus, and the deformation is recovered during unloading. As a result, there is no impression of the
indentation after unloading. For a rigid–perfectly plastic solid, no deformation occurs until yield stress
is reached, when plastic flow takes place. There is no recovery during unloading and the impression
FIGURE 10.18 Schematic of the tangential force option hardware (not to scale and the front and rear prongs not
shown). (Courtesy of Nano Instruments, Knoxville, TN.)
© 1999 by CRC Press LLC
remains unchanged. In the case of elastic–plastic solid, it deforms elastically according to Young’s modulus
and then it deforms plastically. The elastic deformation is recovered during unloading. In the case of an
elastic–perfectly plastic solid, there is no work hardening.
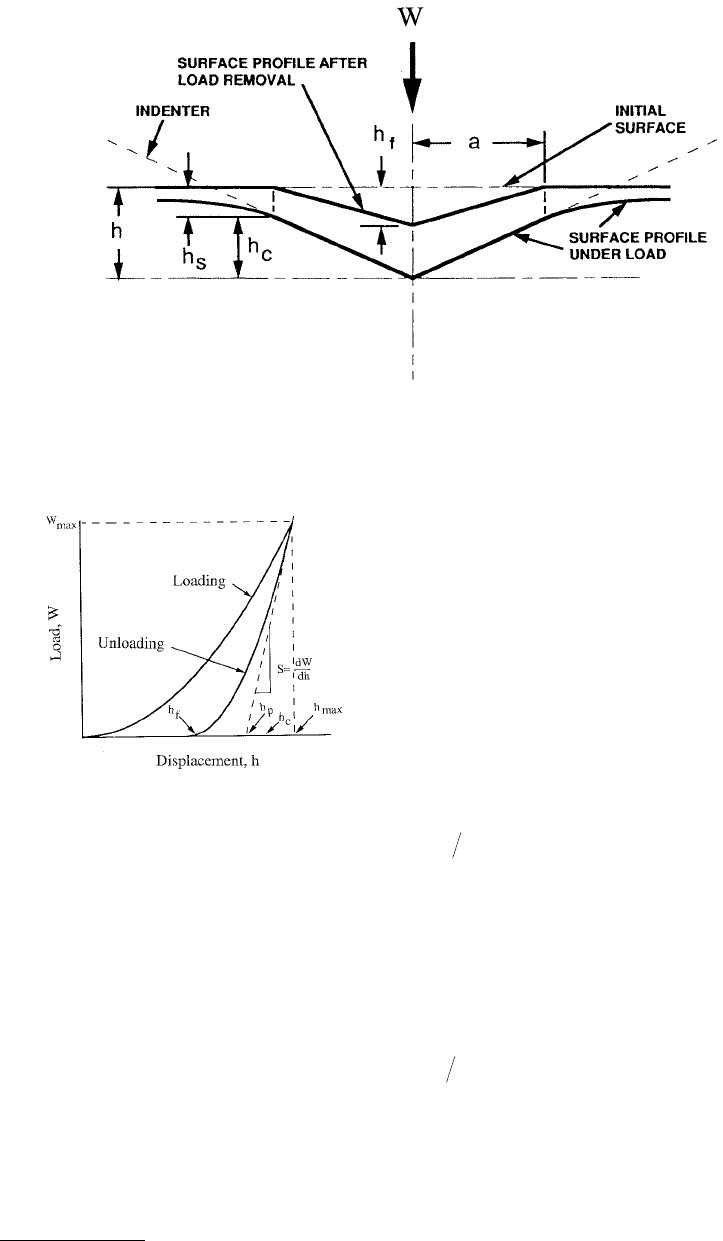
All engineering surfaces follow real elastic–plastic deformation behavior with work hardening
(Johnson, 1985). The deformation pattern of a real elastic–plastic sample during and after indentation
is shown schematically in Figure 10.20. In this figure we have defined the contact depth (h
c
) as the depth
of indenter in contact with the sample under load. The depth measured during the indentation (h)
includes the depression of the sample around the indentation in addition to the contact depth. The
depression of the sample around the indentation (h
s
= h – h
c
) is caused by elastic displacements and must
be subtracted from the data to obtain the actual depth of indentation or actual hardness. At peak load,
the load and displacement are W
max
and h
max
, respectively, and the radius of the contact circle is a. Upon
unloading, the elastic displacements in the contact region are recovered and, when the indenter is fully
withdrawn, the final depth of the residual hardness impression is h
f
.
Schematic of a load–displacement curve is shown in Figure 10.21. Based on the work of Sneddon
(1965) to predict the deflection of the surface at the contact perimeter for a conical indenter and a
paraboloid of revolution, Oliver and Pharr (1992) developed an expression for h
c
at the maximum load
(required for hardness calculation) from h
max
,
FIGURE 10.19 Schematics of stress–strain curves, typical indentation curves, deformed surfaces after tip removal,
and residual impressions of indentation, for ideal elastic, rigid–perfectly plastic, elastic–perfectly plastic (ideal), and
real elastic–plastic solids.
© 1999 by CRC Press LLC
(10.3a)
where e = 0.72 for the conical indenter, Œ = 0.75 for the paraboloid of revolution, and Œ= 1 for the
flat punch; S
max
is the stiffness (= 1/compliance) equal to the slope of unloading curve (dW/dh) at the
maximum load. Oliver and Pharr assumed that behavior of Berkovich indenter is similar to that of conical
indenter, since cross-sectional areas of both types of indenters varies as the square of the contact depth
and their geometries are singular at the tip. Therefore, for Berkovich indenter, e ~ 0.72. Thus, h
c
is slightly
larger than plastic indentation depth (h
p
), which is given by
(10.3b)
We note that Doerner and Nix (1986) had underestimated h
c
by assuming that h
c
= h
p
. Based on the
finite element analysis of the indentation process, Laursen and Simo (1992) showed that h
c
cannot be
assumed equal to h
p
for indenters which do not have flat punch geometry.
FIGURE 10.20 Schematic representation of the indenting process illustrating the depression of the sample around
the indentation and the decrease in indentation depth upon unloading. (From Oliver, W.C. and Pharr, G.M., 1992,
J. Mater. Res. 7, 1564–1583. With permission.)
FIGURE 10.21 Schematic of load–displacement curve.
hh W S
c
=−
max max max
ε
hh W S
p
=−
max max max
© 1999 by CRC Press LLC
For a Vickers indenter with ideal pyramidal geometry (ideally sharp tip), projected contact-area-to-
depth relationship is given as (Doerner and Nix, 1986; Bhushan, 1996)
(10.4a)
Since the area-to-depth relationship is equivalent for both typical Berkovich and Vickers pyramids,
Equation 10.4 holds for the Berkovich indenter as well. Although we have derived a slightly different
expression for A(h) presented in Equation 10.2 for the assumed Berkovich indenter geometry, we use
Equation 10.4 for A(h) in this chapter, as this relationship is most commonly used in the analysis of the
indentation hardness data.
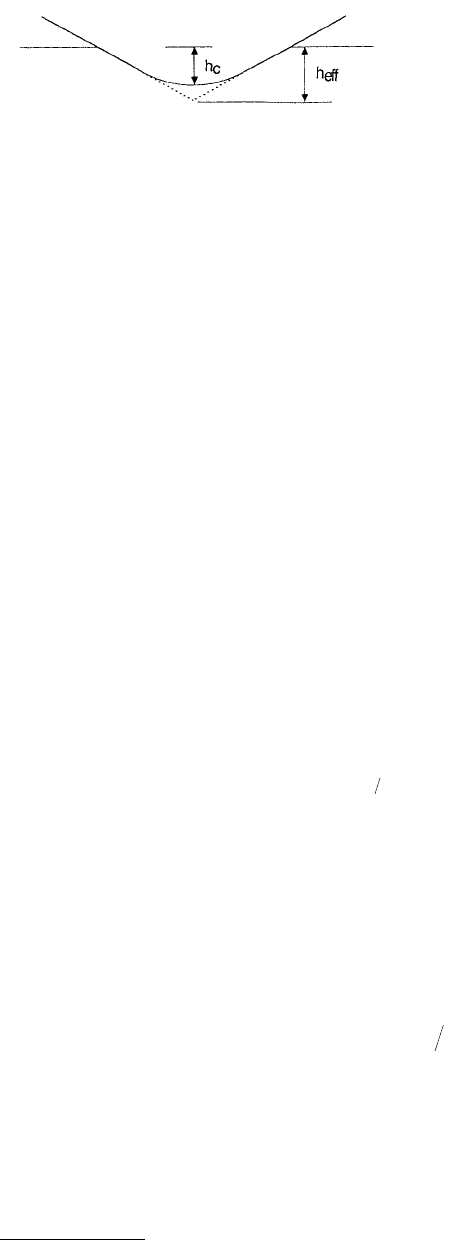
The indenter tip is generally rounded so that ideal geometry is not maintained near the tip
(Figure 10.22). To study the effect of tip radius on the elastic–plastic deformation (load vs. displacement
curve), Shih et al. (1991) modeled the blunt-tip geometry by a spherical tip of various radii. They derived
a geometric relationship (assuming no elastic recovery) between the projected contact area of the indenter
to the actual contact depth. Figure 10.23a shows the measured contact area vs. indentation depth data
by Pethica et al. (1993) for nickel and by Doerner and Nix (1986) for annealed a-brass. From this figure,
it seems that a tip radius of 1 µm fits the data best. If there is elastic recovery, the experimental data are
smaller than what they should be, and then the tip radius would be even larger than 1 µm. Shih et al.
(1991) used the finite-element method to simulate an indentation test. They showed that load–indenta-
tion depth data obtained using nanoindenter for nickel by Pethica et al. (1983) can be fitted with a
simulated profile for a tip radius of about 1 µm, Figure 10.23b.
As shown in Figure 10.20, the actual indentation depth, h
c
, produces a larger contact area than would
be expected for an indenter with an ideal shape. For the real indenter used in the measurements, the
nominal shape is characterized by an area function F(h
c
), which relates projected contact area of the
indenter to the contact depth (Equation 10.4a),
(10.4b)
The functional form must be established experimentally prior to the analysis (to be described later).
10.3.1 Hardness
Berkovich hardness HB (or H
B
) is defined as the load divided by the projected area of the indentation.
It is the mean pressure that a material will support under load. From the indentation curve, we can
obtain hardness at the maximum load as
(10.5)
where W
max
is the maximum indentation load and A is the projected contact area at the peak load. The
contact area at the peak load is determined by the geometry of the indenter and the corresponding contact
depth h
c
using Equation 10.3a and 10.4b. A plot of hardness as a function of indentation depth for
polished single-crystal silicon (111), with and without tip shape calibration, is shown in Figure 10.24.
FIGURE 10.22 Schematic of an indenter tip with a
nonideal shape. The contact depth and the effective
depth are also shown.
Ah
c
= 24 5
2
.
AFh
c
12
=
()
HB W A=
max