Biermann Ch. Handbook of Pulping and Papermaking
Подождите немного. Документ загружается.

414 20. TOTAL QUALITY MANAGEMENT
0.50
I
I
-2 -1 0 1 2
Standard Deviation of the Mean
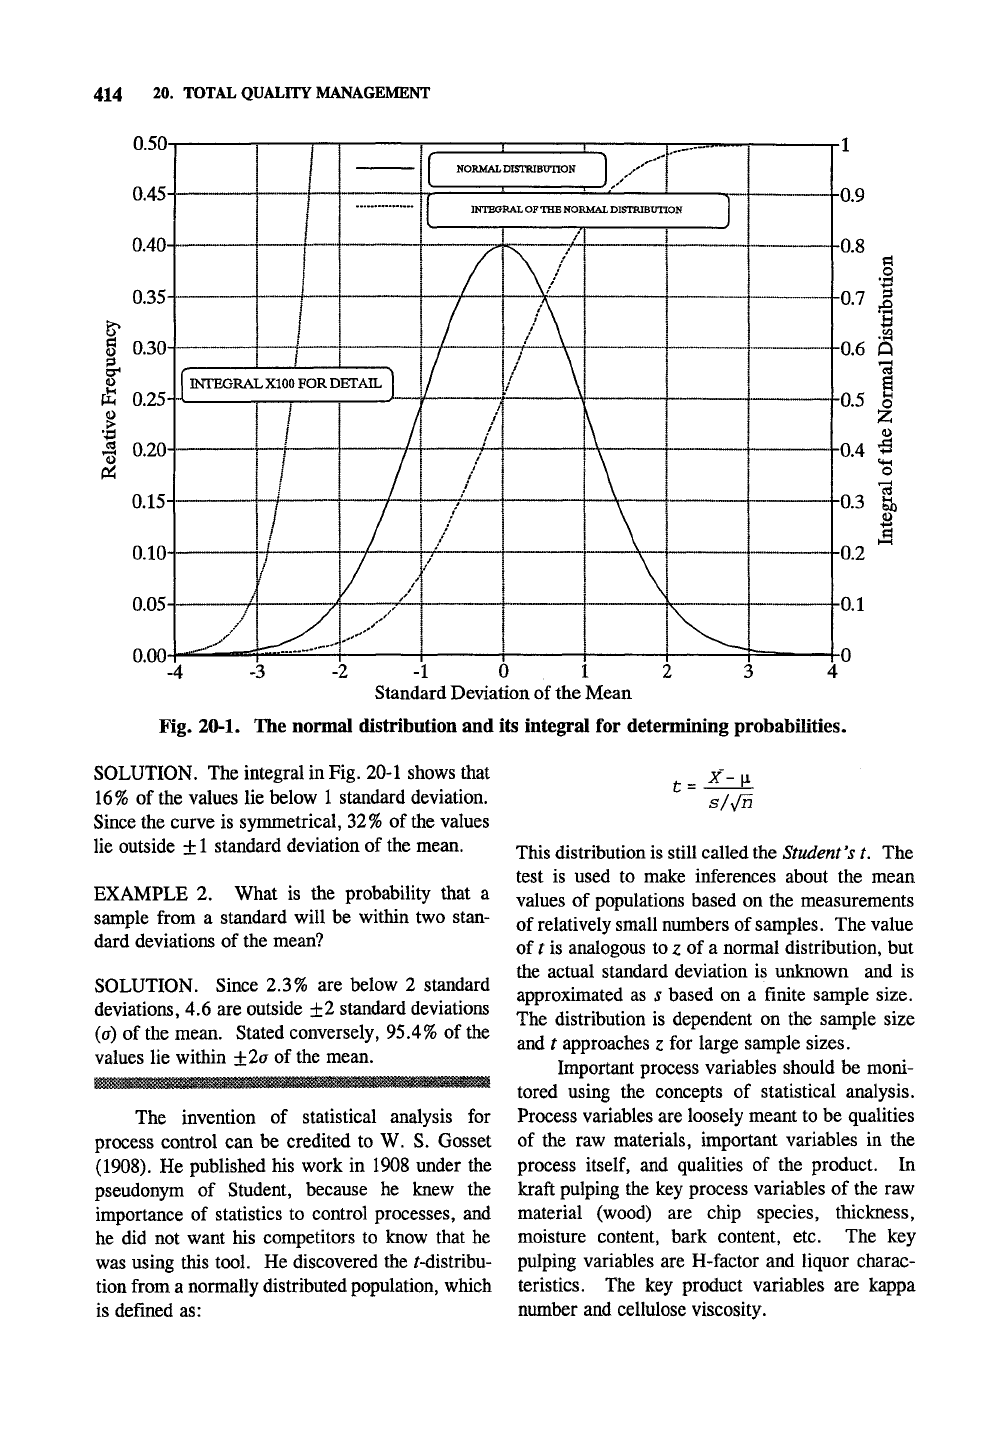
Fig. 20-1. The normal distribution and its integral for determining probabilities.
SOLUTION. The integral in Fig. 20-1 shows that
16%
of the values lie below 1 standard deviation.
Since the curve is symmetrical, 32% of the values
lie outside ±
1
standard deviation of the mean.
EXAMPLE 2. What is the probability that a
sample from a standard will be within two stan-
dard deviations of the mean?
SOLUTION. Since 2.3% are below 2 standard
deviations, 4.6 are outside ±2 standard deviations
(a) of the mean. Stated conversely, 95.4% of the
values lie within ±2a of the mean.
The invention of statistical analysis for
process control can be credited to W. S. Gosset
(1908).
He published his work in 1908 under the
pseudonym of Student, because he knew the
importance of statistics to control processes, and
he did not want his competitors to know that he
was using this tool. He discovered the /-distribu-
tion from a normally distributed population, which
is defined as:
t =
X-
s/y/n
This distribution is still called the Student
*s
t. The
test is used to make inferences about the mean
values of populations based on the measurements
of relatively small numbers of
samples.
The value
of t is analogous to z of a normal distribution, but
the actual standard deviation is unknown and is
approximated as s based on a finite sample size.
The distribution is dependent on the sample size
and / approaches z for large sample sizes.
Important process variables should be moni-
tored using the concepts of statistical analysis.
Process variables are loosely meant to be qualities
of the raw materials, important variables in the
process
itself,
and qualities of the product. In
kraft pulping the key process variables of the raw
material (wood) are chip species, thickness,
moisture content, bark content, etc. The key
pulping variables are H-factor and liquor charac-
teristics. The key product variables are kappa
number and cellulose viscosity.
STATISTICAL PROCESS CONTROL 415
This is the field of statistical quality control
(SQC) or statistical product control (SPC). These
techniques should be second nature to any scien-
tist, but they have met with opposition in produc-
tion facilities where they are treated as one more
fad brought down by management. One aspect of
this is to reduce product variation. This assumes
that all of the important variables are measured in
timely manners. It is interesting to speculate on
companies that join the SPC bandwagon, indicat-
ing that SPC is the best thing they have ever
heard; what were these companies doing before
they heard of SPC?
The cost versus benefit of
SPC
The cost of quality assurance throughout the
manufacturing process is an important consider-
ation. With too little quality assurance, high costs
will result because there will be a high rejection
rate at the end. Too much quality control and the
tail wags the dog. The amount of quality control
practiced depends on the intended use of the prod-
uct. Transistors for consumer radios will not be
made with the same tight specifications as elec-
tronic components designed for space satellites, so
the level of SPC is appropriately different in these
two products.
Inventions and new processes change the
quality control picture dramatically. The best
quality control in the design of vacuum tubes will
never compete with the transistor, which is inher-
ently of higher quality for most purposes.
Computers and computer networks now make
many aspects of quality control essentially auto-
matic to the production worker. Data is collected
continuously by sensors, sent to computers,
graphed, and presented to operators. Recent
trends, warnings of process variables going out of
a specified range, and other information is given
continuously. This allows the operators to see a
potential problem long before the quality of the
product is seriously affected. These automatic
systems also save money by not requiring much
operator time. Much of
the
drudgery of statistical
process control, such as plotting points by hand,
should be gone. For other data that is not collect-
ed automatically and for teaching purposes, com-
puters with graphic packages should be made
available.
20.3 STATISTICAL PROCESS CONTROL
TOOLS
Data collection
It is very important to collect useful data
before trying to analyze it by charting and statisti-
cal analysis. TAPPI Standard Methods cover
areas of sampling for paper, chips, and other
materials. If the sample one obtains does not
represent the material that is actually being used,
then data analysis may do more harm than good
by throwing people off track. This has been
mentioned in various parts of this book already.
For example, a bucket sampler that is filled by the
first few chips off a chip truck potentially allows
chip suppliers to put poor quality material in the
truckload without detection. Mention was also
made of a neglectful worker who would collect an
entire shift worth of eight samples all at the same
time,
but submit them hourly.
Another point to consider is the sampling
frequency. Generally, the more variability in a
material, the more often it should be sampled.
Wood has a very large amount of variability due
to the nature of the material. Wood is not like
sodium hydroxide or other chemicals that have
relatively little variation between batches.
The accuracy of data is paramount. No
amount of statistical analysis will detect errors in
pulp kappa numbers that are all too low because a
buret could not be filled to the top. Such an error
is fixed and not random.
One should also consider what variables
should be tested. In the past, kraft mills tested
wood chips on the basis of size for pulping. How-
ever, thickness is a much more suitable variable,
and the industry now saves millions of dollars
every year by testing and separating wood on the
basis of its thickness.
Graphs
and charts
Data for statistical process control can be
presented in any form in which data is commonly
presented for analysis, presentations, and compari-
son. These tools include bar charts, histograms,
line graphs, pie charts, scatter plots to relate two
or more variables, Pareto charts, and control
charts.
By graphing the data, trend
analysis
becomes
much easier. It is virtually impossible to see
416 20. TOTAL QUALITY MANAGEMENT
SnCKIES DIRT
DOCTOR FALLING POWER EARTH- TORNADO
BLADE HARDHATS CHANGE QUAKE
OTHERS
Cause of lost production or unscheduled down time
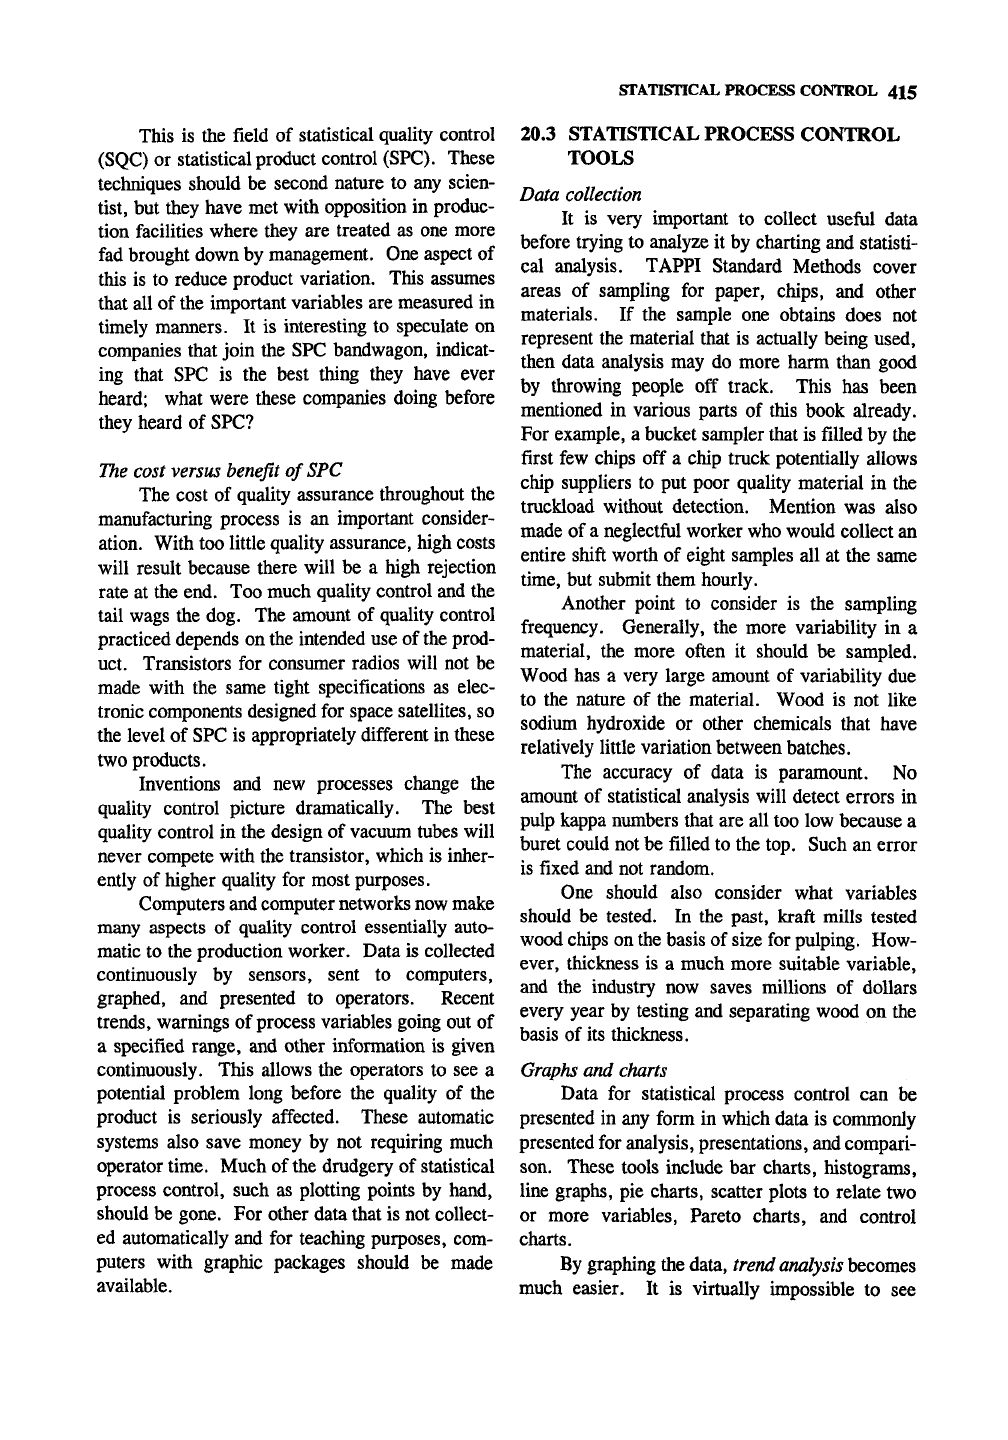
Fig. 20-2. A Pareto chart for hypothetical down time of a tissue paper machine due to web breaks.
subtle trends in data presented tabularly, but they
become more apparent when presented graphical-
ly. For example, one problem was seen to occur
with a cycle of the same length as the bleaching
cycle changeover from one species to another. By
recognizing this fact, it became obvious that the
problem was due to some carryover between two
tanks.
The cause of the problem could be verified
by fiber analysis techniques. Once the source of
the problem was recognized, several solutions
were suggested in a brain-storming session and the
solution implemented with teamwork. One might
define SPC as the presentation of useful, accurate
information in a timely and useful manner (via the
tools of elementary statistics).
Pareto charts
Pareto charts were invented in 1906 by
Vilfredo Pareto. He modified Lorenz type-plots
that were first used to show unequal distribution of
wealth (Juran, 1962). Pareto charts are histo-
grams assigning failure to various causes. Often
just a few causes resuU in most of
the
failures, just
as a few people control most of the wealth. Fig.
20-2 shows a Pareto chart showing the cause of
down time on a paper machine.
Control charts
One of the unique tools of statistical process
control is the control chart devised by Dr. Walter
A. Shewhart in 1924 (Juran et al., 1962). The
control chart is a line graph where the x-axis is the
independent variable and the }?-axis is the process
control parameter or variable. Fig. 20-3 shows a
control chart for the kappa number of pulp going
to the bleach plant.
Upper and lower boundaries of the "desired"
values of y are plotted as lines. These are the
upper control limit (UCL) and lower control limit
(LCL).
The average value (X, said as "X-bar") is
centered between the control limits. The range of
the control limits, R, depends on the statistical
variation of the process, the measurements of the
process, and other variations. Usually the range
is defined as ± two standard deviations of the
mean so that 95% of the data points should be
STATISTICAL PROCESS CONTROL TOOLS 417
33H
I
OH
3(H
2&A
UPPER CONTROL LIMIT (3s)
UPPER CONTROL LIMIT (2s)
1 ' i ' i M • i "F
IT T
5 17 19 21 23 25
Hourly Sample Number
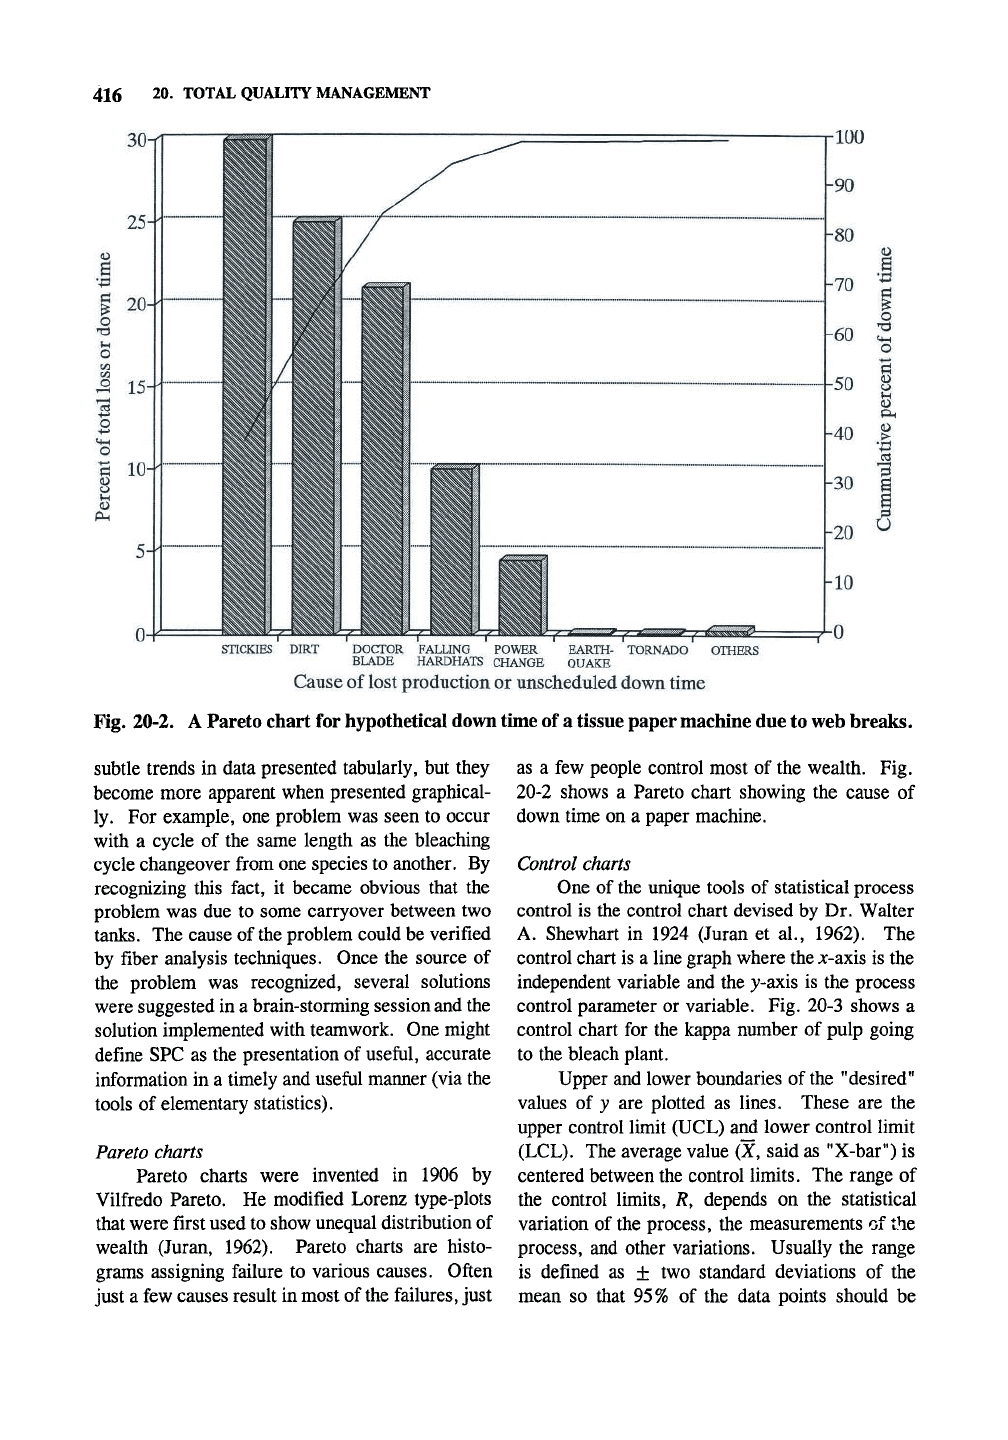
Fig. 20-3. Control chart for the kappa number of bleachable pulp leaving the pulp mill.
within the range if all of the variation is random
(not systematic error such as a process upset). If
it is defined as plus or minus three standard
deviations, it will include 99% of the data points.
Control charts must be developed when the pro-
cess is under statistical control, that is, all of the
variation is random. Otherwise, the control limits
will be in error.
One can quickly see if the process control
variable is within the control area. If the actual y
values (kappa number in this example) are consis-
tently within the boundaries, the process is said to
be in control. This allows an operator to make
changes when appropriate, but not to try to make
changes when no action is called for.
The data for the chart in Fig. 20-3 was
generated by a computer program (described at the
end of the chapter) designed to give an average of
30 and a standard deviation of 1.5. In this case,
all of the variation is random (unless, in the
unlikely event, the random number generator used
to generate the data is faulty). This data set has
an actual average of 30.72 and a standard devia-
tion of 1.45. If it is assumed that the kappa
number should be between 27 and 33 for this
grade of
pulp,
then the process or measurement of
the process must be improved as it is uncontrolla-
ble due to the random error. In this case one
might try using an automated device to see if
variability of measurement is an appreciable
portion of the overall variation (in which case the
kappa number may not actually be changing, but
one would be tempted to control the process
without realizing that). If this does not solve the
problem then new SPC techniques that are being
introduced in the pulp mill would probably de-
crease process variability of the pulp going to the
bleach plant from the pulp mill.
20.4 IMPLEMENTING TQM AND SPC
Commitment
of management
One statement about management that has a
lot of truth is that an organization take on the
attitude of their top manager (i.e., the attitude
comes from the top down). In order for these
tools to work, the top management must be com-
418
20.
TOTAL QUALITY MANAGEMENT
mitted to the techniques of TQM and SPC. Em-
ployees should be trained from the top down, with
the level of detail higher at each lower level so
that decisions can be made at the front line. The
techniques and purposes of TQM and SPC should
be explained to the satisfaction of the employees.
Training and implementation should go hand in
hand to reinforce the learning process and so the
relevance of
the
method is apparent. The expecta-
tions of each employe must be clear. Too often
TQM and SPC are talked about at length, but what
they are and how they relate to the process are
never mentioned. For many people this is sheer
frustration; for too many others, unfortunately, it
is normal to discuss things at great length that they
do not understand. Management must also be
committed to solving problems once they are
identified.
Specify objectives and goals clearly
There must be specific goals and objectives
in mind so that improvements can be ascertained.
Often the goal might be to meet established speci-
fications with less variation or reject product.
Quality improvements often increase production by
decreasing reject product. Vague goals cannot be
measured, and so improvement cannot be ascer-
tained. Suppliers, and all the other parties in the
process, should be involved and kept up to date
with clear communication. Not surprisingly, if
people know what one wants and why it is neces-
sary for one to have this, people will bend over
backward to help you. If they do not know why
you want something, you have only yourself to
blame when you do not get it.
Effective
communication
and feedback
The key to letting people know what is ex-
pected of them is effective communication. Be
sure to always let someone know when they are
doing things well; do not just indicate to them
when they are not doing things well. There must
be effective feedback for any person to know how
they are doing. One cannot control the basis
weight of paper on a paper machine if one does
not presently know what the basis weight is and
what choices one has to change the basis weight.
Also,
a person cannot know how well he or she is
doing if there is no feedback!
Verification
of
data
It is important to insure that the collected
data is correct. The accuracy of sensors should be
checked periodically. One should always consider
whether parameters are being measured in the
most effective way possible. Other questions like
"is this the most effective process?" should be
asked. As the systems come under control, the
specifications can become tighter.
What to avoid
One thing that should avoided at mills is the
writing of data by hand on charts or scraps of
paper, especially when this data is to be used by
others. Rewriting of the data, with the introduc-
tion of
errors,
is time wasted. Data that is directly
entered into computer spreadsheets can be imme-
diately evaluated graphically in many forms and
transmitted to others who might make use of
it.
It
is not uncommon to see the paper testing lab write
down the test results (when the measuring devices
could automatically enter the values into a comput-
er system) on a scrape of paper to be given to the
appropriate paper machine operator (when the
"courier" happens to come by the paper testing
lab) about 30 minutes later. The data is then
rewritten on another chart. Later, others must
manually look up the data for monthly production
reports or other purposes.
Occasionally one sees a small research
laboratory in a mill with state-of-the-art equipment
such as electronic basis weight scales that are used
once or twice a day. Out in the production area,
however, paper is still (slowly) weighed on a
mechanical balance about 8 times an hour with
perhaps 2% or more error. One should think of
the mill as a giant research experiment where the
gathering and analysis of data are just as critical as
in the most serious scientific work.
20.5 MISCELLANEOUS TOPICS
ISO 9000 series certification
The International Organization for Standard-
ization (ISO) developed the ISO 9000 standards in
1987.
The standards focus on twenty criteria of a
quality control program. There are three levels of
ISO 9000 certification. ISO 9001 is the most
comprehensive and includes meeting requirements
MISCELLANEOUS TOPICS 419
in design, production, installation, and servicing as
applicable to the product. ISO 9002 includes
meeting requirements during production and instal-
lation. ISO 9003 includes meeting requirements in
product quality only by final testing and inspec-
tion. (ISO 9004 is a guidance document.) The
European Communities (EC) will require most
industries to have ISO 9000 certification. Rabbitt
and Bergh (1992) give a useful summary of ISO
9000 certification.
Just in time concept
This concept means that inventory is kept to
a minimum and parts are produced almost as
needed. The "just in time" concept originates in
post World War II Japan. At that time America
was largely using the methods of Henry Ford, who
developed the assembly line as a means of manu-
facturing large numbers of automobiles in an
efficient manner. This included having large
inventories of each piece that would be brought to
the assembly floor in large quantities as needed.
Japan simply could not afford to tie up any
resource that would not soon become part of a
product to be sold. So methods were developed
that coordinated the manufacture of individual
parts with assembly of the whole item to limit the
inventory at any time. Today it is realized that
large inventories tie up large amounts of capital.
Interest must be paid on this capital. Large
building and storage costs also result.
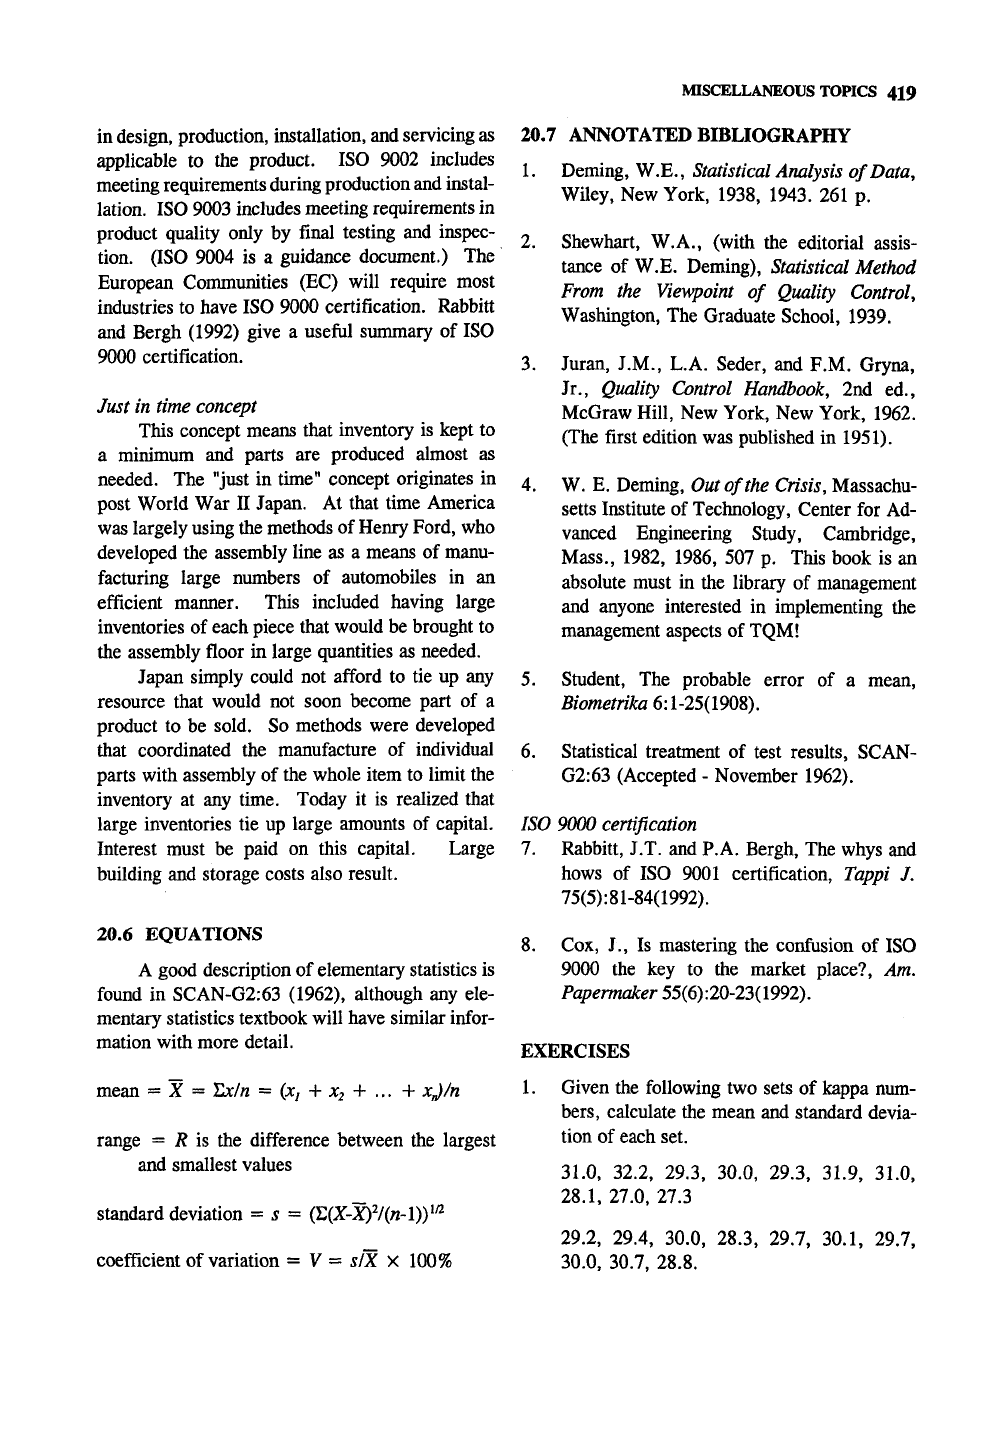
20.6 EQUATIONS
A good description of elementary statistics is
found in SCAN-G2:63 (1962), although any ele-
mentary statistics textbook will have similar infor-
mation with more detail.
mean = Z = locin =
{Xj
+ ^2 + ... + JCJ/AZ
range = /? is the difference between the largest
and smallest values
standard deviation = ^ =
(I;(X-Z)V(AZ-1))^^
coefficient of variation = V = sIX X 100%
20.7 ANNOTATED BIBLIOGRAPHY
1.
Deming, W.E., Statistical Analysis of Data,
Wiley, New York, 1938, 1943. 261 p.
2.
Shewhart, W.A., (with the editorial assis-
tance of W.E. Deming), Statistical Method
From the Viewpoint of Quality Control,
Washington, The Graduate School, 1939.
3.
Juran, J.M., L.A. Seder, and P.M. Gryna,
Jr., Quality Control Handbook, 2nd ed.,
McGraw Hill, New York, New York, 1962.
(The first edition was published in 1951).
4.
W. E. Deming, Out of the Crisis, Massachu-
setts Institute of Technology, Center for Ad-
vanced Engineering Study, Cambridge,
Mass.,
1982, 1986, 507 p. This book is an
absolute must in the library of management
and anyone interested in implementing the
management aspects of TQM!
5.
Student, The probable error of a mean,
Biometrika 6:1-25(1908).
6. Statistical treatment of test results, SCAN-
G2:63 (Accepted - November 1962).
ISO 9000 certification
7.
Rabbitt, J.T. and P.A. Bergh, The whys and
hows of ISO 9001 certification, Tappi J.
75(5):81-84(1992).
8. Cox, J., Is mastering the confusion of ISO
9000 the key to the market place?. Am,
Papermaker 55(6):20-23(1992).
EXERCISES
1.
Given the following two sets of kappa num-
bers,
calculate the mean and standard devia-
tion of each set.
31.0,
32.2, 29.3, 30.0, 29.3, 31.9, 31.0,
28.1,
27.0, 27.3
29.2,
29.4, 30.0, 28.3, 29.7, 30.1, 29.7,
30.0,
30.7, 28.8.

420 20. TOTAL QUALITY MANAGEMENT
3.
Using Fig. 20-3 as a control chart, plot the
following data and indicate where the process
may be out of control and what the reason
might be. These are kappa numbers taken
every two hours of pulp going to the bleach
plant.
29.2,
29.6, 30.4, 28.9, 30.5, 31.1, 30.9,
31.4,
32.4, 32.2, 34.6, 33.9, 35.3, 34.8,
35.5,
35.8
Draw a Pareto chart of the following failures
or downgrades during the month of Decem-
ber for rolls of paper.
low burst strength, 10
poor sizing, 3
defects in paper, 2
low brightness, 4
poorly wound, 18
too narrow, 5
Using Fig. 20-1, what percentage of values
from a normal distribution lie within 3 stan-
dard deviations of the mean? Within 4
means?
5 OPEN •'B:OUTPUT" FOR OUTPUT AS #1
10 RANDOMIZE
20 MEAN = 30: REM THIS IS THE DESIRED MEAN
30 S = 1.5: REM THIS IS THE DESIRED STANDARD
DEVIATION
40 FOR I = 1 TO 40: REM GENERATES 40 RANDOM
NUMBERS WITH A NORMAL DISTRIBUTION
50 Yl = 2*RND-1
60 Y2 = 2*RND-1
70 R = Y1*Y1+Y2*Y2
80 IF (R >
1
OR R=
1)
GOTO 50
90 FAC = SQR(-2*L0G(R)/R)
100 NUM =
FAC*Y1:
REM THIS IS THE RANDOM
NUMBER WITH MEAN OF 0 AND S OF 1
110 VAR = NUM*S+MEAN :REM THIS IS VARIABLE
WITH THE DESIRED MEAN AND S
120 PRINT VAR,: PRINT#1, VAR: REM PRINTS VARI-
ABLE TO SCREEN AND FILE FOR GRAPHING
LATER
130 STOTAL = (VAR-MEAN)*(VAR-MEAN) +
STOTAL:REM FOR CALCULATING ACTUAL S
140 MEANTOT = TOTAL + VAR: REM USED TO CAL-
CULATE THE ACTUAL MEAN FOR THIS SET
150 NEXT I
160 PRINT: PRINT "ACTUAL MEAN OF THIS SET =
".(MEAN + MEANTOT/I)
170 PRINT "ACTUAL STANDARD DEVIATION OF THIS
SET = ",SQR(STOTAL/(M))
APPENDIX-GENERATING RANDOM
DATA WITH A NORMAL DISTRIBUTION
The data in Fig. 20-3 was computer gen-
erated by the program below written in BASIC.
This program can be used to generate random data
to simulate a process where all of the variation is
random, and not possibly controllable by the
operator. Indeed, attempts to control the process
only increase the variability. The data is easily
plotted by importing the file into a program such
as QuatroPro or generating it within QuatroPro
with its random number generator.
Run
Random number seed (-32768 to 32767)? 4
30.95114 30.44624 32.16494 29.78161 29.29416 28.76899
29.95173 27.35375 29.23539 25.62650 31.90901 31.10704
30.99176 31.46926 28.06687 29.24346 26.97691 30.21155
27.33691 29.65250 29.20096 28.75179 29.42387 28.79731
30.03629 29.88838 28.27955 28.22769 29.65059 29.44141
30.13715 30.13631 29.69470 30.01222 30.00990 32.50525
30.65970 31.54469 28.77460 29.65343
ACTUAL MEAN OF THIS SET = 30.72326
ACTUAL STANDARD DEV. OF THIS SET =
1.454831
Ok
21
COLLOID AND SURFACE CHEMISTRY
21.1 INTRODUCTION
Much of what will be considered in this
chapter is surface chemistry. Chemically, a
surface layer {interfacial or interface layer) is the
boundary between two phases. The boundary is a
few molecules thick. Two examples are a cellu-
lose fiber in contact with aqueous solution and an
oil phase in contact with a water phase in an
emulsion. Colloidal chemistry is one branch of
surface chemistry. Surface chemistry and physics
are important in coUigative properties of solutions,
capillary action, papermaking chemistry, water
treatment, refining behavior, and foaming.
21.2 COLLOID CHEMISTRY
Colloids
A colloid is a stable combination of particles
of
one
substance that are dissolved or suspended in
a second substance; the particles have at least one
of the principal dimensions (somewhat arbitrarily)
from about 1 nm to 1 iim. (The time frame of
stability is also somewhat arbitrary.) The small
size of colloidal particles means that a high per-
centage of
the
molecules will be on the surface, so
surface chemistry is of vital importance to their
properties. A colloid may be considered to in-
clude the gas, liquid, or solid in which the parti-
cles are dispersed in addition to the particles
themselves. The dispersion medium forms a
continuous
phase; both of these terms are used to
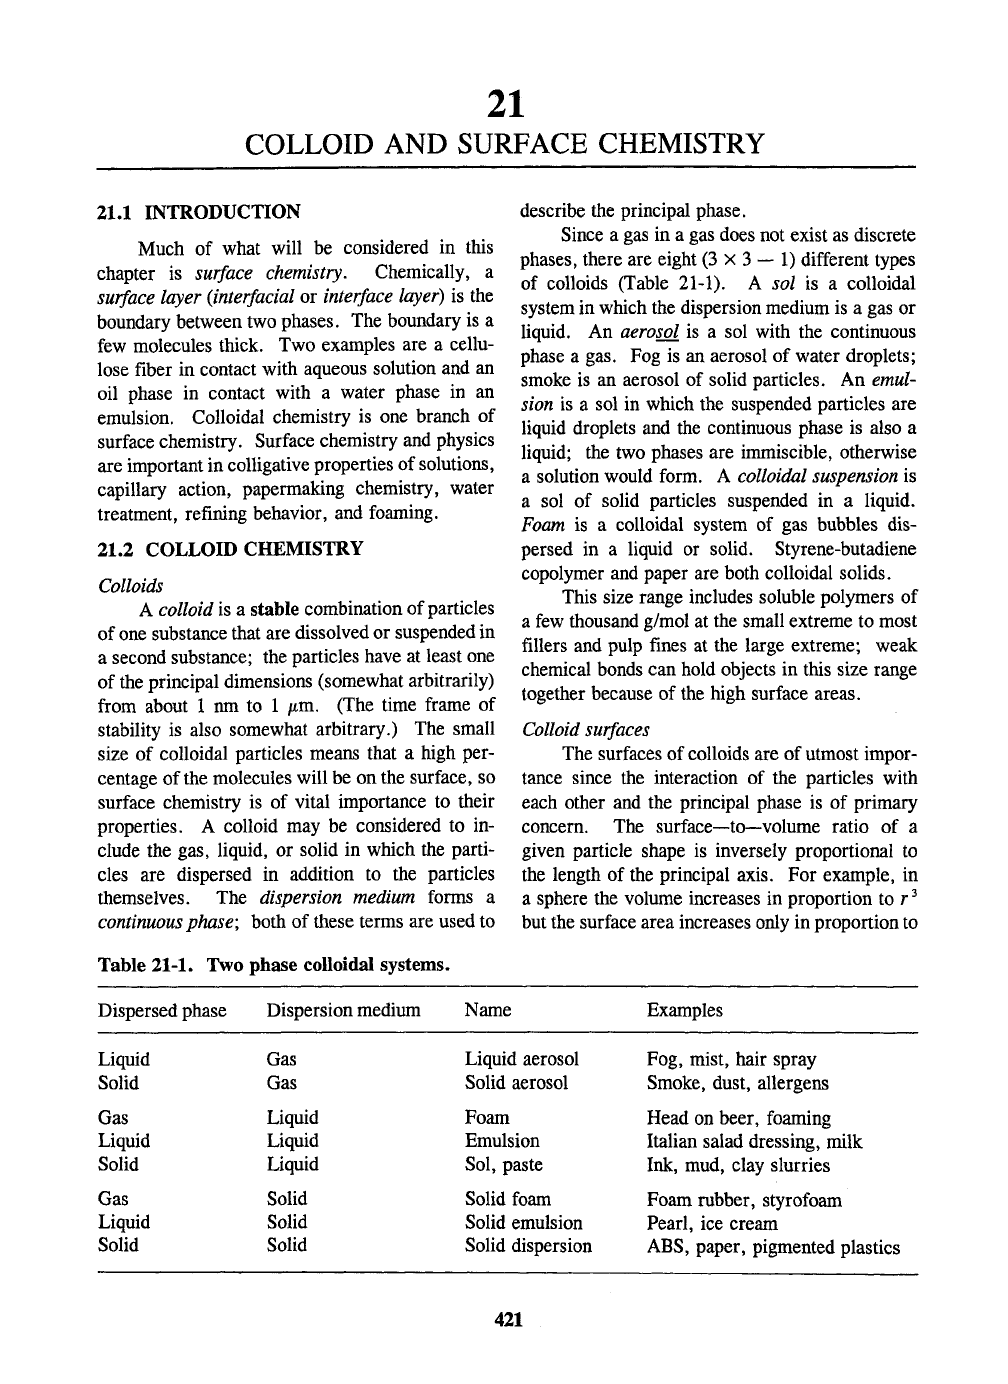
Table 21-1. Two phase colloidal systems.
describe the principal phase.
Since a gas in a gas does not exist as discrete
phases, there are eight (3x3
—
1) different types
of colloids (Table 21-1). A sol is a colloidal
system in which the dispersion medium is a gas or
liquid. An aerosol is a sol with the continuous
phase a gas. Fog is an aerosol of water droplets;
smoke is an aerosol of solid particles. An emul-
sion is a sol in which the suspended particles are
liquid droplets and the continuous phase is also a
liquid; the two phases are immiscible, otherwise
a solution would form. A colloidal suspension is
a sol of solid particles suspended in a liquid.
Foam is a colloidal system of gas bubbles dis-
persed in a liquid or solid. Styrene-butadiene
copolymer and paper are both colloidal solids.
This size range includes soluble polymers of
a few thousand g/mol at the small extreme to most
fillers and pulp fines at the large extreme; weak
chemical bonds can hold objects in this size range
together because of the high surface areas.
Colloid
surfaces
The surfaces of colloids are of utmost impor-
tance since the interaction of the particles with
each other and the principal phase is of primary
concern. The surface—to—volume ratio of a
given particle shape is inversely proportional to
the length of the principal axis. For example, in
a sphere the volume increases in proportion to r^
but the surface area increases only in proportion to
Dispersed phase
Liquid
Solid
Gas
Liquid
Solid
Gas
Liquid
Solid
Dispersion medium
Gas
Gas
Liquid
Liquid
Liquid
Solid
Solid
Solid
Name
Liquid aerosol
Solid aerosol
Foam
Emulsion
Sol, paste
Solid foam
Solid emulsion
Solid dispersion
Examples
Fog, mist, hair spray
Smoke, dust, allergens
Head on beer, foaming
Italian salad dressing, milk
Ink, mud, clay slurries
Foam rubber, styrofoam
Pearl, ice cream
ABS,
paper, pigmented plastics
421
422 21. COLLOID AND SURFACE CHEMISTRY
r^. A cube of
1
m on each side has a surface area
of 6 mVlOOO kg or 0.000006 mVg. A cube of 1
cm (1/100 the length of
the
larger cube) has a total
surface area of 6 x
lO"^
mVg or 0.0006 mVg (100
times the specific surface area of the large cube).
For a small molecule like AI2O3, about 1 in 100
molecules will lie on the surface of a 0.1 ^m
particle and about 1 in 10 of a 0.01 fim particle.
It takes energy to create surface area of
particles. The energy required is related to the
surface tension of a material. (One speaks of
surface
tension
of a liquid against a gas, usually its
vapor, and interfacial tension of two liquids
against each other.) The surface tension (7) of
water at 20 °C is about 72 mJ/m^ The work (W)
or surface excess free energy (G) required to make
new surface area (A) is given as follows:
AG = AW = 2yA
(21-1)
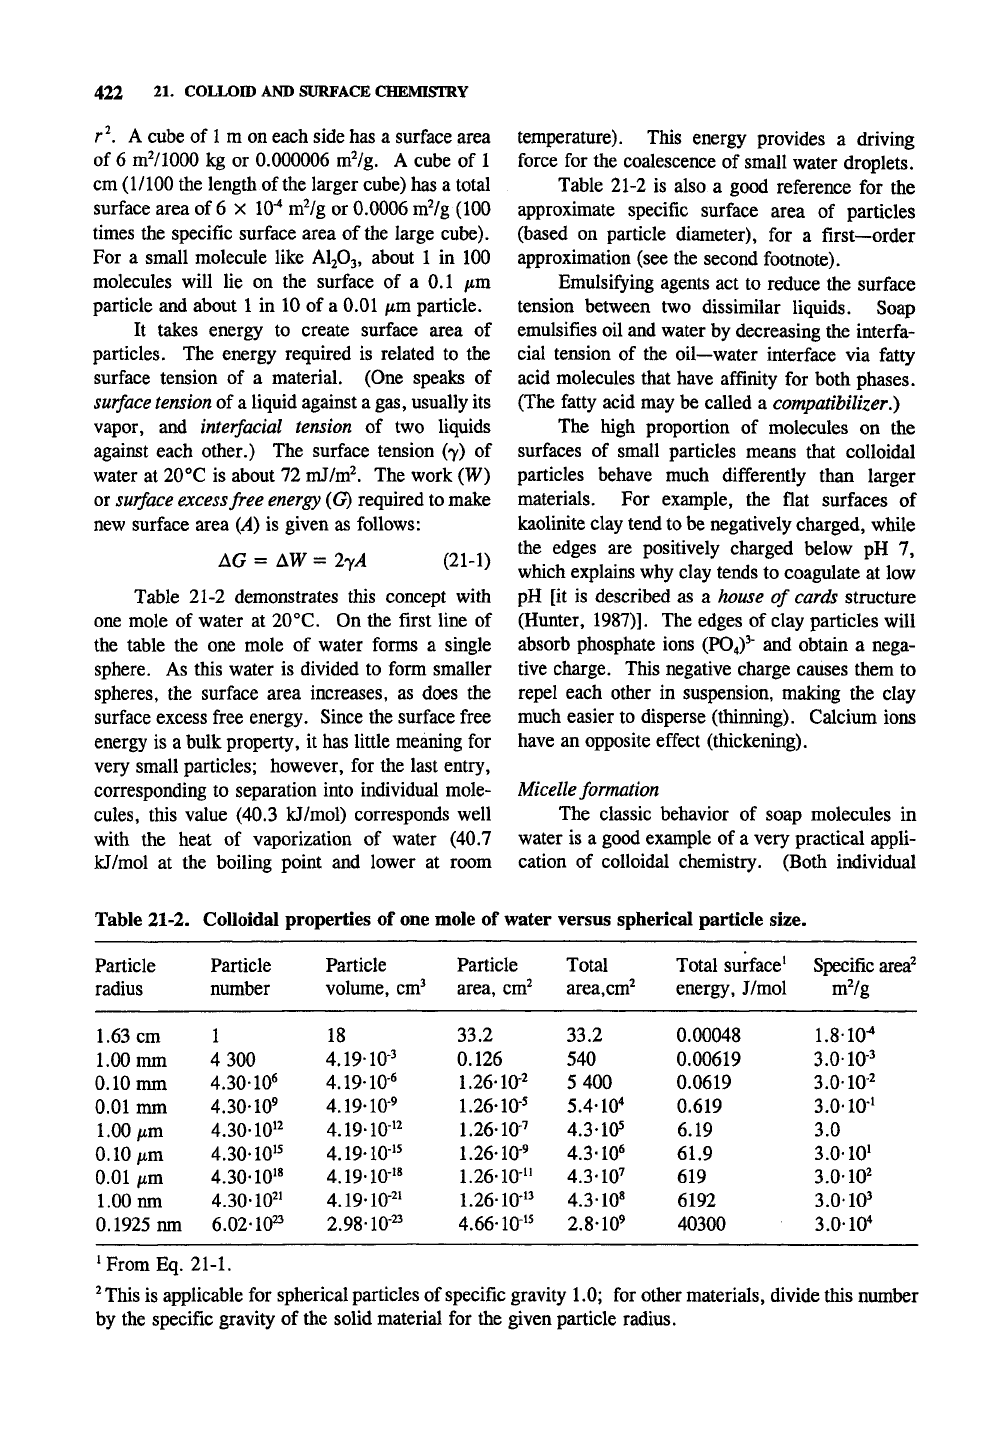
Table 21-2 demonstrates this concept with
one mole of water at 20°C. On the first line of
the table the one mole of water forms a single
sphere. As this water is divided to form smaller
spheres, the surface area increases, as does the
surface excess free energy. Since the surface free
energy is a bulk property, it has little meaning for
very small particles; however, for the last entry,
corresponding to separation into individual mole-
cules,
this value (40.3 kJ/mol) corresponds well
with the heat of vaporization of water (40.7
kJ/mol at the boiling point and lower at room
temperature). This energy provides a driving
force for the coalescence of small water droplets.
Table 21-2 is also a good reference for the
approximate specific surface area of particles
(based on particle diameter), for a first—order
approximation (see the second footnote).
Emulsifying agents act to reduce the surface
tension between two dissimilar liquids. Soap
emulsifies oil and water by decreasing the interfa-
cial tension of the oil—water interface via fatty
acid molecules that have affinity for both phases.
(The fatty acid may be called a compatibilizer.)
The high proportion of molecules on the
surfaces of small particles means that colloidal
particles behave much differently than larger
materials. For example, the flat surfaces of
kaolinite clay tend to be negatively charged, while
the edges are positively charged below pH 7,
which explains why clay tends to coagulate at low
pH [it is described as a house of cards structure
(Hunter, 1987)]. The edges of clay particles will
absorb phosphate ions (P04)^' and obtain a nega-
tive charge. This negative charge causes them to
repel each other in suspension, making the clay
much easier to disperse (thinning). Calcium ions
have an opposite effect (thickening).
Micelle formation
The classic behavior of soap molecules in
water is a good example of a very practical appli-
cation of colloidal chemistry. (Both individual
Table 21-2. Colloidal properties of one mole of water versus spherical particle size.
Particle
radius
1.63 cm
1.00 mm
0.10 mm
0.01 mm
1.00/im
0.10 |im
0.01 iim
1.00 nm
0.1925 nm
Particle
number
1
4 300
4.30-10*
4.30-10»
4.30-10'^
4.30-10'^
4.30-10"
4.30-W
6.02-10^
Particle
volume, cm^
18
4.19-10-^
4.19-10^
4.19-10'
4.19-10-'^
4.19-10"
4.19-10-"
4.19-10-''
2.98-10-^'
Particle
area, cm'
33.2
0.126
1.26-10-'
1.26-10-'
1.26-10-'
1.26-10-'
1.26-10-"
1.26-10-"
4.66-10-"
Total
area.cm'
33.2
540
5 400
5.4-10'
4.3-10=
4.3-10*
4.3-10'
4.3-10'
2.8-10'
Total surface'
energy, J/mol
0.00048
0.00619
0.0619
0.619
6.19
61.9
619
6192
40300
Specific area'
m'/g
1.8-10-^
3.0-10-'
3.0-10'
3.0-10'
3.0
3.0-10'
3.010'
3.0-10'
3.0-10'
^FromEq. 21-1.
^This is applicable for spherical particles of specific gravity 1.0; for other materials, divide this number
by the specific gravity of the solid material for the given particle radius.
COLLOID CHEMISTRY 423
molecules and aggregates of soap molecules are
colloids, but with different properties.) Soap
molecules are sodiimi or potassium salts of fatty
acids (Fig. 2-31). At very low concentrations
soap particles are individually dissolved in the
water and contribute to the coUigative properties
(such as increased osmotic pressure) according to
the number of moles present.
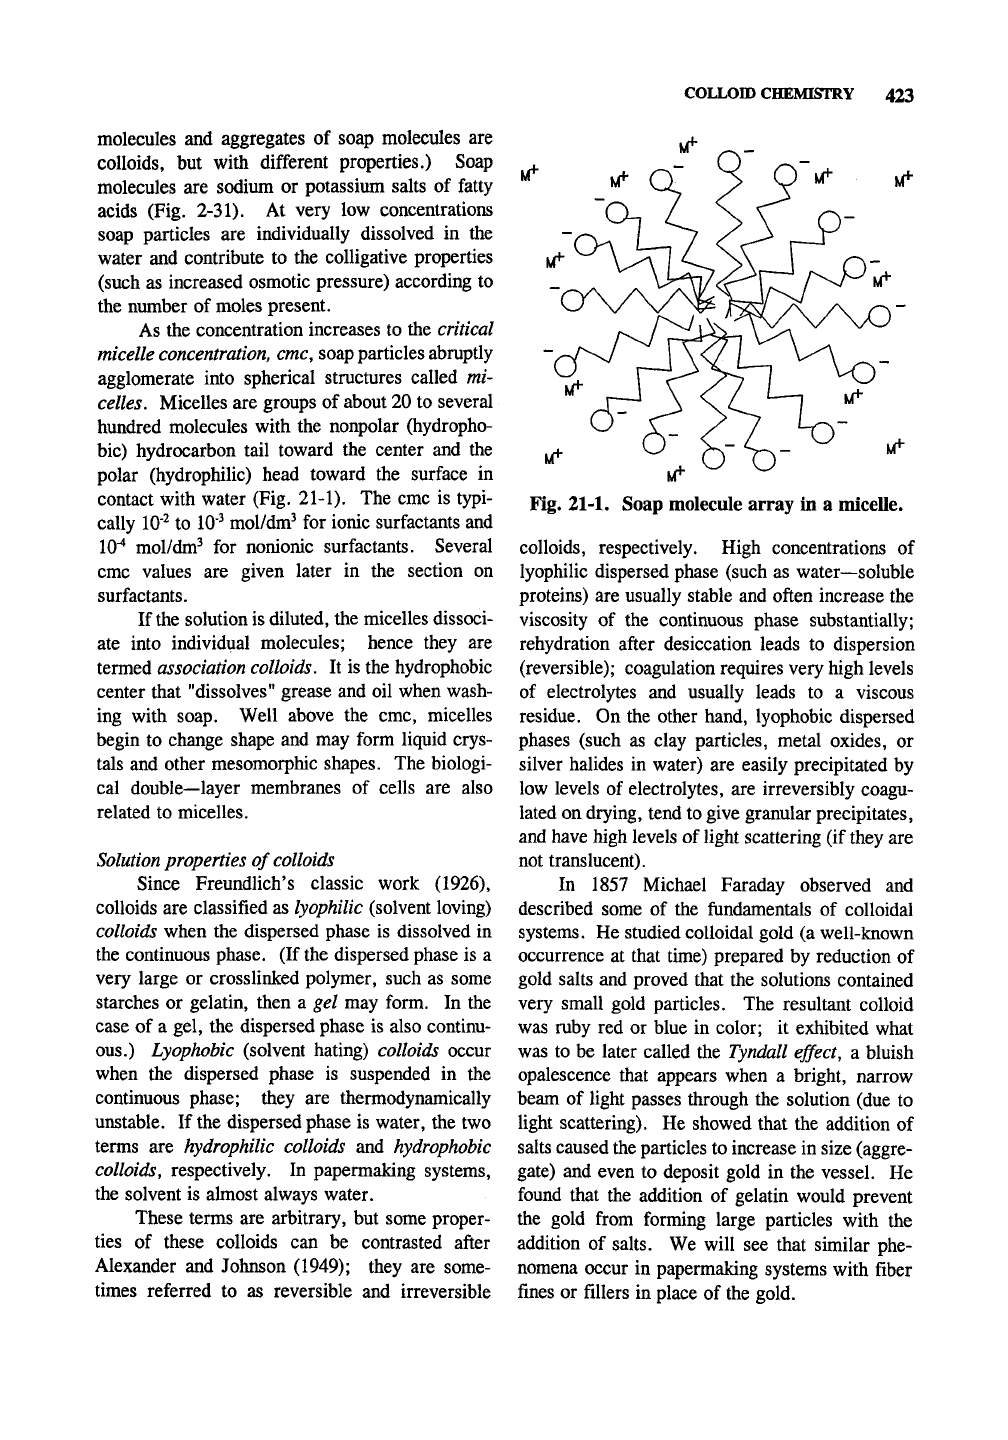
As the concentration increases to the critical
micelle
concentration,
cmc, soap particles abruptly
agglomerate into spherical structures called mi-
celles. Micelles are groups of about 20 to several
hundred molecules with the nonpolar (hydropho-
bic) hydrocarbon tail toward the center and the
polar (hydrophilic) head toward the surface in
contact with water (Fig. 21-1). The cmc is typi-
cally 10'^ to
10"^
mol/dm^ for ionic surfactants and
10"^
mol/dm^ for nonionic surfactants. Several
cmc values are given later in the section on
surfactants.
If
the
solution is diluted, the micelles dissoci-
ate into individual molecules; hence they are
termed association colloids. It is the hydrophobic
center that "dissolves" grease and oil when wash-
ing with soap. Well above the cmc, micelles
begin to change shape and may form liquid crys-
tals and other mesomorphic shapes. The biologi-
cal double—layer membranes of cells are also
related to micelles.
Solution
properties of
colloids
Since Freundlich's classic work (1926),
colloids are classified as lyophilic (solvent loving)
colloids when the dispersed phase is dissolved in
the continuous phase. (If the dispersed phase is a
very large or crosslinked polymer, such as some
starches or gelatin, then a gel may form. In the
case of a gel, the dispersed phase is also continu-
ous.) Lyophobic (solvent hating) colloids occur
when the dispersed phase is suspended in the
continuous phase; they are thermodynamically
unstable. If the dispersed phase is water, the two
terms are hydrophilic colloids and hydrophobic
colloids, respectively. In papermaking systems,
the solvent is almost always water.
These terms are arbitrary, but some proper-
ties of these colloids can be contrasted after
Alexander and Johnson (1949); they are some-
times referred to as reversible and irreversible
Fig. 21-1. Soap molecule array in a micelle.
colloids, respectively. High concentrations of
lyophilic dispersed phase (such as water—soluble
proteins) are usually stable and often increase the
viscosity of the continuous phase substantially;
rehydration after desiccation leads to dispersion
(reversible); coagulation requires very high levels
of electrolytes and usually leads to a viscous
residue. On the other hand, lyophobic dispersed
phases (such as clay particles, metal oxides, or
silver halides in water) are easily precipitated by
low levels of electrolytes, are irreversibly coagu-
lated on drying, tend to give granular precipitates,
and have high levels of light scattering (if they are
not translucent).
In 1857 Michael Faraday observed and
described some of the fundamentals of colloidal
systems. He studied colloidal gold (a well-known
occurrence at that time) prepared by reduction of
gold salts and proved that the solutions contained
very small gold particles. The resultant colloid
was ruby red or blue in color; it exhibited what
was to be later called the Tyndall effect, a bluish
opalescence that appears when a bright, narrow
beam of light passes through the solution (due to
light scattering). He showed that the addition of
salts caused the particles to increase in size (aggre-
gate) and even to deposit gold in the vessel. He
found that the addition of gelatin would prevent
the gold from forming large particles with the
addition of salts. We will see that similar phe-
nomena occur in papermaking systems with fiber
fines or fillers in place of the gold.