Claverie J-M., Notredame C. Bioinformatics for Dummies
Подождите немного. Документ загружается.


elements, or is it a transmembrane protein? In this chapter, we show you how
online tools can help you answer these questions.
The structure is also important, of course — so important that we’ve dedi-
cated two chapters of this book to its analysis (Chapter 11 for protein struc-
ture analysis and Chapter 12 for RNA structure analysis). For this reason, we
don’t talk much about structures in this chapter.
Knowing what your protein looks like is one thing, but knowing what it actu-
ally does is another. For instance, you may want to know if your protein binds
calcium or if it contains an enzymatic site. If it’s an enzyme, there’s no doubt
that you need to know about its substrate (the kind of molecule it binds). To
answer these types of questions, we show you three powerful methods to
check whether your protein contains a domain with a known function.
The other powerful technique that can help you when it comes to guessing
the function of a protein involves
similarity searches. If, in a database some-
where, you find a well-characterized protein whose sequence is very similar
to your protein, then you’re allowed to say that most of what is true for this
sequence is true for your sequence as well. Although we don’t wade into this
type of analysis in this chapter, don’t worry — we won’t leave you high and
dry. We cover everything you need to know about similarity searches in
Chapter 7.
Doing Biochemistry on a Computer
If you want to do some biochemistry using a computer — we’re guessing you
do — two terrific places to go are
The ExPASy (Expert Protein Analysis System) server at www.expasy.
org
, with a specific page dedicated to protein analysis methods
The Swiss EMBnet at www.ch.embnet.org
The people who created and maintain a big chunk of Swiss-Prot run these two
sites. When it comes to looking closely at proteins, these folks know their jobs.
In this section, we assume that your heart is set on a protein you’ve never
seen before. The only thing you know about this beauty is its sequence.
Maybe this protein comes from a sequencing project or something similar.
Before you open it up and check out the insides, you want to find out — and
guess — as much about it as you can. That’s the reason you’re here reading
this very informative chapter.
160
Part II: A Survival Guide to Bioinformatics
11_089857 ch06.qxp 11/6/06 3:56 PM Page 160

If you don’t have your own protein yet, don’t worry! For each example we use
in this chapter, we provide you with a Swiss-Prot protein of your very own
(the sequence, anyway). This way, you can always compare the results of the
program with the Swiss-Prot annotation.
In general, when using a program for the first time, it’s advisable to run it on a
well-characterized protein, simply to check and see whether the program
does what it says it does (and whether it does that well). To find a suitable
example, use one of the SRS servers as we describe in Chapter 2. This can
give you a sense of how good the program you’re using really is.
Predicting the main physico-chemical
properties of a protein
ProtParam, a program you can use online on the ExPASy server, is a conve-
nient way to estimate every simple physico-chemical property (that is, each
protein parameter) that can be deducted from your protein sequence. It
makes no complex and adventurous assumptions about your little protein: It
simply counts for you.
Here’s how it works:
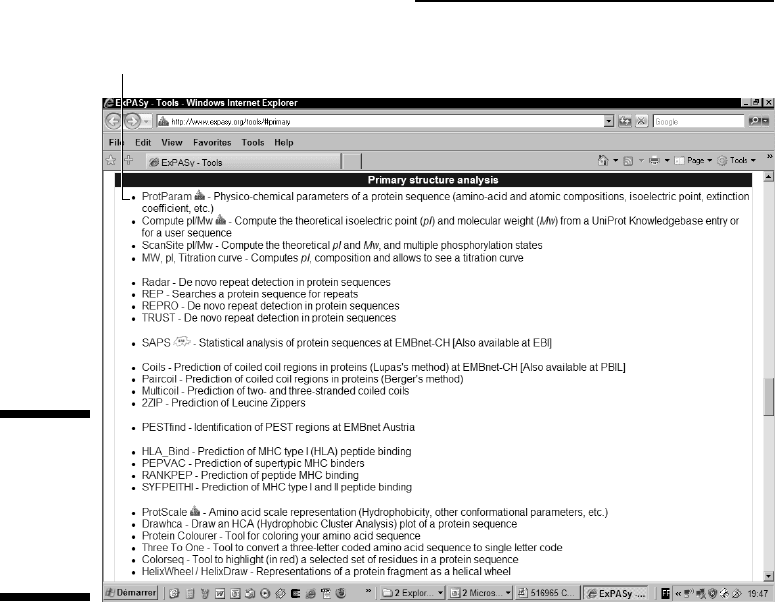
1. Point your favorite browser to
www.expasy.org/tools/#primary
The Primary Structure Analysis section of the ExPASy Proteomics Tools
page appears, as shown in Figure 6-1.
At the end of this chapter, we give you an exhaustive list of all the avail-
able ExPASy mirror sites you can use if the main ExPASy site is down.
2. Click the ProtParam link near the top of the page.
The ProtParam Tool page appears.
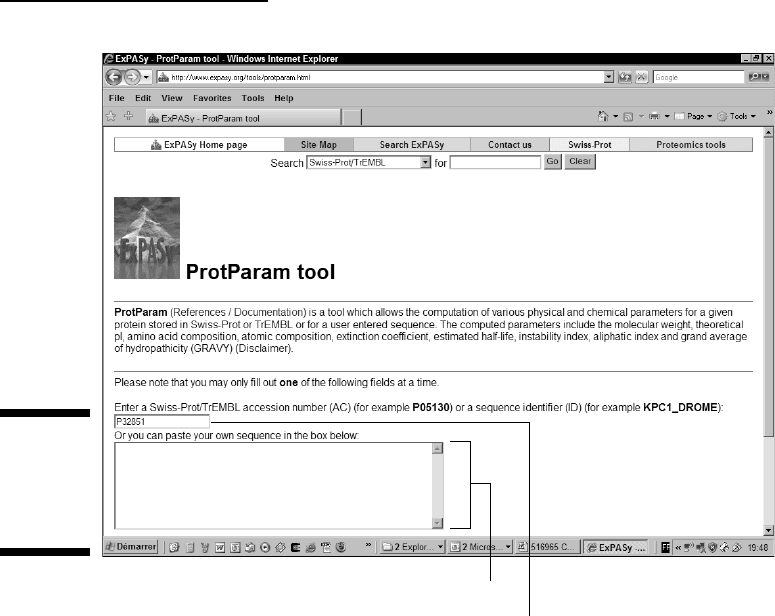
3. Enter your sequence in the search boxes provided.
Provide a sequence in one of two ways:
• Enter the accession number, as shown in Figure 6-2. You can do
this if your sequence exists in the Swiss-Prot sequence database.
Swiss-Prot accession numbers usually start with a letter followed
by five digits. In this example, we use a Swiss-Prot protein: rat
Syntaxin 1A (P32851).
161
Chapter 6: Working with a Single Protein Sequence
11_089857 ch06.qxp 11/6/06 3:56 PM Page 161
• Paste the sequence — in raw format — into the window provided (see
Figure 6-2 again). If your sequence isn’t a Swiss-Prot sequence, or if you
don’t know the sequence name, you can paste the sequence itself, using
this other window. Note that the sequence must be entered in
raw
format
— it should not include anything but the standard abbreviations
for amino acids (white space and numbers are tolerated but automati-
cally removed). If your sequence is in FASTA format, DO NOT include the
first line that starts with a greater-than sign (
>).
4. Click the Compute Parameters button.
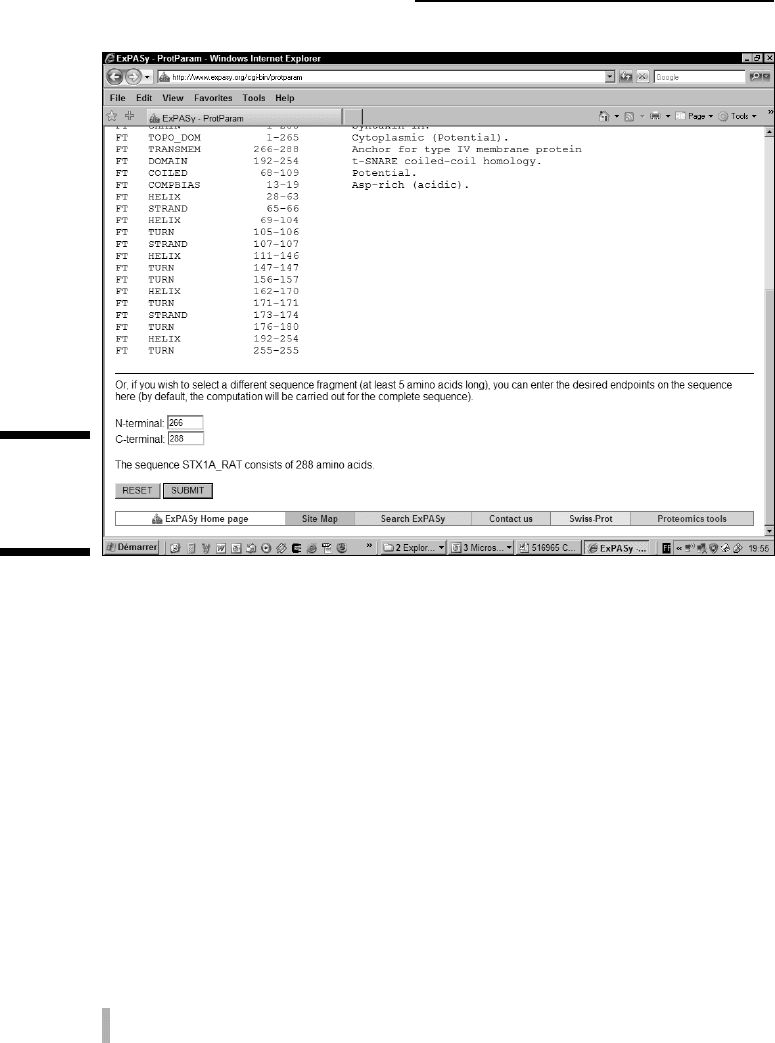
If, in Step 2, you provided the accession number of the sequence, an
intermediate page (like the one shown in Figure 6-3) appears.
5. If you have entered a Swiss-Prot accession number — and Figure 6-3
has dutifully appeared — enter the range of the analysis in the N-
Terminal and C-Terminal fields. (The N-terminus is the left side of
your protein sequence and the C-terminus is the right side.)
ProtParam link
Figure 6-1:
Working
with the
Primary
Structure
Analysis
page.
162
Part II: A Survival Guide to Bioinformatics
11_089857 ch06.qxp 11/6/06 3:56 PM Page 162
At the top of the page (partially) shown in Figure 6-3, you can find a list
of the features contained in your sequence. This isn’t a prediction —
rather, it’s a display of the information contained in the Swiss-Prot entry.
Below are two boxes (N-terminal and C-Terminal) that you can fill with
the coordinates of the segment you’re interested in. If you leave these
two boxes blank, ProtParam analyzes the complete sequence.
Using coordinates such as those in Figure 6-3, ProtParam analyzes the
segment of your protein that starts on the 266th amino acid and ends on
the 288th.
6. Press the Submit button to proceed with the analysis.
The results — including molecular weight, extinction coefficient, and
estimated half-life — appear on-screen.
7. In your Web browser, choose File➪Save As to save your results.
Paste a raw sequence here.
Enter accession number here.
Figure 6-2:
Entering an
accession
number into
ProtParam.
163
Chapter 6: Working with a Single Protein Sequence
11_089857 ch06.qxp 11/6/06 3:57 PM Page 163
Interpreting ProtParam results
If you’ve used Syntaxin as your sample protein in your trial run of ProtParam,
you can now proudly pass on the knowledge that Syntaxin’s theoretical molecular
weight is 33067,4 daltons, that its theoretical pI is 5.14, and that its aliphatic
index is 83.96 — and this is only a sample of the large amount of information
ProtParam can provide!
You can find detailed explanations on how ProtParam computes these parameters
at
www.expasy.org/tools/protpar-ref.html. Among other issues, the
following sections draw your attention to a few points you may be interested
in.
Molecular weight
The computer program is simply summing the weight of all the residues in
the sequence. Remember that the program doesn’t consider the following:
It does NOT consider post-translational modifications such as glycosyla-
tions or phosphorylations.
Figure 6-3:
Using
ranges with
ProtParam.
164
Part II: A Survival Guide to Bioinformatics
11_089857 ch06.qxp 11/6/06 3:57 PM Page 164

It does NOT take into account complex maturations such as the removal
of a lead peptide or the excision of an intein.
ProtParam does NOT know whether your mature protein becomes a
dimer (association of two proteins), a trimer (association of three pro-
teins), or any other kind of multimer.
Of course, these problems can eventually add up and lead to experimental
results significantly different from the theory. In a way, that’s where the fun
begins . . . so keep your eyes open!
Extinction coefficients
An extinction coefficient tells you how much light (visible and invisible) your
protein absorbs at a certain wavelength. Estimates of these values are useful if
you need to follow your protein with a spectrophotometer when you purify it.
When you use this result, remember that the ProtParam value is only an indi-
cation. ProtParam predicts the extinction coefficient by summing the contri-
bution of every amino acid as if each were independent. This calculation
ignores the fact that the behavior of amino acids can be dramatically altered
depending on their immediate surroundings. That behavior can’t be pre-
dicted, so this estimate isn’t exactly the last word (so to speak) on your pro-
tein’s extinction coefficient.
If you need the
exact coefficient, you must measure it experimentally. On the
other hand, for most proteins, the experimental coefficient is (fortunately)
rarely very different from the theoretical one.
Instability
This parameter is only just a crude estimate of your protein’s stability in a
test tube. When the index is below 40, the protein is usually stable. Above 40,
it may not be stable.
Half-life
The half-life is a crude prediction of the time it takes for half of the amount of
your protein present in a cell to disappear completely after its synthesis in
the cell. This prediction is given for three types of organisms. You can safely
extrapolate it to similar organisms.
The half-life value given here is meaningless if the degradation of your pro-
tein is part of a regulatory process. For instance, if the cell specifically directs
a
protease (a protein that digests other proteins) at your protein, your pro-
tein may disappear much faster than ProtParam tells you.
165
Chapter 6: Working with a Single Protein Sequence
11_089857 ch06.qxp 11/6/06 3:57 PM Page 165

Digesting a protein in a computer
Protease digestions — where you use an enzyme to cut your protein in spe-
cific ways — can be useful if you’re only interested in carrying out experi-
ments on a portion of your protein. They can also be useful if you want to
Separate the domains in your protein
Identify potential post-translational modification by mass spectrometry
Remove a tag protein when you express a fusion protein
Make sure that the protein you’re cloning isn’t sensitive to some endoge-
nous proteases
Fortunately, these days you can snip models of protein sequences in a
computer — and see what happens
before you start any hands-on lab proce-
dures. PeptideCutter is a very useful tool for this kind of purpose — and is
available from the ExPASy Web site at
www.expasy.org/tools/#proteome.
Check it out; you’ll find it easy to use. Paste in your sequence, choose an option
or two, click a button, and a model of your protein is sliced, diced, and
chopped to your specifications.
Doing Primary Structure Analysis
The primary structure is the amino acid sequence of your protein. When you
analyze the primary structure, you ignore the potential interactions between
amino acids. Primary structure analysis of your protein doesn’t tell you about
the potential interactions between the amino acids in your sequence; you
predict those when you predict the secondary or tertiary structure of your
protein. (See Chapter 11 for more on such predictions.)
You conduct a primary structure analysis to try to find segments in your pro-
tein that display a special composition. These segments can reveal some
interesting properties of your protein, such as
Hydrophobic regions that could be membrane-spanning segments in pro-
teins that anchor themselves into a membrane
Coiled-coil regions that indicate potential protein-protein interaction
Hydrophilic stretches that could be looping out at the surface of the protein
The methods we show you in this section, though less powerful than state-of-
the-art methods of predicting secondary structure (which we cover in Chapter
11), still have a lot going for them. For one, they’re simple to use and simple
to understand. When you use them, you can easily see what’s going on — and
easily avoid making mistakes.
166
Part II: A Survival Guide to Bioinformatics
11_089857 ch06.qxp 11/6/06 3:57 PM Page 166

Many of the methods we show you here rely on the sliding windows tech-
nique. (For more on these guys, check out the “Sliding windows” sidebar.)
Predictions based on sliding windows aren’t very sensitive or very precise,
but they are very robust. If you see a strong signal when using a method
based on sliding windows, chances are you’re looking at something that’s a
genuine biological signal.
Ironically, the main advantage of the methods that use sliding windows is
also one of their main shortcomings: They don’t interpret the results for you;
they provide only a raw signal.
Because you have to do the interpretation yourself, two simple rules apply
when interpreting the results of an analysis based on sliding windows:
Be very strict and consider only strong signals.
Check the robustness of your signal. Good signals aren’t shy. They don’t
go away simply because you increase or decrease the window size by
one amino acid or replace a property table with another similar table.
167
Chapter 6: Working with a Single Protein Sequence
Sliding windows
The “sliding windows” technique is the most
ancient way of looking at sequences. The prin-
ciple is very simple. What you need is a chemi-
cal property and a list of values associated with
each of the 20 amino acids. This property can
be any measurable physico-chemical parame-
ter, such as size, polarity, hydrophobicity, or
even the propensity of amino acids to be in a
specific structural state. The values in this table
are the amino acids’
scale values.
Many such
tables exist that have been determined experi-
mentally for almost any characteristic you can
think of.
After you have this table, you choose a window
size and slide it along your sequence. When the
window is centered on an amino acid, the scale
values associated with the amino acids it con-
tains are summed up and averaged. The result-
ing value is associated with the central amino
acid, and then the window is shifted by one
amino acid. This process goes on to the end of
the sequence. The following example illustrates
how the window slides along the sequence. The
letter <--X--> indicates the amino acid on which
the window is centered.
Sequence
AGVCFGTRESALPTFREDCYGHZPLI
KJFDESAQZ
<---A---> Window 1
<---G---> Window 2
<---V---> Window 3
When the sliding operation is finished, the
values associated with every amino acid are
plotted against the sequence. Biologists name
this display a property profile (do not confuse it
with a domain profile, which is a formulation of
a multiple sequence alignment). If you’re lucky,
you may be able to identify transmembrane seg-
ments, loops, or coiled-coil regions by using
sliding windows. Hydrophobicity is the most
popular analysis because it’s a good indicator
of transmembrane segments or core regions
within a protein.
11_089857 ch06.qxp 11/6/06 3:57 PM Page 167

Another major weakness of the sliding-window method is arbitrary window
size: why 9 residues instead of, say, 13 or 21? There is no magic answer to
this question, but when it comes to choosing your window size, the following
simple rule applies:
The window size must be in the same range as the size of the feature you’re
looking for.
For instance, if you’re looking for transmembrane domains that are normally 21
amino acids long, you want to use a window size that is close to this value — in
practice, 19 is the best window value for finding transmembrane regions. On
the other hand, if you’re interested in the structural features of globular pro-
teins, a range between 7 and 11 would be more appropriate.
Looking for transmembrane segments
Predicting that your protein has transmembrane segments tells you much
more about its function than almost any other simple prediction you can do.
When you know your protein is a transmembrane protein, you know that you
can’t work on it with the same techniques you’d use if it were a globular pro-
tein. If you find one transmembrane segment at the N-terminus of your
sequence, you can predict that the protein is secreted. On the other hand,
many transmembrane domains in one protein may indicate a channel.
Because these predictions are so important, we show you two methods for test-
ing for transmembrane segments: ProtScale (a very simple one) and TMHMM
(one of the most complete). TMHMM is not part of the ExPASy server; it is a
service offered to the community by the Technical University of Denmark.
ProtScale uses a sliding-window technique and one of many amino-acid
scale values. In this example, we use the hydrophobicity to identify the
groups of hydrophobic segments that characterize transmembrane pro-
teins. ProtScale doesn’t predict anything for you; it returns a hydropho-
bicity profile and lets you do the interpretation.
TMHMM is a state-of-the-art program that predicts transmembrane seg-
ments in your protein. TMHMM also tells you about the portions of
your protein that are probably inside the cell and those that are proba-
bly outside.
Running Protscale
Let’s start with Protscale:
1. Point your browser to www.expasy.org/cgi-bin/protscale.pl.
The ProtScale page duly appears.
168
Part II: A Survival Guide to Bioinformatics
11_089857 ch06.qxp 11/6/06 3:57 PM Page 168
2. Enter your sequence accession number in the small search box.
You can paste the sequence in raw format or enter a Swiss-Prot
Accession Number. (For an example of raw format, see Figure 6-2.)
Here we’ve entered
P78588, the accession number for FREL_CANAL pro-
tein, a protein that contains seven transmembrane segments.
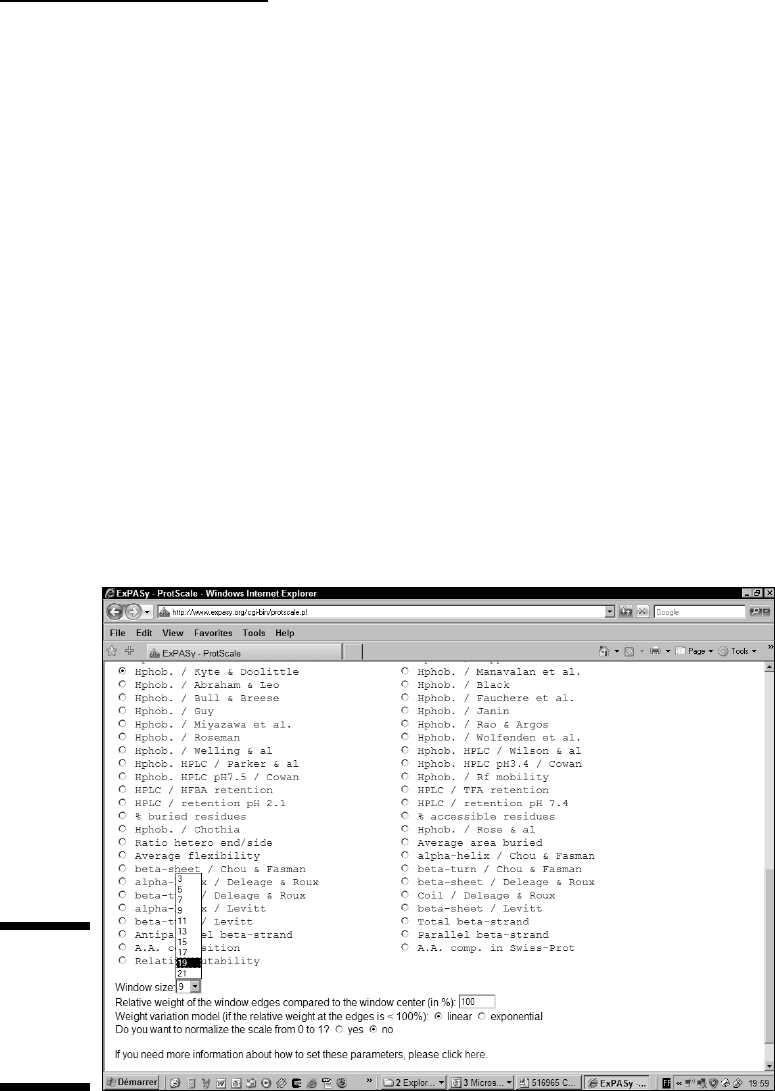
3. Scroll down the same page and then select the radio button next to
Hphob. / Kyte & Doolittle, as shown in Figure 6-4.
ProtScale gives you a large range of properties that you can choose and
test on your protein. The one we’ve chosen here is the most appropriate
for predicting transmembrane helices.
4. From the Window Size pull-down menu, choose 19.
This value is appropriate when you’re looking for transmembrane
domains.
5. Press the Submit button at the bottom of the page.
6. If you have entered a Swiss-Prot accession number, enter the range of
the analysis.
If, in Step 2, you have provided the accession number of the sequence,
an intermediate page appears like the one you saw in Figure 6-3.
Figure 6-4:
Choosing
a property
on the
ProtScale
server.
169
Chapter 6: Working with a Single Protein Sequence
11_089857 ch06.qxp 11/6/06 3:57 PM Page 169