Claverie J-M., Notredame C. Bioinformatics for Dummies
Подождите немного. Документ загружается.


biological relationships. Using them is mostly a matter of recognizing a few
graphic patterns and knowing which situations they correspond to.
In the following example, we show you some of these situations. For each
one, we assume that you have entered your sequences in Dotlet by using a
procedure like the one we describe in the section “Using Dotlet over the
Internet.”
Identifying tandem repeats
Proteins commonly contain a small domain repeated many times over. It
seems that internal duplication is a tool often used by evolution to create
new proteins or make them function more efficiently. Domains that you may
often find duplicated include the Fibronectin domain (we like to refer to it as
“molecular Velcro”), EF-hands that bind calcium, or Zn fingers involved in
DNA binding.
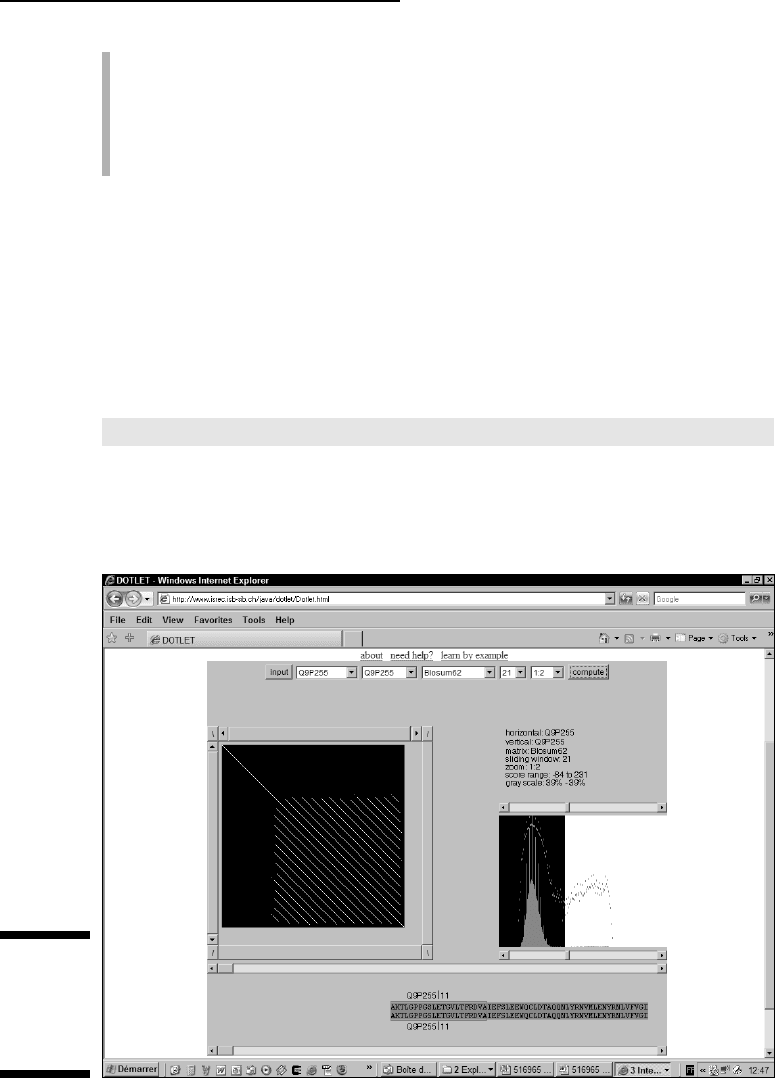
Dot plots constitute by far the best way to spot repeated domains. In Figure
8-7, we show you the YE73 human protein sequence. YE73 is a potential human
transcription factor (involved in RNA transcription) that contains 13 very
conserved Zn finger domains in tandem.
To analyze this sequence, follow these steps:
1. Point your browser to www.expasy.ch/cgi-bin/get-sprot-fasta
?Q9P255
.
Q9P255 is the ID number for the YE73 human protein sequence.
2. Enter the sequence into Dotlet, following the procedure we outline in
the section “Using Dotlet over the Internet.”
3. Set the threshold and window settings so they match those in
Figure 8-7.
You want a window size of 21, a zoom of 1:2, and a gray scale for the top
and bottom cursors of the threshold window set to 39%.
The pattern in Figure 8-7 is typical of tandem repeats. Notice the follow-
ing features:
• The main diagonal represents the sequence against itself.
• Repeats appear as long continuous diagonals above and below the
main diagonal.
• The diagonals are evenly spaced.
• The collection of diagonals is bound by the shape of a square.
Anytime you see this type of graphic pattern, you know you’re looking at
tandem repeats. If this is the case, you can use this collection of diagonals to
make three interesting deductions:
250
Part III: Becoming a Pro in Sequence Analysis
14_089857 ch08.qxp 11/6/06 3:59 PM Page 250
The number of repeats is equal to the number of diagonals above (or
below) the main diagonal (including the main diagonal).
The distance between two adjacent diagonals represents the size of the
repeat if no spacing falls between the repeats.
The shortest diagonal gives you the coordinates of a single repeat unit.
YE73 is an extreme example because it contains highly conserved repeats.
Life isn’t always so simple — and, in most cases, the repeated domains you
come across aren’t so similar (because of accumulated mutations). Proteins
that contain distantly related repeats produce more complicated dot-plot pat-
terns. In these proteins, each repeat unit doesn’t necessarily recognize every
other unit.
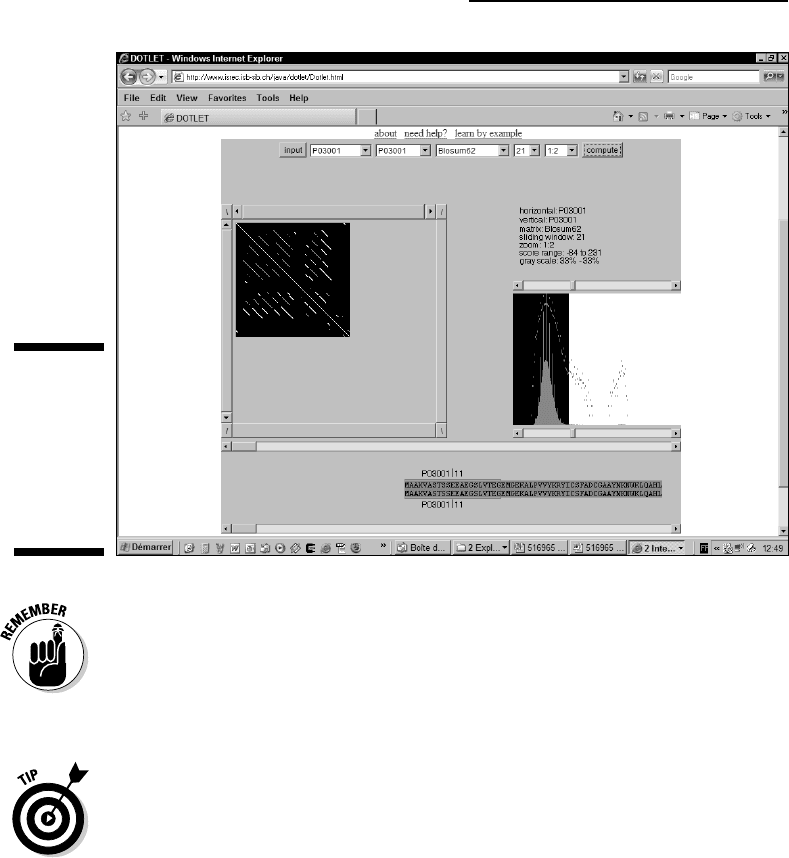
Figure 8-8 shows you such an example. Tf3a is a transcription factor that also
contains Zn finger domains in tandem. You can find the sequence at
www.expasy.ch/cgi-bin/get-sprot-fasta?P03001
Tf3a tells the story of Zn finger domains that have been duplicated and have
diverged since then. These Zn fingers are less conserved, and show a pattern
much less regular than what we obtained with YE73.
Figure 8-7:
Looking at
tandem
repeats with
Dotlet.
251
Chapter 8: Comparing Two Sequences
14_089857 ch08.qxp 11/6/06 3:59 PM Page 251
Tandem domains are not the only form of repeated domains in proteins or
DNA. It is safe to assume that any kind of repetition you can think of probably
occurs in proteins or in nucleic acids. If it has not yet been found, you can
bet it’s about to be discovered!
The signature of a repetition is always the same: It’s a diagonal that lies off
the main diagonal when you compare the sequence with itself.
Repeated domains can help you elucidate the function of your protein. If you
find a repeated domain with no known function — and no similarity with any
characterized protein — you can do the following:
1. Extract each repeat unit.
2. Make a multiple alignment of the domains.
See Chapter 9 for more about how to do this.
3. Identify conserved positions in the domain.
4. Turn your domain into a PROSITE pattern or a profile.
See Chapter 6 for more on PROSITE patterns.
5. Scan Swiss-Prot in order to check whether this pattern is associated
with a function.
Figure 8-8:
Looking at
the poorly
conserved
tandem
repeats of
Tf3a with
Dotlet.
252
Part III: Becoming a Pro in Sequence Analysis
14_089857 ch08.qxp 11/6/06 3:59 PM Page 252

Finding low-complexity regions in proteins
Low-complexity regions are segments that contain a certain amino acid more
often than you would expect in
normal proteins. For instance, a segment of 100
amino acids that contains 45 prolines is definitely a low-complexity segment.
Low-complexity regions often have biological functions like protein-protein
interaction (Leucine Zipper) or nonspecific DNA/RNA binding (ARG-rich
domains).
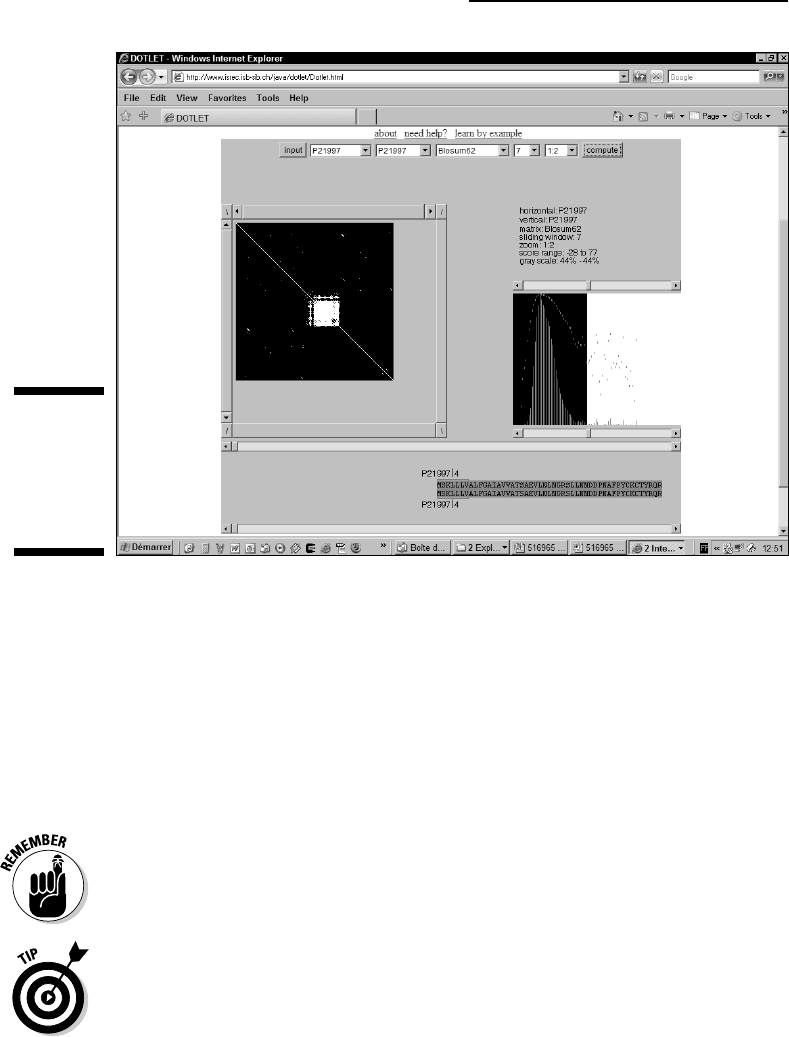
The good news about low-complexity regions is that seeing them on a dot
plot is really easy. When you compare a sequence with itself, low-complexity
regions pop up as squares. You can see one of these in Figure 8-9.
To reproduce the results you see on Figure 8-9, follow these steps:
1. Point your browser to www.expasy.ch/cgi-bin/get-sprot-fasta
?P21997
.
P21997 is the ID number for the sulfated surface glycoprotein 185.
2. Enter the sequence into Dotlet, following the procedure we outline in
the section “Using Dotlet over the Internet.”
3. Set the settings so they match those in Figure 8-9.
You need a window setting of 7, a zoom setting of 1:2, and a gray scale
for the top and bottom cursors of the threshold window set to 44%.
Analyzing nucleic acids with Dotlet
By nature, dot plots are well suited for mapping genes. Unfortunately, Dotlet
can be a bit slow for such applications, which routinely require the compari-
son of sequences longer than 10,000 residues.
Dotlet contains two useful features for analyzing nucleotide sequences:
If you compare a protein sequence and a nucleotide sequence: Dotlet
automatically translates the nucleotide sequences into its three possible
protein-reading frames. This way you can pinpoint exon/intron boundaries.
If you compare a nucleotide sequence with itself: Dotlet automatically
replaces one of the sequences with its complementary sequence. This
way, if your sequence contains two complementary strands (like a hairpin
stem in an RNA structure), they appear as diagonals going from the top-
right corner toward the bottom-left (perpendicular to the main diagonal).
If you want to use Dotlet for more refined sequence analysis, we recommend
the excellent online tutorial produced by Dotlet authors, available at
www.isrec.isb-sib.ch/java/dotlet/dotlet_examples.html
253
Chapter 8: Comparing Two Sequences
14_089857 ch08.qxp 11/6/06 3:59 PM Page 253
Making Local Alignments
over the Internet
If you’ve gone through the dot-plot section of this chapter, you know that
making a dot plot is an ideal way to get an overview of the relationship
between your sequences. Nonetheless, dot plots aren’t predictive methods:
They show a signal but don’t tell you what it means. To make this interpreta-
tion, you need a method that produces an alignment.
There are two kinds of alignments:
global (where the two sequences are
aligned over their entire lengths) and
local (where the program only aligns
the most similar portions of your two sequences and ignores the rest).
If you have a dot plot showing that your two sequences are related over their
entire lengths, you may not need to make a local alignment, and you can go
directly to the global alignment section of this chapter. If you’re not sure, stay
here!
Figure 8-9:
Identifying
low-
complexity
segments
with Dotlet.
254
Part III: Becoming a Pro in Sequence Analysis
14_089857 ch08.qxp 11/6/06 3:59 PM Page 254

There are two major reasons for analyzing your sequences with local
alignments:
To compare two distantly related sequences that share only a few non-
contiguous domains
To analyze repeated elements within a single sequence
Local alignment methods do exactly what their name implies: You give them
two sequences, and they output an alignment of the two most similar por-
tions of these sequences.
The nice thing about local alignment methods is that they automatically get
rid of the amino acids or nucleotides that they can’t align.
In theory, a local alignment should correspond to one of the diagonals that
appear on the dot plot. In practice, however, things aren’t so simple; you may
see a signal on the dot plot that doesn’t correspond to any local alignment,
and sometimes local alignment programs report alignments that don’t appear
on the dot plot. Only when the dot plot and the alignment agree perfectly can
you be sure.
Another rule with sequence alignments is that you should trust them only
when they are
clearly correct. (In this section, we show you what we mean by
“clearly correct.”) The only situation where you can use a suspicious align-
ment is when structural or experimental information exists that supports this
alignment.
Choosing the right local-alignment flavor
Two types of methods exist for making local pairwise alignments: a fast,
heuristic method named BLAST and a slower, more accurate one named
Lalign. Table 8-3 lists the pros and cons of these two methods so you can
select the one that suits you best.
The version of BLAST that compares two sequences is the same one you
can use for searching a database. It’s adapted so you can restrict it to two
sequences only, but it doesn’t generate alignments different from those BLAST
reports when it’s searching complete databases. In short, if you want to
check a hit, BLASTing two sequences can’t tell you anything more than the
database search. You can access this special flavor of BLAST at
www.ncbi.nlm.nih.gov/blast/bl2seq/wblast2.cgi
255
Chapter 8: Comparing Two Sequences
14_089857 ch08.qxp 11/6/06 3:59 PM Page 255

Table 8-3 Using BLAST or Lalign for a Pairwise Comparison
Property BLAST Lalign
Speed Very fast Slower
Size of sequences Very long sequences Shorter sequences
you can use
Score E-value Matrix score and E-value
Alignments Reports the single best Reports the ten best (or more)
Sequence type Best with DNA Best with proteins
Using Lalign to find the ten
best local alignments
The main problem when using BLAST is that this program only returns one
alignment: the best-scoring one. This is very useful for searching databases,
but it may not be so interesting if the region of the sequences you’re inter-
ested in happens to belong to a
good local alignment but not to the best local
alignment. It’s a bit like a music store that would only sell you one CD — the
number-one bestseller of the week.
Lalign is the ideal complement to BLAST. It is slower but more accurate, and
it returns as many local alignments as you want (the best scoring one, the
second best scoring, and so on, up to a number that you specify). Don’t worry
about the speed issue. On sequences shorter than a thousand symbols, you
may not notice any difference between the bl2seq server and Lalign.
In general, Lalign is great when it comes to analyzing complicated proteins
full of repeats. In the following steps list, we use Lalign to extract local align-
ments from two distantly related sequences that both contain a serine pro-
tease domain:
1. Point your browser to www.ch.embnet.org/software/
LALIGN_form.html
.
The Lalign page of ch.EMBnet.org appears.
2. Choose Local from the alignment method options, as shown in
Figure 8-10.
You can use the Lalign interface to do local and global alignments.
256
Part III: Becoming a Pro in Sequence Analysis
14_089857 ch08.qxp 11/6/06 3:59 PM Page 256
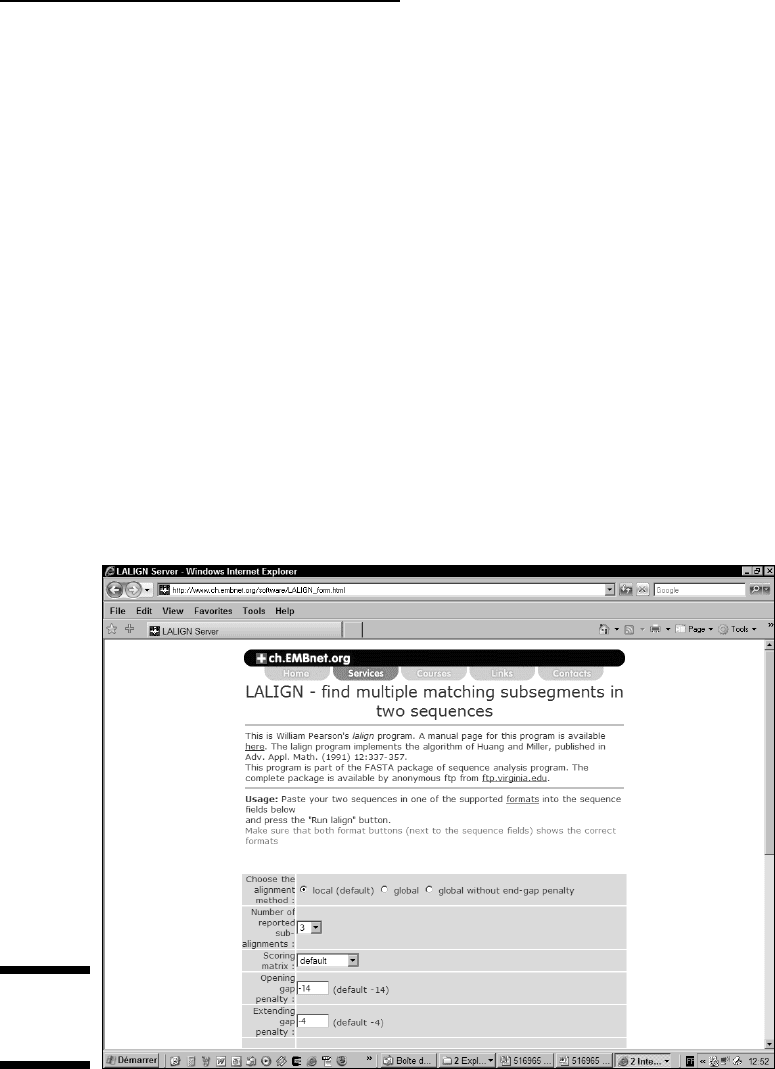
3. Choose the number of reported subalignments.
You should choose a number that corresponds roughly to the number of
diagonals you observed on the dot plot. If you want Lalign to report 10
local alignments, select 10.
4. Select the default substitution matrix.
The substitution matrix controls the cost of the mutations when Lalign
aligns the sequences.
The default matrix is an identity matrix for DNA and a BLOSUM45 for
proteins. In most cases, this default is entirely appropriate. If you want
to change the matrix, bear in mind that high BLOSUM indexes make
Lalign more stringent — and result in shorter alignments. Low PAM
indexes have the opposite effect.
5. Set the gap-opening penalty.
The gap-opening penalty defines the cost for opening a gap in one of the
sequences.
If you set the gap-opening penalty higher than its default value, local align-
ments that contain gaps may be split into several shorter alignments.
There is no simple rule to predict the optimal value for the gap penalty.
Figure 8-10:
The Lalign
home page.
257
Chapter 8: Comparing Two Sequences
14_089857 ch08.qxp 11/6/06 3:59 PM Page 257

The default values have been tuned on the default matrix. If you change
the matrix, Lalign does not automatically readjust the values. For
instance, if you use a BLOSUM with an index lower than 45, you must
decrease the gap-opening value and set it lower than 14.
6. Set the gap-extension penalty.
The gap-extension penalty is an extra penalty proportional to the length
of the gap. This penalty is added to the gap-opening penalty to yield the
complete gap cost. It must be about ten times lower than the gap-opening
penalty.
When you compare distantly related sequences, a high gap-opening
penalty and a very low gap-extension penalty often yield the best
results. They indicate that gaps should be penalized more on the basis
of their existence than of their length.
7. Choose Swiss-Prot ID or AC from the Input Sequence Format pull-
down menu.
You’ll need to scroll down the Lalign page to get to the menu.
8. Enter P05049 in the first sequence box.
P05049 is the accession number of the snake serine protease. If you
want to use a sequence that has no accession number, paste it in the
window — and make sure that you chose the correct format in Step 7.
9. Set the second format selector to Swiss-Prot ID or AC.
10. Enter P08246 in the second sequence box.
P08246 is the accession number of the human leucocyte elastase.
11. Click the Run Lalign button.
The computation should be relatively fast (less than one minute). If the
program doesn’t return any results, check to make sure you’ve submit-
ted the right parameters.
Lalign returns the results in the form of an HTML document.
12. Save your results.
Use the File➪Save As option of your Web browser to keep this result
in a file.
Interpreting the Lalign output
Lalign reports the number of local alignments you have specified — as in the
preceding Step 3 — sorted according to their score. An interesting property
of Lalign is that it only reports
nonoverlapping alignments.
This means that, in the Lalign output, you can find two amino acids or
nucleotides aligned together only once. They can appear in several alignments
258
Part III: Becoming a Pro in Sequence Analysis
14_089857 ch08.qxp 11/6/06 3:59 PM Page 258

of course, but they appear in front of each other only once. This prevents
Lalign from reporting trivial variations of a very good local alignment.
Figure 8-11 shows you the output of Lalign given the two sequences used in
the preceding steps list. Lalign reports the alignments in a BLAST-like format,
sorted according to their E-values. On the first line associated with each
alignment are the following features:
The percent identity: The proportion of identical residues aligned with
one another. For instance, you can see in Figure 8-11 that the best local
alignment has a percent-identity score of 25.7 percent; the second-best
score is 27.3 percent.
The local alignment length (Overlap): This is the total length of the
local alignment.
The score: This score sums up the cost of the gaps and substitutions, as
given by the substitution matrix and the gap penalties. Generally speak-
ing, the higher the score, the better the alignment — yet be aware that
the absolute value has no clear meaning. The E-value is a better indica-
tor of the alignment’s quality.
The E-value: This value tells you how many times you could have
expected to find such a good alignment by chance, given your two
sequences. Be aware that this E-value is much less meaningful than the
one BLAST reports when searching a database. A good E-value must be
below 10-
4
.
The alignment itself contains three types of information:
The residue index on the line above the sequence. The residue corre-
sponding to an index is the one below the last digit of this index.
The alignment itself, with gaps represented by dashes.
Identity and similarity. In the line between the two aligned sequences,
the (_) symbol means identity, while the (.) symbols mean similarity.
Two residues are similar when their substitution score is greater than 0.
The first alignment reported corresponds to the conserved serine protease
domain. On its own, this alignment isn’t really convincing: It contains less
than 26 percent identity over about 200 residues.
To be really convinced, we would need a much higher similarity (at least
close to 30 percent) and a better (lower) E-value. The reason we may trust
this alignment is because it is consistent with the signal we previously saw on
the dot plot. (Refer to Figure 8-7.) The fact that these two different analyses
give compatible results (Dotlet and Lalign) makes a good case for the exis-
tence of a conserved serine protease domain in our proteins.
259
Chapter 8: Comparing Two Sequences
14_089857 ch08.qxp 11/6/06 3:59 PM Page 259