Devore J.L., Berk K.N. Modern Mathematical Statistics with Applications
Подождите немного. Документ загружается.


Researchers often collect data by carryi ng out some sort of designed
experiment. This may involve deciding how to allocate several different treatments
(such as fertilizers or drugs) to the various experimental units (plots of land or
patients). Alternatively, an investigator may systematically vary the levels or
categories of certain factors (e.g., amount of fertilizer or dose of a drug) and
observe the effect on some response variable (such as corn yield or blood pressure).
Example 1.3 An article in the New York Times (January 27, 1987) reported that heart attack risk
could be reduced by taking aspirin. This conclusion was based on a designed
experiment involving both a control group of individuals, who took a placebo
having the appearance of aspirin but known to be inert, and a treatme nt group
who took aspirin according to a specified regimen. Subjects were randomly
assigned to the groups to protect against any biases and so that probability-based
methods could be used to analyze the data. Of the 11,034 individuals in the control
group, 189 subsequently experienced heart attacks, whereas only 104 of the 11,037
in the aspirin group had a heart attack. The incidence rate of heart attacks in the
treatment group was only about half that in the control group. One possible
explanation for this result is chance variation, that aspirin really doesn’t have the
desired effect and the observed difference is just typical variation in the same way
that tossing two identical coins would usually produce different numbers of heads.
However, in this case, inferential methods suggest that chance variation by itself
cannot adequately explain the magnitude of the observed difference.
■
Exercises Section 1.1 (1–9)
1. Give one possible sample of size 4 from each of the
following populations:
a. All daily newspapers published in the United
States
b. All companies listed on the New York Stock
Exchange
c. All students at your college or university
d. All grade point averages of students at your
college or university
2. For each of the following hypothetical populations,
give a plausible sample of size 4:
a. All distances that might result when you throw a
football
b. Page lengths of books published 5 years from
now
c. All possible earthquake-strength measurements
(Richter scale) that might be recorded in Califor-
nia during the next year
d. All possible yields (in grams) from a certain
chemical reaction carried out in a laboratory
3. Consider the population consisting of all DVD
players of a certain brand and model, and focus on
whether a DVD player needs service while under
warranty.
a. Pose several probability questions based on se-
lecting a sample of 100 such DVD players.
b. What inferential statistics question might be
answered by determining the number of such
DVD players in a sample of size 100 that need
warranty service?
4. a. Give three different examples of concrete popu-
lations and three different examples of hypothet-
ical populations.
b. For one each of your concrete and your hypo-
thetical populations, give an example of a prob-
ability question and an example of an inferential
statistics question.
5. Many universities and colleges have instituted sup-
plemental instruction (SI) programs, in which a
student facilitator meets regularly with a small
group of students enrolled in the course to promote
discussion of course material and enhance subject
mastery. Suppose that students in a large statistics
course (what else?) are randomly divided into a
control group that will not participate in SI and a
treatment group that will participate. At the end of
the term, each student’s total score in the course is
determined.
8
CHAPTER 1 Overview and Descriptive Statistics

a. Are the scores from the SI group a sample from
an existing population? If so, what is it? If not,
what is the relevant conceptual population?
b. What do you think is the advantage of randomly
dividing the students into the two groups rather
than letting each student choose which group to
join?
c. Why didn’t the investigators put all students in
the treatment group? [Note: The article “Supple-
mental Instruction: An Effective Component of
Student Affairs Programming” J. Coll. Stud.
Dev., 1997: 577–586 discusses the analysis of
data from several SI programs.]
6. The California State University (CSU) system con-
sists of 23 campuses, from San Diego State in the
south to Humboldt State near the Oregon border.
A CSU administrator wishes to make an inference
about the average distance between the hometowns
of students and their campuses. Describe and dis-
cuss several different sampling methods that might
be employed.
7. A certain city divides naturally into ten district
neighborhoods. A real estate appraiser would like
to develop an equation to predict appraised value
from characteristics such as age, size, number of
bathrooms, distance to the nearest school, and
so on. How might she select a sample of single-
family homes that could be used as a basis for this
analysis?
8. The amount of flow through a solenoid valve in an
automobile’s pollution-control system is an impor-
tant characteristic. An experiment was carried out
to study how flow rate depended on three factors:
armature length, spring load, and bobbin depth.
Two different levels (low and high) of each factor
were chosen, and a single observation on flow was
made for each combination of levels.
a. The resulting data set consisted of how many
observations?
b. Does this study involve sampling an existing
population or a conceptual population?
9. In a famous experiment carried out in 1882,
Michelson and Newcomb obtained 66 observations
on the time it took for light to travel between two
locations in Washington, D.C. A few of the mea-
surements (coded in a certain manner) were 31, 23,
32, 36, 22, 26, 27, and 31.
a. Why are these measurements not identical?
b. Does this study involve sampling an existing
population or a conceptual population?
1.2
Pictorial and Tabular Methods
in Descriptive Statistics
There are two general types of methods within descriptive statistics. In this section
we will discuss the first of these types—representing a data set using visual
techniques. In Sections 1.3 and 1.4, we will develop some numerical summary
measures for data sets. Many visual techniques may already be familiar to you:
frequency tables, tally sheets, histograms, pie charts, bar graphs, scatter diagrams,
and the like. Here we focus on a selected few of these techniques that are most
useful and relevant to probability and inferential statistics.
Notation
Some general notation will make it easier to apply our methods and formulas to
a wide variety of practical problems. The number of observations in a single
sample, that is, the sample size, will often be denoted by n, so that n ¼ 4 for
the sample of universities {Stanford, Iowa State, Wyoming, Rochester} and also
for the sample of pH measurements {6.3, 6.2, 5.9, 6.5}. If two samples are
simultaneously under consideration, either m and n or n
1
and n
2
can be used to
denote the numbers of observations . Thus if {3.75, 2.60, 3.20, 3.79} and {2.75,
1.20, 2.45} are grade point averages for students on a mathematics floor and the rest
of the dorm, respectively, then m ¼ 4 and n ¼ 3.
1.2 Pictorial and Tabular Methods in Descriptive Statistics 9

Given a data set consisting of n observations on some variable x,
the individual observations will be denoted by x
1
, x
2
, x
3
, ... , x
n
. The subscript
bears no relation to the magnitude of a particular observation. Thus x
1
will not
in general be the smallest observation in the set, nor will x
n
typically be the
largest. In many applications, x
1
will be the first observation gathered by
the experimenter, x
2
the second, and so on. The ith observation in the data set
will be denoted by x
i
.
Stem-and-Leaf Displays
Consider a numerical data set x
1
, x
2
, ..., x
n
for which each x
i
consists of at least two
digits. A quick way to obtain an informative visual representation of the data set is
to construct a stem-and-leaf display.
STEPS FOR
CONSTRUCT-
ING A STEM-
AND-LEAF
DISPLAY
1. Select one or more leading digits for the stem values. The trailing digits
become the leaves.
2. List possible stem values in a vertical column.
3. Record the leaf for every observation beside the corresponding stem
value.
4. Or der the leaves from smallest to largest on each line.
5. Indi cate the units for stems and leaves someplace in the display.
If the data set consists of exam scores, each between 0 and 100, the score of 83
would have a stem of 8 and a leaf of 3. For a data set of automobile fuel efficiencies
(mpg), all between 8.1 and 47.8, we could use the tens digit as the stem, so 32.6
would then have a leaf of 2.6. Usually, a display based on between 5 and 20 stems is
appropriate.
For a simple example, assume a sample of seven test scores: 93, 84, 86, 78,
95, 81, 72. Then the first pass stem plot would be
7|82
8|461
9|35
With the leaves order ed this becomes
7|28 stem: tens digit
8|146 leaf: ones digit
9|35
Example 1.4
The use of alcohol by college students is of great concern not only to those in the
academic community but also, because of potential health and safety consequences,
to society at large. The article “Health and Behavioral Consequences of Binge
Drinking in College” (J. Amer. Med. Assoc., 1994: 1672–1677) reported on a
comprehensive study of heavy drinking on campuses across the United States.
A binge episode was defined as five or more drinks in a row for males and
10 CHAPTER 1 Overview and Descriptive Statistics

four or more for femal es. Figure 1.3 shows a stem-and-leaf display of 140 values
of x ¼ the percentage of undergraduate students who are binge drinkers.
(These values were not given in the cited article, but our display agrees with a
picture of the data that did appear.)
The first leaf on the stem 2 row is 1, which tells us that 21% of the students at
one of the colleges in the sample were binge drinkers. Without the identification of
stem digits and leaf digits on the display, we wouldn’t know whether the stem 2,
leaf 1 observation should be read as 21%, 2.1%, or .21%.
The display suggests that a typical or representative value is in the stem 4
row, perhaps in the mid-40% range. The observations are not highly concentrated
about this typical value, as would be the case if all values were between 20% and
49%. The display rises to a single peak as we move downward, and then declines;
there are no gaps in the display. The shape of the display is not perfectly symmetric,
but instead appears to stretch out a bit more in the direction of low leaves than in
the direction of high leaves. Lastly, there are no observations that are unusually far
from the bulk of the data (no outliers), as would be the case if one of the 26% values
had instead been 86%. The most surprising feature of this data is that, at most
colleges in the sample, at least one-quarter of the students are binge drinkers. The
problem of heavy drinking on campuses is much more pervasive than many had
suspected.
■
A stem-and-leaf display conveys information about the following aspects of
the data:
• Identification of a typical or representative value
• Extent of spread about the typical value
• Presence of any gaps in the data
• Extent of symmetry in the distribution of values
• Number and location of peaks
• Presence of any outlying values
Example 1.5 Figure 1.4 presents stem-and-leaf displays for a random sample of lengths of golf
courses (yards) that have been designated by Golf Magazine as among the most
challenging in the United States. Among the sample of 40 courses, the shortest is
6433 yards long, and the longest is 7280 yards. The lengths appear to be distributed
in a roughly un iform fashion over the range of values in the sample. Notice that a
stem choice here of either a single digit (6 or 7) or three digits (643, ..., 728) would
yield an uninformative display, the first because of too few stems and the latter
because of too many.
0|4
1|1345678889
2|1223456666777889999
Stem: tens digit
3|0112233344555666677777888899999
Leaf: ones digit
4|111222223344445566666677788888999
5|00111222233455666667777888899
6
|
01111244455666778
Figure 1.3 Stem-and-leaf display for percentage binge drinkers at each of 140 colleges
1.2 Pictorial and Tabular Methods in Descriptive Statistics 11

■
Dotplots
A dotplot is an attractive summary of numerical data when the data set is reason-
ably small or there are relatively few distinct data values. Each observation is
represented by a dot above the corresponding location on a horizontal measurement
scale. When a value occurs more than once, there is a dot for each occurrence, and
these dots are stacked vertically. As with a stem-and-leaf display, a dotplot gives
information about location, spread, extremes, and gaps.
Example 1.6 Figure 1.5 shows a dotplot for the first grade IQ data introduced in Example 1.2 in
the previous section. A representative IQ value is around 110, and the data is fairly
symmetric about the center.
If the data set discussed in Example 1.6 had consisted of the IQ average from
each of 100 classes, each recorded to the nearest tenth, it would have been much
more cumbersome to construct a dotplot. Our next technique is well suited to such
situations.
It should be mentioned that for some software packages (including R) the dot
plot is entirely different.
Histograms
Some numerical data is obtained by counting to determine the value of a variable
(the number of traffic citations a person received during the last year, the number of
persons arriving for service during a particular period), whereas other data is
81 90 99 108 117 126 135 144
First grade IQ
Figure 1.5 A dotplot of the first grade IQ scores ■
64| 33 35 64 70 Stem: Thousands and hundreds digits
65| 06 26 27 83
Leaf: Tens and ones digits
66| 05 14 94
67| 00 13 45 70 70 90 98
68| 50 70 73 90
69| 00 04 27 36
70| 05 11 22 40 50 51
71| 05 13 31 65 68 69
72| 09 80
Stem-and-leaf of yardage N = 40
Leaf Unit = 10
64 3367
65 0228
66 019
67 0147799
68 5779
69 0023
70 012455
71 013666
72 08
ab
Figure 1.4 Stem-and-leaf displays of golf course yardages: (a) two-digit
leaves; (b) display from MINITAB with truncated one-digit leaves
12
CHAPTER 1 Overview and Descriptive Statistics

obtained by taking measurements (weight of an individual, reaction time to a
particular stimulus). The prescription for drawing a histogram is generally different
for these two cases.
Consider first data resulting from observations on a “counting variable” x.
The frequency of any particular x value is the number of times that valu e occurs in
the data set. The relative frequency of a value is the fraction or proportion of times
the value occurs:
relative frequency of a value ¼
number of times the value occurs
number of observations in the dataset
Suppose, for example, that our data set consists of 200 observations on
x ¼ the number of major defects in a new car of a certain type. If 70 of these x
values are 1, then
frequency of the x value 1 : 70
relative frequency of the x value 1 :
70
200
¼ :35
Multiplying a relative frequency by 100 gives a percentage; in the defect example,
35% of the cars in the sample had just one major defect. The relative frequencies, or
percentages, are usually of more interest than the frequencies themselves. In theory,
the relative frequencies should sum to 1, but in practice the sum may differ slightly
from 1 because of rounding. A frequency distribution is a tabulation of the
frequencies and/or relative frequencies.
A HISTO-
GRAM FOR
COUNTING
DATA
First, determine the frequenc y and relative frequency of each x value. Then
mark possible x values on a horizontal scale. Above each value, draw a
rectangle whose height is the relative frequency (or alternatively, the fre-
quency) of that value.
This construction ensures that the area of each rectangle is proportional to the
relative frequency of the value. Thus if the relative frequencies of x ¼ 1 and x ¼ 5
are .35 and .07, respectively, then the area of the rectangle above 1 is five times the
area of the rectangle above 5.
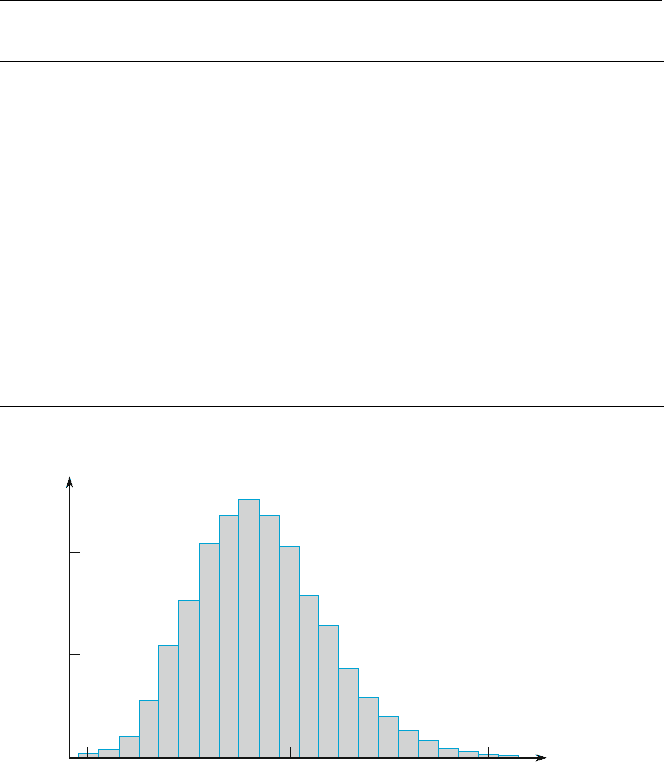
Example 1.7 How unusual is a no-hitter or a one-hitter in a major league baseball game, and how
frequently does a team get more than 10, 15, or even 20 hits? Table 1.1 is a
frequency distribution for the number of hits per team per game for all nine-inning
games that were played between 1989 and 1993. Notice that a no-hitter happens
only about once in a 1000 games, and 22 or more hits occurs with about the same
frequency.
The corresponding histogram in Figure 1.6 rises rather smoothly to a single
peak and then declines. The histogram extends a bit more on the right (toward large
values) than it does on the left, a slight “positive skew.”
1.2 Pictorial and Tabular Methods in Descriptive Statistics 13
Either from the tabulated information or from the histogram itself, we can
determine the following:
proportion of games with relative relative relative
at most two hits ¼ frequency þ frequency þ frequency
for x ¼0 for x ¼1 for x ¼2
¼ :0010 þ :0037 þ :0108 ¼ :0155
Similarly,
proportion of games with
between 5 and 10 hits inclusiveðÞ¼:0752 þ:1026 þ þ:1015 ¼:6361
That is, roughly 64% of all these games resulted in between 5 and 10
(inclusive) hits.
■
Table 1.1 Frequency distribution for hits in nine-inning games
Hits/game
Number
of games
Relative
frequency Hits/game
Number
of games
Relative
frequency
0 20 .0010 14 569 .0294
1 72 .0037 15 393 .0203
2 209 .0108 16 253 .0131
3 527 .0272 17 171 .0088
4 1048 .0541 18 97 .0050
5 1457 .0752 19 53 .0027
6 1988 .1026 20 31 .0016
7 2256 .1164 21 19 .0010
8 2403 .1240 22 13 .0007
9 2256 .1164 23 5 .0003
10 1967 .1015 24 1 .0001
11 1509 .0779 25 0 .0000
12 1230 .0635 26 1 .0001
13 834 .0430 27 1 .0001
19,383 1.0005
10
.05
0
0
.10
Hits/game
20
Relative frequency
Figure 1.6 Histogram of number of hits per nine-inning game
14
CHAPTER 1 Overview and Descriptive Statistics

Constructing a histogram for measurement data (observations on a
“measurement variable”) entails subdividing the measurement axis into a suitable
number of class intervals or classes, such that each observation is contained in
exactly one class. Suppose, for example, that we have 50 observations on x ¼ fuel
efficiency of an automobile (mpg), the smallest of which is 27.8 and the largest of
which is 31.4. Then we could use the class boundaries 27.5, 28.0, 28.5, ..., and 31.5
as shown here:
27.5 28.0 29.0 30.0 31.028.5 29.5 30.5 31.5
One potential difficulty is that occasionally an observation falls on a class boundary
and therefore does not lie in exactly one interval, for example, 29.0. One way to
deal with this problem is to use boundaries like 27.55, 28.05, ..., 31.55. Adding a
hundredths digit to the class boundaries prevents observations from falling on the
resulting boundaries. The approach that we will follow is to write the class intervals
as 27.5–28, 28–28.5, and so on and use the convention that any observation falling
on a class boundary will be included in the class to the right of the observation.
Thus 29.0 would go in the 29–29.5 class rather than the 28.5–29 class. This is how
MINITAB constructs a histogram. However, the default histogram in R does it the
other way, with 29.0 going into the 28.5–29.0 class.
A HISTO-
GRAM FOR
MEASURE-
MENT DATA:
EQUAL CLASS
WIDTHS
Determine the frequency and relative frequency for each class. Mark the class
boundaries on a horizontal measurement axis. Above each class interval, draw a
rectangle whose height is the corresponding relative frequency (or frequency).
Example 1.8 Power companies need information about customer usage to obtain accurate fore-
casts of demands. Investigators from Wisconsin Power and Light determined
energy consumption (BTUs) during a particular period for a sample of 90 gas-
heated homes. An adjusted consumption value was calculated as follows:
adjusted consumption ¼
consumption
(weather in degree days)(house area)
This resulted in the accompanying data (part of the stored data set FURNACE.
MTW available in MINITAB), which we have ordered from smallest to largest.
2.97 4.00 5.20 5.56 5.94 5.98 6.35 6.62 6.72 6.78
6.80 6.85 6.94 7.15 7.16 7.23 7.29 7.62 7.62 7.69
7.73 7.87 7.93 8.00 8.26 8.29 8.37 8.47 8.54 8.58
8.61 8.67 8.69 8.81 9.07 9.27 9.37 9.43 9.52 9.58
9.60 9.76 9.82 9.83 9.83 9.84 9.96 10.04 10.21 10.28
10.28 10.30 10.35 10.36 10.40 10.49 10.50 10.64 10.95 11.09
11.12 11.21 11.29 11.43 11.62 11.70 11.70 12.16 12.19 12.28
12.31 12.62 12.69 12.71 12.91 12.92 13.11 13.38 13.42 13.43
13.47 13.60 13.96 14.24 14.35 15.12 15.24 16.06 16.90 18.26
1.2 Pictorial and Tabular Methods in Descriptive Statistics 15
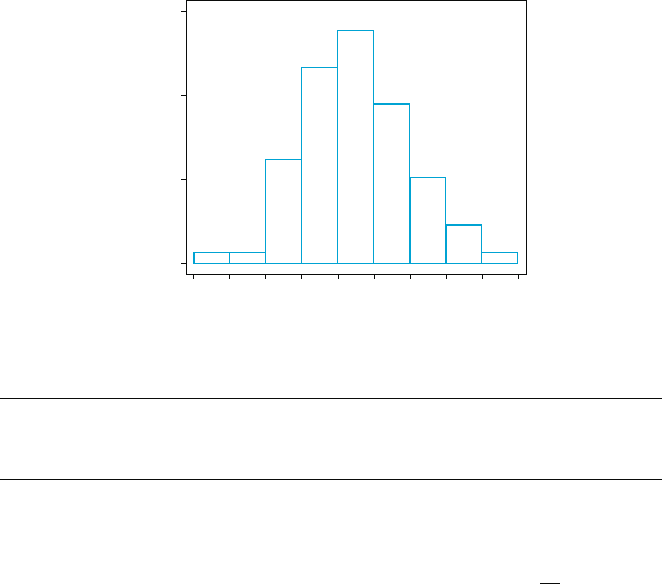
We let MINITAB select the class intervals. The most striking feature of the
histogram in Figure 1.7 is its resemblance to a bell-shaped (and therefore symmet-
ric) curve, with the point of symmetry roughly at 10.
Class 1–3 3–5 5–7 7–9 9–11 11–13 13–15 15–17 17–19
Frequency 1 1 11 21 25 17 9 4 1
Relative frequency .011 .011 .122 .233 .278 .189 .100 .044 .011
From the histogram,
proportion of
observations :01 þ:01 þ:12 þ:23 ¼:37 exact value ¼
34
90
¼:378
less than 9
The relative frequency for the 9–11 class is about .27, so we estimate that roughly
half of this, or .135, is between 9 and 10. Thus
proportion of observations
less than 10 :37 þ:135 ¼:505 ðslightly more than 50%Þ
The exact value of this proportion is 47/90 ¼ .522.
■
There are no hard-and-fast rules concerning either the number of classes or
the choice of classes themselves. Between 5 and 20 classes will be satisfactory for
most data sets. Generally, the larger the number of observations in a data set, the
more classes should be used. A reasonable rule of thumb is
number of classes
ffiffiffiffiffiffiffiffiffiffiffiffiffiffiffiffiffiffiffiffiffiffiffiffiffiffiffiffiffiffiffiffiffiffiffiffiffiffiffiffiffiffiffiffiffiffiffi
number of observations
p
Equal-width classes may not be a sensible choice if a data set “stretches out”
to one side or the other. Figur e 1.8 show s a dotplot of such a data set. Using a small
number of equal-width classes results in almost all observations falling in just
719117395131511
30
10
20
0
BTUN
Percent
Figure 1.7 Histogram of the energy consumption data from Example 1.8
16
CHAPTER 1 Overview and Descriptive Statistics
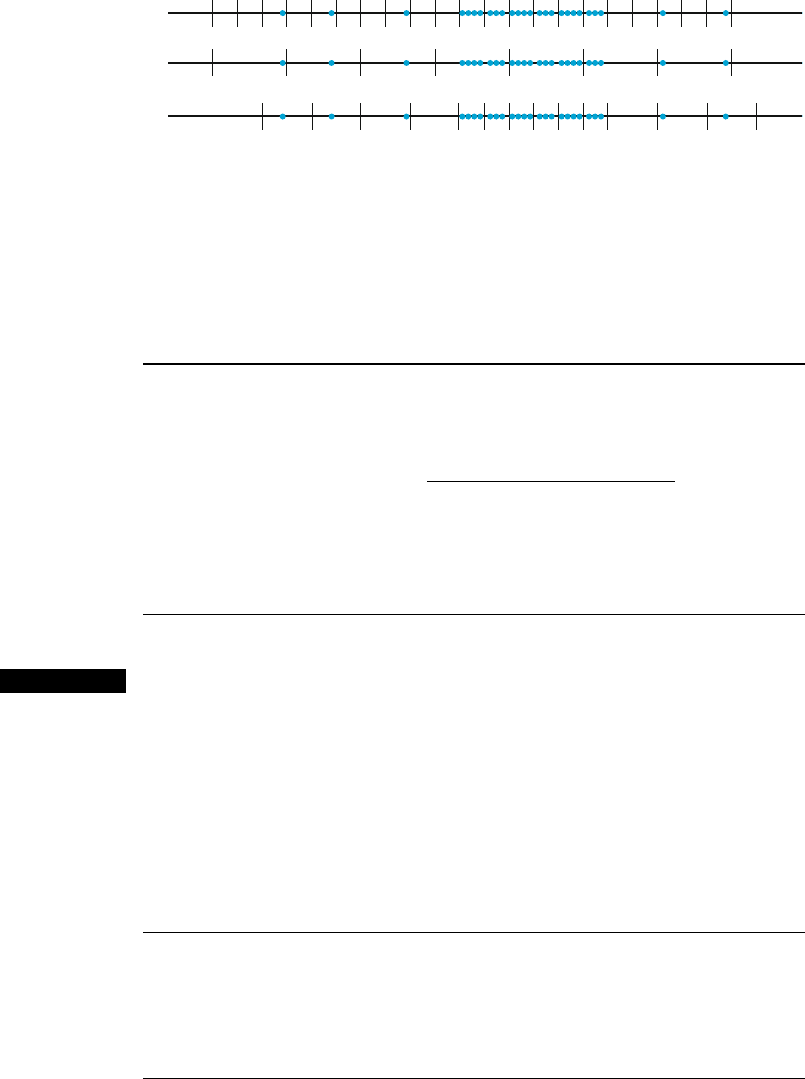
one or two of the classes. If a large number of equal-width classes are used,
many classes will have zero frequency. A sound choi ce is to use a few wider
intervals near extreme observations and narrower intervals in the region of high
concentration.
A HISTO-
GRAM FOR
MEASURE-
MENT DATA:
UNEQUAL
CLASS
WIDTHS
After determining frequencies and relative frequencies, calculate the height
of each rectangle using the formula
rectangle height ¼
relative frequency of the class
class width
The resulting rectangle heights are usually called densities, and the
vertical scale is the density scale. This prescription will also work when class
widths are equal.
Example 1.9 There were 106 active players on the two Super Bowl teams (Green Bay and
Pittsburgh) of 2011. Here are their weights in order:
180 180 184 185 186 190 190 191 191 191 194 195 195 196 198 199 200 200 200
200 200 202 203 205 205 207 207 207 208 208 208 209 209 213 215 216 216 217
218 219 225 225 225 229 230 230 231 233 234 235 236 238 239 241 242 243 245
245 247 248 250 250 250 252 252 254 255 255 255 256 260 262 263 265 270 280
285 285 290 298 300 300 304 305 305 305 305 306 308 308 314 315 316 318 318
318 319 320 324 325 325 337 338 340 344 365
and here they are in categories:
Class
180
–190
190
–200
200
–210
210
–220
220
–240
240
–260
260
–300
300
–310
310
–320
320
–330
330
–370
Frequency 5 11 17 7 13 17 10 10 7 4 5
Relative
frequency .047 .104 .160 .066 .123 .160 .094 .094 .066 .038 .047
Density .0047 .0104 .0160 .0066 .0061 .0080 .0024 .0094 .0066 .0038 .0012
The resulting histogram appears in Figure 1.9.
a
b
c
Figure 1.8 Selecting class intervals for “stretched-out” dots: (a) many short
equalwidth intervals; (b) a few wide equal-width intervals; (c) unequal-width intervals
1.2 Pictorial and Tabular Methods in Descriptive Statistics 17