Devore J.L., Berk K.N. Modern Mathematical Statistics with Applications
Подождите немного. Документ загружается.

40 52 55 60 70 75 85 85 90 90 92 94 94 95 98 100 115 125 125
The five-number summary is as follows:
~
largest x
i
= 125
x = 90lower fourth = 72.5 upper fourth = 96.5
smallest x
i
= 40
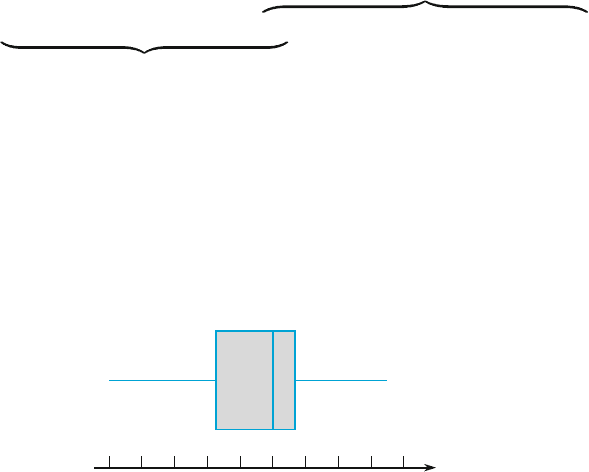
Figure 1.17 shows the resulting boxplot. The right edge of the box is much closer to
the median than is the left edge, indicating a very substantial skew in the middle
half of the data. The box width (f
s
) is also reasonably large relative to the range of
the data (distance between the tips of the whiskers).
Figure 1.18 shows MINITAB output from a request to describe the corrosion
data. The trimmed mean is the average of the 17 observations that remain after the
largest and smallest values are deleted (trimming percent age 5%). Q1 and Q3 are
the lower and upper quartiles; these are similar to the fourths but are calculated in a
slightly different manner. SE Mean is s
ffiffiffi
n
p
= ; this will be an important quantity in
our subsequent work concerning inferences about m .
Boxplots That Show Outliers
A boxplot can be embellished to indicate explicitly the presence of outliers.
40 50 60 70 80 90 100 110 120 130
Depth
Figure 1.17 A boxplot of the corrosion data
SEN
19
86.32
90.00
98.00
86.76
23.32
70.00
40.00
125.00
Q1 Q3
Variable
Variable
depth
depth
Minimum Maximum
Mean Median
TrMean
StDev
5.35
Mean
Figure 1.18 MINITAB description of the pit-depth data ■
38 CHAPTER 1 Overview and Descriptive Statistics

DEFINITION
Any observation farther than 1.5f
s
from the closest fourth is an outlier.An
outlier is extreme if it is more than 3f
s
from the nearest fourth, and it is mild
otherwise.
Let’s now modify our previous construction of a boxplot by drawing a
whisker out from each end of the box to the smallest and largest observations
that are not outliers. Each mild outlier is represented by a closed circle and each
extreme outlier by an open circle. Some statistical computer packages do not
distinguish between mild and extreme outliers.
Example 1.17 The Clean Water Act and subsequent amendments require that all waters in the
United States meet specific pollution reduction goals to ensure that water is
“fishable and swimmable.” The article “Spurious Correlation in the USEPA Rating
Curve Method for Estimating Pollutant Loads” (J. Environ. Eng., 2008: 610–618)
investigated various techniques for estimating pollutant loads in watersheds; the
authors “discuss the imperative need to use sound statistical methods” for this
purpose. Among the data considered is the following sample of TN (total nitrogen)
loads (kg N/day) from a particular Chesapeake Bay location, displayed here in
increasing order.
9.69 13.16 17.09 18.12 23.70 24.07 24.29 26.43
30.75 31.54 35.07 36.99 40.32 42.51 45.64 48.22
49.98 50.06 55.02 57.00 58.41 61.31 64.25 65.24
66.14 67.68 81.40 90.80 92.17 92.42 100.82 101.94
103.61 106.28 106.80 108.69 114.61 120.86 124.54 143.27
143.75 149.64 167.79 182.50 192.55 193.53 271.57 292.61
312.45 352.09 371.47 444.68 460.86 563.92 690.11 826.54
1529.35
Relevant summary quantities are
~
x ¼ 92:17 lower fourth ¼ 45:64 upper fourth ¼ 167: 79
f
s
¼ 122:15 1:5f
s
¼ 183:225 3f
s
¼ 366:45
Subtracting 1.5f
s
from the lower fourth gives a negative number, and none of the
observations are negative, so there are no outliers on the lower end of the data.
However,
upper fourth + 1:5f
s
¼ 351:015 upper fourth + 3f
s
¼ 534:24
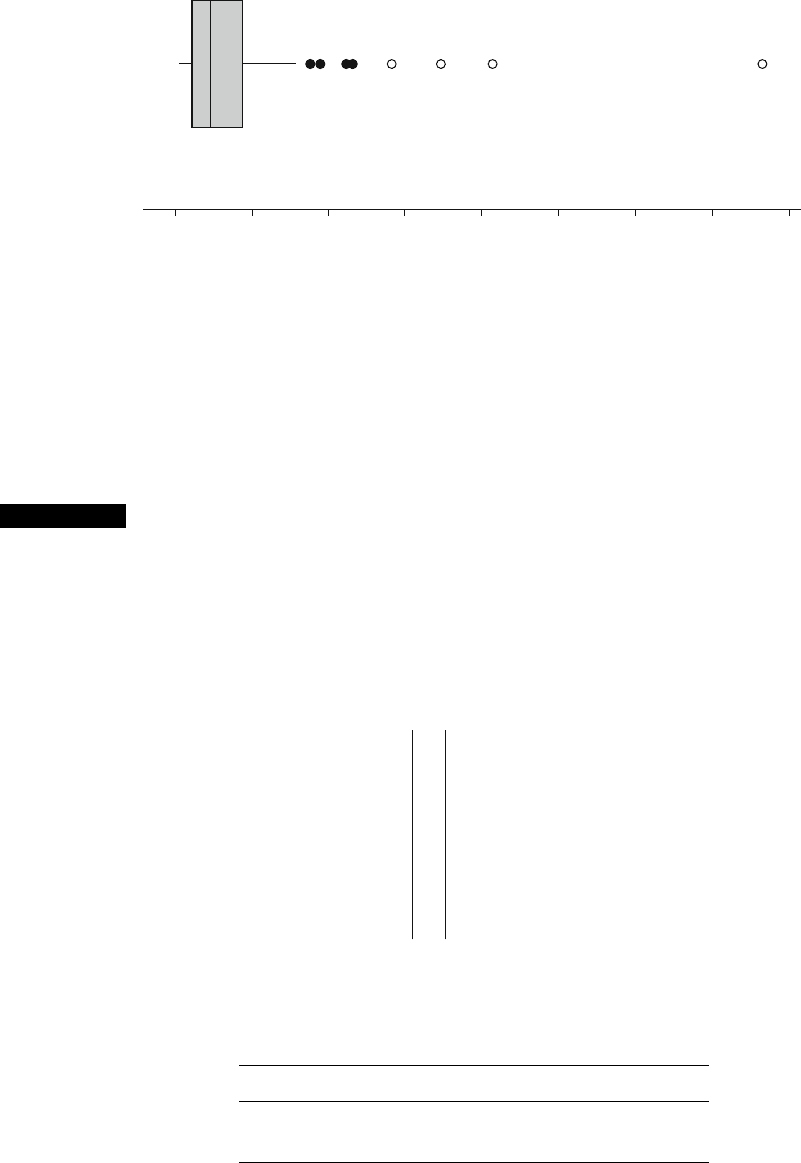
Thus the four largest observat ions — 563.92, 690.11, 826.54, and 1529.35 — are
extreme outliers, and 352.09, 371.47, 444.68, and 460.86 are mild outliers.
The whiskers in the boxplot in Figure 1.19 extend out to the smallest
observation 9.69 on the low end and 312.45, the largest observation that is not an
outlier, on the upper end. There is some positive skewness in the middle half of the
data (the median line is somewhat closer to the right edge of the box than to the left
edge) and a great deal of positive skewness overall.
1.4 Measures of Variability 39
Comparative Boxplots
A comparative or side-by-side boxplot is a very effective way of revealing simila-
rities and differences b etween two or more data sets consisting of observations on
the same variable.
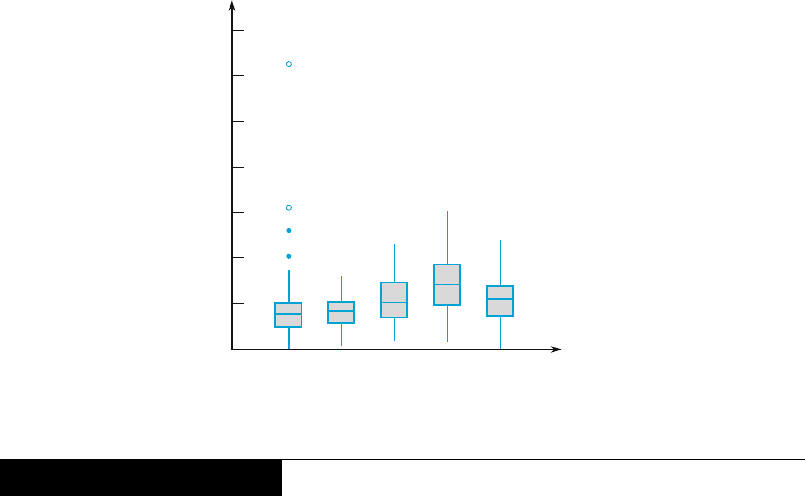
Example 1.18 In recent years, some evidence suggests that high indoor radon concentration may
be linked to the development of childhood cancers, but many health professionals
remain unconvinced. The article “Indoor Radon and Childhood Cancer” (Lancet,
1991: 1537–1538) presented the accompanying data on radon concentration (Bq/m
3
)
in two different samples of houses. The first sample consisted of houses in which a
child diagnosed with cancer had been residing. Houses in the second sample had no
recorded cases of childhood cancer. Figure 1.20 presents a stem-and-leaf display of
the data.
Numerical summary quantities are as follows:
x
~
xsf
s
Cancer 22.8 16.0 31.7 11.0
No cancer 19.2 12.0 17.0 18.0
0 200 400 600 800
1000 1200 1400 1600
Daily nitrogen load
Figure 1.19 A boxplot of the nitrogen load data showing mild and extreme outliers■
9987653 0
33566777889999
88876665553321111000 1 11111223477
73322110 2 11449999
9843 3 389
54
75
55
6
7
8
5
1. Cancer
2. No cancer
HI:210
Stem: Tens digit
Leaf: Ones digit
Figure 1.20 Stem-and-leaf display for Example 1.18
40
CHAPTER 1 Overview and Descriptive Statistics
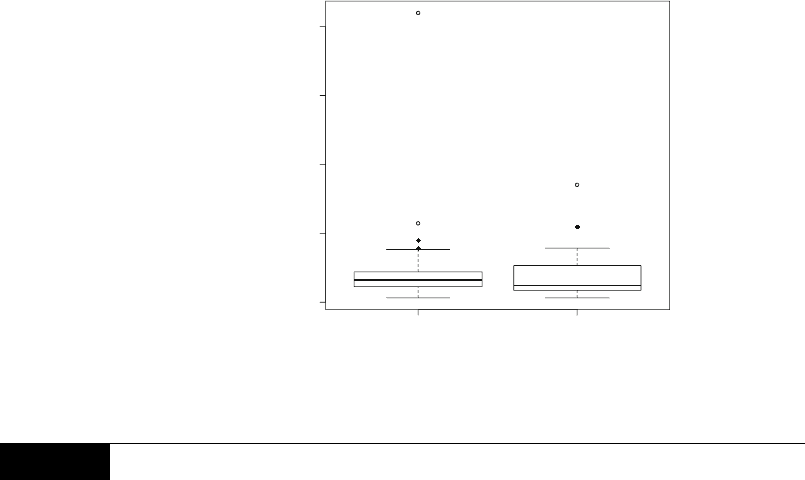
The values of both the mean and median suggest that the cancer sample is centered
somewhat to the right of the no-cancer sample on the measurement scale. The
values of s sugges t more variability in the cancer sample than in the no-cancer
sample, but this impression is contradicted by the fourth spreads. The o bservation
210, an extreme outlier, is the culprit. Figure 1.21 shows a comparative boxplot
from the R computer package. The no-cancer box is stretched out compared with
the cancer box ( f
s
¼ 18 vs. f
s
¼ 11), and the positions of the median lines in the
two boxes show much more skewness in the middle half of the no-cancer sample
than the cancer sample. Were the cancer victims exposed to more radon, as you
would expect if there is a relationship between cancer and radon? This is not
evident from the plot, where the cancer box fits well within the no-cancer box
and there is little difference in the highest and lowest values if you ignore outliers.
Because the R package boxplot does not normally distinguish between mild and
extreme outliers, a few commands were needed to get the hollow circles and filled
circles in Figure 1.21 (the commands are available on the web pages for this book).
Exercises Section 1.4 (41–59)
41. The article “Oxygen Consumption During Fire
Suppression: Error of Heart Rate Estimation”
(Ergonomics, 1991: 1469–1474) reported the fol-
lowing data on oxygen consumption (mL/kg/
min) for a sample of ten firefighters performing
a fire-suppression simulation:
29.5 49.3 30.6 28.2 28.0 26.3 33.9 29.4 23.5 31.6
Compute the following:
a. The sample range
b. The sample variance s
2
from the definition
(by first computing deviations, then squaring
them, etc.)
c. The sample standard deviation
d. s
2
using the shortcut method
42. The value of Young’s modulus (GPa) was deter-
mined for cast plates consisting of certain inter-
metallic substrates, resulting in the following
sample observations (“Strength and Modulus of
a Molybdenum-Coated Ti-25Al-10Nb-3U-1Mo
Intermetallic,” J. Mater. Engrg. Perform., 1997:
46–50):
116.4 115.9 114.6 115.2 115.8
a. Calculate
x and the deviations from the mean.
200
150
100
50
0
Radon concentration
Cancer No Cancer
Figure 1.21 A boxplot of the data in Example 1.18, from R ■
1.4 Measures of Variability 41
b. Use the deviations calculated in part (a) to
obtain the sample variance and the sample
standard deviation.
c. Calculate s
2
by using the computational for-
mula for the numerator S
xx
.
d. Subtract 100 from each observation to obtain a
sample of transformed values. Now calculate
the sample variance of these transformed
values, and compare it to s
2
for the original
data. State the general principle.
43. The accompanying observations on stabilized
viscosity (cP) for specimens of a certain grade
of asphalt with 18% rubber added are from the
article “Viscosity Characteristics of Rubber-
Modified Asphalts” (J. Mater. Civil Engrg.,
1996: 153–156):
2781 2900 3013 2856 2888
a. What are the values of the sample mean and
sample median?
b. Calculate the sample variance using the
computational formula. [Hint: First subtract
a convenient number from each observation.]
44. Calculate and interpret the values of the sample
median, sample mean, and sample standard devi-
ation for the following observations on fracture
strength (MPa, read from a graph in “Heat-Resis-
tant Active Brazing of Silicon Nitride: Mechani-
cal Evaluation of Braze Joints,” Welding J., Aug.
1997):
87 93 96 98 105 114 128 131 142 168
45. Exercise 33 in Section 1.3 presented a sample of
26 escape times for oil workers in a simulated
escape exercise. Calculate and interpret the sam-
ple standard deviation. [Hint:
P
x
i
¼ 9638 and
P
x
2
i
¼ 3; 587; 566].
46. A study of the relationship between age and
various visual functions (such as acuity and
depth perception) reported the following obser-
vations on area of scleral lamina (mm
2
) from
human optic nerve heads (“Morphometry of
Nerve Fiber Bundle Pores in the Optic Nerve
Head of the Human,” Exper. Eye Res., 1988:
559–568):
2.75 2.62 2.74 3.85 2.34 2.74 3.93 4.21 3.88
4.33 3.46 4.52 2.43 3.65 2.78 3.56 3.01
a. Calculate
P
x
i
and
P
x
2
i
.
b. Use the values calculated in part (a) to com-
pute the sample variance s
2
and then the sam-
ple standard deviation s.
47. In 1997 a woman sued a computer keyboard
manufacturer, charging that her repetitive s tress
injuries were cause d by the keyboard (Genessy
v. Digital Equipment Corp.). The jury awarded
about $3.5 million for pain and suffering, but
the court then set aside that award as being
unreasonable compensation. In making this
deter mination, the court identifi ed a “norma-
tive” group of 27 similar cases and specified a
reasonable award as one within two st andard
deviations of the mean of the a wards in the 27
cases. The 27 awards were (in $1000s) 37, 60,
75, 115, 135, 140, 149, 150, 238, 290, 340,
410, 600, 750, 750, 750, 1050, 1100, 1139,
1150, 1200, 1200, 1250, 1576, 1700, 1825, and
2000, from w hich
P
x
i
¼ 20;179,
P
x
2
i
¼
24;657;511. What is the maximum possible
amount that could be awarded under the two-
standard-deviation rule?
48. The article “A Thin-Film Oxygen Uptake Test
for the Evaluation of Automotive Crankcase
Lubricants” (Lubric. Engrg., 1984: 75–83)
reported the following data on oxidation-induc-
tion time (min) for various commercial oils:
87 103 130 160 180 195 132 145 211 105 145
153 152 138 87 99 93 119 129
a. Calculate the sample variance and standard
deviation.
b. If the observations were reexpressed in hours,
what would be the resulting values of the
sample variance and sample standard devia-
tion? Answer without actually performing the
reexpression.
49. The first four deviations from the mean in a
sample of n ¼ 5 reaction times were .3, .9, 1.0,
and 1.3. What is the fifth deviation from the
mean? Give a sample for which these are the
five deviations from the mean.
50. Reconsider the data on area of scleral lamina
given in Exercise 46.
a. Determine the lower and upper fourths.
b. Calculate the value of the fourth spread.
c. If the two largest sample values, 4.33 and 4.52,
had instead been 5.33 and 5.52, how would this
affect f
s
? Explain.
d. By how much could the observation 2.34 be
increased without affecting f
s
? Explain.
e. If an 18th observation, x
18
¼ 4.60, is added to
the sample, what is f
s
?
51. Reconsider these values of rushing yardage from
Exercise 31 of this chapter:
23 14165 962
132022411
a. What are the values of the fourths, and what is
the value of f
s
?
42
CHAPTER 1 Overview and Descriptive Statistics
b. Construct a boxplot based on the five-number
summary, and comment on its features.
c. How large or small does an observation have to
be to qualify as an outlier? As an extreme
outlier?
d. By how much could the largest observation be
decreased without affecting f
s
?
52. Here is a stem-and-leaf display of the escape time
data introduced in Exercise 33 of this chapter.
32 55
33 49
34
35 6699
36 34469
37 03345
38 9
39 2347
40 23
41
42 4
a. Determine the value of the fourth spread.
b. Are there any outliers in the sample? Any
extreme outliers?
c. Construct a boxplot and comment on its features.
d. By how much could the largest observation,
currently 424, be decreased without affecting
the value of the fourth spread?
53. Many people who believe they may be suffering
from the flu visit emergency rooms, where they are
subjected to long waits and may expose others or
themselves be exposed to various diseases. The
article “Drive-Through Medicine: A Novel Pro-
posal for the Rapid Evaluation of Patients During
an Influenza Pandemic” ( Ann. Emerg. Med., 2010:
268–273 described an experiment to see whether
patients could be evaluated while remaining in
their vehicles. The following total processing
times (min) for a sample of 38 individuals were
read from a graph that appeared in the cited article:
9 16161719202020
23 23 23 23 24 24 24 24
25 25 26 26 27 27 28 28
29 29 29 30 32 33 33 34
37 43 44 46 48 53
a. Calculate several different measures of center
and compare them.
b. Are there any outliers in this sample? Any
extreme outliers?
c. Construct a boxplot and comment on any inter-
esting features.
54. Here is summary information on the alcohol per-
centage for a sample of 25 beers:
lower fourth ¼4:35 median ¼5 upper fourth ¼5:95
The bottom three are 3.20 (Heineken Premium
Light), 3.50 (Amstel light), 4.03 (Shiner Light)
and the top three are 7.50 (Terrapin All-American
Imperial Pilsner), 9.10 (Great Divide Hercules
Double IPA), 11.60 (Rogue Imperial Stout).
a. Are there any outliers in the sample? Any
extreme outliers?
b. Construct a boxplot that shows outliers, and
comment on any interesting features.
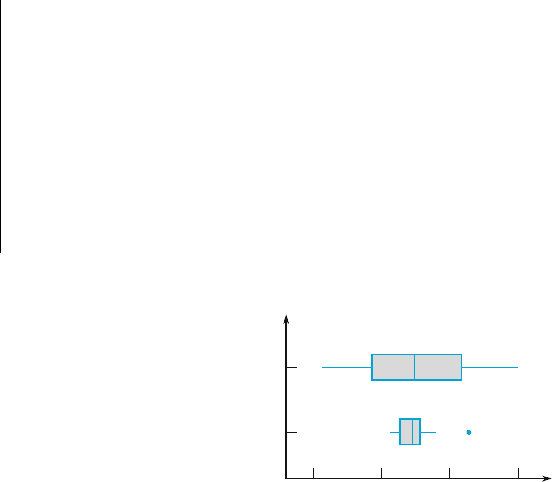
55. A company utilizes two different machines to
manufacture parts of a certain type. During a sin-
gle shift, a sample of n ¼ 20 parts produced by
each machine is obtained, and the value of a
particular critical dimension for each part is deter-
mined. The comparative boxplot below is con-
structed from the resulting data. Compare and
contrast the two samples.
85
1
2
95
105 115
Dimension
Machine
56. Blood cocaine concentration (mg/L) was deter-
mined both for a sample of individuals who had
died from cocaine-induced excited delirium
(ED) and for a sample of those who h ad died
from a cocaine overdose without excited delir-
ium; survival time for people in both groups was
at most 6 h. The accompanying data was read
from a comparative boxplot in the article “Fatal
Excited Delirium Following Cocaine Use” (J.
Forensic Sci., 1997: 25–31).
ED 0 0 00.1.1.1.1.2.2.3.3
.3 .4 .5 .7 .8 1.0 1.5 2.7 2.8 3.5 4.0 8.9
9.2 11.7 21.0
Non-ED 0 0 000.1.1.1 .1 .2 .2 .2
.3 .3 .3 .4 .5 .5 .6 .8 .9 1.0 1.2 1.4
1.5 1.7 2.0 3.2 3.5 4.1 4.3 4.8 5.0 5.6 5.9 6.0
6.4 7.9 8.3 8.7 9.1 9.6 9.9 11.0 11.5 12.2 12.7 14.0
16.6 17.8
a. Determine the medians, fourths, and fourth
spreads for the two samples.
1.4 Measures of Variability 43
b. Are there any outliers in either sample? Any
extreme outliers?
c. Construct a comparative boxplot, and use it as a
basis for comparing and contrasting the ED and
non-ED samples.
57. At the beginning of the 2007 baseball season each
American League team had nine starting position
players (this includes the designated hitter but not
the pitcher). Here are the salaries for the New
York Yankees and the Cleveland Indians in
thousands of dollars:
Yankees: 12000 600 491 22709 21600
13000 13000 15000 23429
Indians: 3200 3750 396 383 1000
3750 917 3000 4050
Construct a comparative boxplot and comment on
interesting features. Compare the salaries of the
two teams. The Indians won more games than
the Yankees in the regular season and defeated
the Yankees in the playoffs.
58. The comparative boxplot below of gasoline vapor
coefficients for vehicles in Detroit appeared in the
article “Receptor Modeling Approach to VOC Emis-
sion Inventor y Validation” (J. Environ. Engrg.,
1995: 483–490). Discuss any interesting features.
59. Let x
1
, ... , x
n
be a sample and let a and b be
constants. If y
i
¼ ax
i
+bfor i ¼ 1, 2, ..., n, how
does f
s
(the fourth spread) for the y
i
’s relate to f
s
for the x
i
’s? Substantiate your assertion.
Supplementary Exercises (60–80)
60. Consider the following information from a sample
of four Wolferman’s cranberry citrus English
muffins, which are said on the package label to
weigh 116 g:
x ¼ 104:4g;s ¼ 4.1497 g, smallest
weighs 98.7 g, largest weighs 108.0 g. Determine
the values of the two middle sample observations
(and don’t do it by successive guessing!).
61. Three different C
2
F
6
flow rates (SCCM) were
considered in an experiment to investigate the
effect of flow rate on the uniformity (%) of the
etch on a silicon wafer used in the manufacture
of integrated circuits, resulting in the following
data:
Flow rate
125 2.6 2.7 3.0 3.2 3.8 4.6
160 3.6 4.2 4.2 4.6 4.9 5.0
200 2.9 3.4 3.5 4.1 4.6 5.1
Compare and contrast the uniformity observa-
tions resulting from these three different flow
rates.
Comparative boxplot for Exercise 58
8 a.m. 2 p.m. 10 p.m.12 noon
10
0
20
30
40
50
60
70
Time
Gas vapor coefficient
6 a.m.
44 CHAPTER 1 Overview and Descriptive Statistics
62. The amount of radiation received at a greenhouse
plays an important role in determining the rate of
photosynthesis. The accompanying observations
on incoming solar radiation were read from a
graph in the article “Radiation Components
over Bare and Planted Soils in a Greenhouse”
(Solar Energy, 1990: 1011–1016).
6.3 6.4 7.7 8.4 8.5 8.8 8.9
9.0 9.1 10.0 10.1 10.2 10.6 10.6
10.7 10.7 10.8 10.9 11.1 11.2 11.2
11.4 11.9 11.9 12.2 13.1
Use some of the methods discussed in this chap-
ter to describe and summarize this data.
63. The following data on HC and CO emissions for
one particular vehicle was given in the chapter
introduction.
HC (g/mile) 13.8 18.3 32.2 32.5
CO (g/mile) 118 149 232 236
a. Compute the sample standard deviations for
the HC and CO observations. Does the wide-
spread belief appear to be justified?
b. The sample coefficient of variation s=
x (or
100 s=
x) assesses the extent of variability
relative to the mean. Values of this coefficient
for several different data sets can be compared
to determine which data sets exhibit more or
less variation. Carry out such a comparison for
the given data.
64. A sample of 77 individuals working at a particu-
lar office was selected and the noise level (dBA)
experienced by each one was determined, yield-
ing the following data (“Acceptable Noise
Levels for Construction Site Offices, Build.
Serv. Engr. Res. Technol., 2009: 87–94).
55.3 55.3 55.3 55.9 55.9 55.9 55.9 56.1 56.1
56.1 56.1 56.1 56.1 56.8 56.8 57.0 57.0 57.0
57.8 57.8 57.8 57.9 57.9 57.9 58.8 58.8 58.8
59.8 59.8 59.8 62.2 62.2 63.8 63.8 63.8 63.9
63.9 63.9 64.7 64.7 64.7 65.1 65.1 65.1 65.3
65.3 65.3 65.3 67.4 67.4 67.4 67.4 68.7 68.7
68.7 68.7 69.0 70.4 70.4 71.2 71.2 71.2 73.0
73.0 73.1 73.1 74.6 74.6 74.6 74.6 79.3 79.3
79.3 79.3 83.0 83.0 83.0
Use various techniques discussed in this chapter
to organize, summarize, and describe the data.
65. Fifteen air samples from a certain region were
obtained, and for each one the carbon monoxide
concentration was determined. The results (in
ppm) were
9.3 10.7 8.5 9.6 12.2 15.6 9.2 10.5
9.0 13.2 11.0 8.8 13.7 12.1 9.8
Using the interpolation method suggested in Sec-
tion 1.3, compute the 10% trimmed mean.
66.
a. For what value of c is the quantity
P
ðx
i
cÞ
2
minimized? [Hint: Take the
derivative with respect to c, set equal to 0,
and solve.]
b. Using the result of part (a), which of the two
quantities
P
ðx
i
xÞ
2
and
P
ðx
i
mÞ
2
will
be smaller than the other (assuming that
x 6¼ m)?
67.
a. Let a and b be constants and let y
i
¼ ax
i
+b
for i ¼ 1, 2,..., n. What are the relationships
between
x and
y and between s
2
x
and s
2
y
?
b. The Australian army studied the effect of
high temperatures and humidity on human
body temperature (Neural Network Training
on Human Body Core Temperature Data,
Technical Report DSTO TN-0241, Com-
batant Protection Nutrition Branch, Aeronau-
tical and Maritime Research Laboratory).
They found that, at 30
C and 60% relative
humidity, the sample average body tempera-
ture for nine soldiers was 38.21
C, with
standard deviation .318
C. What are the
sample average and the standard deviation
in
F?
68. Elevated energy consumption during exercise
continues after the workout ends. Because cal-
ories burned after exercise contribute to weight
loss and have other consequences, it is important
to understand this process. The paper “Effect of
Weight Training Exercise and Treadmill Exer-
cise on Post-Exercise Oxygen Consumption”
(Med. Sci. Sports Exercise, 1998: 518–522)
reported the accompanying data from a study in
which oxygen consumption (liters) was
measured continuously for 30 min for each of
15 subjects both after a weight training exercise
and after a treadmill exercise.
Subject 123456
Weight (x) 14.6 14.4 19.5 24.3 16.3 22.1
Treadmill (y) 11.3 5.3 9.1 15.2 10.1 19.6
Subject 789101112
Weight (x) 23.0 18.7 19.0 17.0 19.1 19.6
Treadmill (y) 20.8 10.3 10.3 2.6 16.6 22.4
Subject 13 14 15
Weight (x) 23.2 18.5 15.9
Treadmill (y) 23.6 12.6 4.4
a. Construct a comparative boxplot of the
weight and treadmill observations, and com-
ment on what you see.
Supplementary Exercises 45
b. Because the data is in the form of (x, y) pairs,
with x and y measurements on the same vari-
able under two different conditions, it is natu-
ral to focus on the differences within pairs:
d
1
¼ x
1
y
1
, ... , d
n
¼ x
n
y
n
. Construct a
boxplot of the sample differences. What does
it suggest?
69. Anxiety disorders and symptoms can often be
effectively treated with benzodiazepine medica-
tions. It is known that animals exposed to stress
exhibit a decrease in benzodiazepine receptor
binding in the frontal cortex. The paper
“Decreased Benzodiazepine Receptor Binding in
Prefrontal Cortex in Combat-Related Posttrau-
matic Stress Disorder” (Amer. J. Psychiatry,
2000: 1120–1126) described the first study of
benzodiazepine receptor binding in individuals
suffering from PTSD. The accompanying data on
a receptor binding measure (adjusted distribution
volume) was read from a graph in the paper.
PTSD: 10, 20, 25, 28, 31, 35, 37, 38, 38, 39, 39, 42,
46
Healthy: 23, 39, 40, 41, 43, 47, 51, 58, 63, 66, 67,
69, 72
Use various methods from this chapter to describe
and summarize the data.
70. The article “Can We Really Walk Straight?”
(Amer. J. Phys. Anthropol., 1992: 19–27) reported
on an experiment in which each of 20 healthy men
was asked to walk as straight as possible to a target
60 m away at normal speed. Consider the follow-
ing observations on cadence (number of strides
per second):
.95 .85 .92 .95 .93 .86 1.00 .92 .85 .81
.78 .93 .93 1.05 .93 1.06 1.06 .96 .81 .96
Use the methods developed in this chapter to
summarize the data; include an interpretation or
discussion wherever appropriate. [Note: The
author of the article used a rather sophisticated
statistical analysis to conclude that people cannot
walk in a straight line and suggested several expla-
nations for this.]
71. The mode of a numerical data set is the value that
occurs most frequently in the set.
a. Determine the mode for the cadence data given
in Exercise 70.
b. For a categorical sample, how would you
define the modal category?
72. Specimens of three different types of rope wire
were selected, and the fatigue limit (MPa) was
determined for each specimen, resulting in the
accompanying data.
Type 1 350 350 350 358 370 370 370 371
371 372 372 384 391 391 392
Type 2
350 354 359 363 365 368 369 371
373 374 376 380 383 388 392
Type 3
350 361 362 364 364 365 366 371
377 377 377 379 380 380 392
a. Construct a comparative boxplot, and comment
on similarities and differences.
b. Construct a comparative dotplot (a dotplot for
each sample with a common scale). Comment
on similarities and differences.
c. Does the comparative boxplot of part (a) give
an informative assessment of similarities and
differences? Explain your reasoning.
73. The three measures of center introduced in this
chapter are the mean, median, and trimmed mean.
Two additional measures of center that are occa-
sionally used are the midrange, which is the aver-
age of the smallest and largest observations, and
the midfourth, which is the average of the two
fourths. Which of these five measures of center
are resistant to the effects of outliers and which are
not? Explain your reasoning.
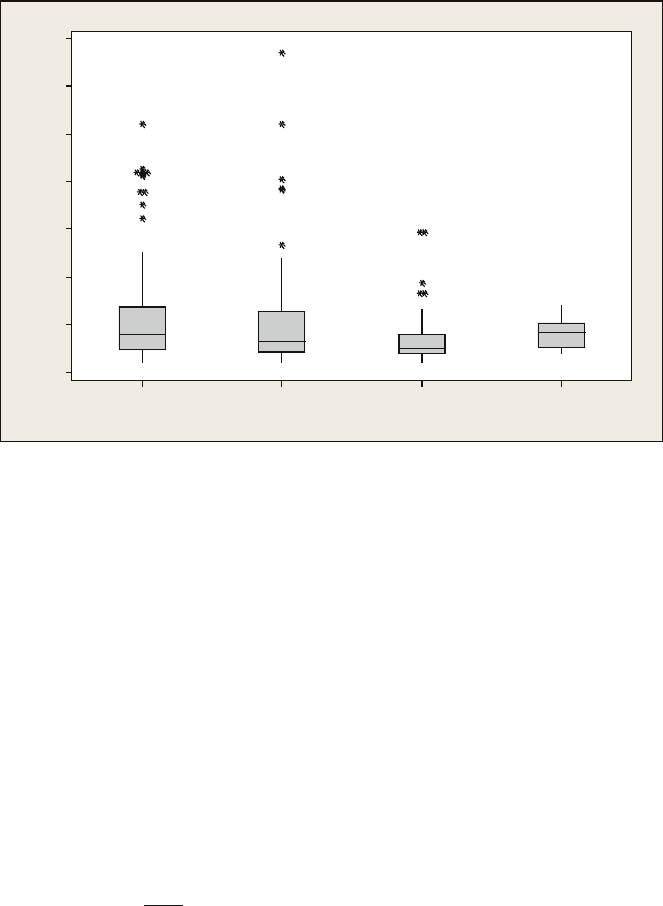
74. The authors of the article “Predictive Model for
Pitting Corrosion in Buried Oil and Gas Pipelines”
(Corrosion, 2009: 332–342) provided the data on
which their investigation was based.
a. Consider the following sample of 61 observa-
tions on maximum pitting depth (mm) of pipe-
line specimens buried in clay loam soil.
0.41 0.41 0.41 0.41 0.43 0.43 0.43 0.48 0.48
0.58 0.79 0.79 0.81 0.81 0.81 0.91 0.94 0.94
1.02 1.04 1.04 1.17 1.17 1.17 1.17 1.17 1.17
1.17 1.19 1.19 1.27 1.40 1.40 1.59 1.59 1.60
1.68 1.91 1.96 1.96 1.96 2.10 2.21 2.31 2.46
2.49 2.57 2.74 3.10 3.18 3.30 3.58 3.58 4.15
4.75 5.33 7.65 7.70 8.13 10.41 13.44
Construct a stem-and-leaf display in which the
two largest values are shown in a last row
labeled HI.
b. Refer back to (a), and create a histogram based
on eight classes with 0 as the lower limit of the
first class and class widths of .5, .5, .5, .5, 1, 2,
5, and 5, respectively.
c. The accompanying comparative boxplot from
MINITAB shows plots of pitting depth for four
different types of soils. Describe its important
features.
46
CHAPTER 1 Overview and Descriptive Statistics
75. Consider a sample x
1
, x
2
, ..., x
n
and suppose that
the values of
x, s
2
, and s have been calculated.
a. Let y
i
¼ x
i
x for i ¼ 1, ... , n. How do the
values of s
2
and s for the y
i
’s compare to the
corresponding values for the x
i
’s? Explain.
b. Let z
i
¼ðx
i
xÞ=s for i ¼ 1, ... , n. What are
the values of the sample variance and sample
standard deviation for the z
i
’s?
76. Let
x
n
and s
2
n
denote the sample mean and variance
for the sample x
1
, ... , x
n
and let
x
nþ1
and s
2
nþ1
denote these quantities when an additional obser-
vation x
n+1
is added to the sample.
a. Show how
x
nþ1
can be computed from
x
n
and
x
n+1
.
b. Show that
ns
2
nþ1
¼ðn 1Þs
2
n
þ
n
n þ 1
ðx
nþ1
x
n
Þ
2
so that s
2
nþ1
can be computed from x
n+1
,
x
n
,
and s
2
n
.
c. Suppose that a sample of 15 strands of drapery
yarn has resulted in a sample mean thread
elongation of 12.58 mm and a sample standard
deviation of .512 mm. A 16th strand results in
an elongation value of 11.8. What are the
values of the sample mean and sample standard
deviation for all 16 elongation observations?
77. Lengths of bus routes for any particular transit
system will typically vary from one route to
another. The article “Planning of City Bus
Routes” (J. Institut. Engrs. , 1995: 211–215)
gives the following information on lengths (km)
for one particular system:
Length 6–8 8–10 10–12 12–14 14–16
Freq. 623303532
Length 16–18 18–20 20–22 22–24 24–26
Freq. 48 42 40 28 27
Length 26–28 28–30 30–35 35–40 40–45
Freq. 26 14 27 11 2
a. Draw a histogram corresponding to these fre-
quencies.
b. What proportion of these route lengths are less
than 20? What proportion of these routes have
lengths of at least 30?
c. Roughly what is the value of the 90th percen-
tile of the route length distribution?
d. Roughly what is the median route length?
78. A study carried out to investigate the distribution of
total braking time (reaction time plus accelerator-
to-brake movement time, in msec) during real
driving conditions at 60 km/h gave the following
summary information on the distribution of times
(“A Field Study on Braking Responses during
Driving,” Ergonomics, 1995: 1903–1910):
C CL SCL SYCL
14
12
10
8
6
4
2
0
Maximum pit depth
Soil type
Supplementary Exercises 47