Devore J.L., Berk K.N. Modern Mathematical Statistics with Applications
Подождите немного. Документ загружается.

Note that if the largest observation 79.0 had not been included in the sample, the
resulting sample median for the n ¼ 11 remaining observations would have been
the single middle value 67.4 (the [n + 1]/2 ¼ 6th ordered value, i.e., the 6th value
in from either end of the ordered list). The sample mean is
x ¼
P
x
i
=n ¼ 816:1=12 ¼ 68:01, a bit more than a full minute larger than the
median. The mean is pulled out a bit relative to the median because the sample
“stretches out” somewhat more on the upper end than on the lower end.
■
The data in Example 1.12 illustrates an important property of
~
x in contrast to
x.
The sample median is very insensitive to a number of extremely small or extremely
large data values. If, for example, we increased the two largest x
i
’s from 75.7 and
79.0 to 95.7 and 99.0, respectively,
~
x would be unaffected. Thus, in the treatment of
outlying data values,
x and
~
x are at opposite ends of a spectrum:
x is sensitive to even
one such value, whereas
~
x is insensitive to a large number of outlying values.
Because the large values in the sample of Example 1.12 affect
x more than
~
x,
~
x <
x for that data. Although
x and
~
x both provide a measure for the center of a data
set, they will not in general be equal because they focus on different aspects of the
sample.
Analogous to
~
x as the middle value in the sample is a middle value in the
population, the population median, denoted by
~
m. As with
x and m, we can think of
using the sample median
~
x to make an inference about
~
m. In Example 1.12, we
might use
~
x ¼ 66:90 as an estimate of the median duration in the entire population
from which the sample was selected. A median is often used to describe income
or salary data (because it is not greatly influenced by a few large salaries). If the
median salary for a sample of statisticians were
~
x ¼ $66;416, we might use this as
a basis for concluding that the median salary for all statisticians exceeds $60,000.
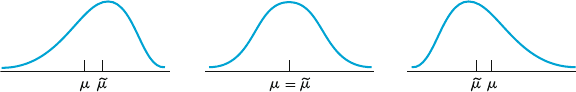
The population mean m and median
~
m will not generally be identical. If the
population distribution is positively or negatively skewed, as pictured in Figure 1.14,
then m 6¼
~
m. When this is the case, in making inferences we must first decide which of
the two population characteristics is of greater interest and then proceed accordingly.
Other Measures of Location: Quartiles,
Percentiles, and Trimmed Means
The median (population or sample) divides the data set into two parts of equal size.
To obtain finer measures of location, we could divide the data into more than two
such parts. Roughly speaking, quartiles divide the data set into four equal parts,
with the observations above the third quartile constituting the upper quarter of the
data set, the second quartile being identical to the median, and the first quartile
Negative skew Symmetric Positive skew
abc
Figure 1.14 Three different shapes for a population distribution
28
CHAPTER 1 Overview and Descriptive Statistics
separating the lower quarter from the upper three-quarters. Similarly, a data set
(sample or population) can be even more finely divided using percentiles; the 99th
percentile separates the highest 1% from the bottom 99%, and so on. Unless the
number of observations is a multiple of 100, care must be exercised in obtaining
percentiles. We will use percentiles in Chapter 4 in connection with certain models
for infinite populations and so postpone discussion until that point.
The sample mean and sample median are influenced by outlying values in a
very different manner—the mean greatly and the median not at all. Since extreme
behavior of either type might be undesirable, we briefly consider alternative
measures that are neither as sensitive as
x nor as insensitive as
~
x. To motivate
these alternatives, note that
x and
~
x are at opposite extremes of the same “family” of
measures. After the data set is ordered,
~
x is computed by throwing away as many
values on each end as one can wi thout eliminating everything (leaving just one or
two midd le values) and averaging what is left. On the other hand, to compute
x one
throws away nothing before averaging. To paraphrase, the mean involves trimming
0% from each end of the sample, whereas for the median the maximum possible
amount is trimmed from each end. A trimmed mean is a compromise between
x
and
~
x. A 10% trimmed mean, for example, would be computed by eliminating the
smallest 10% and the largest 10% of the sample and then averaging what remains.
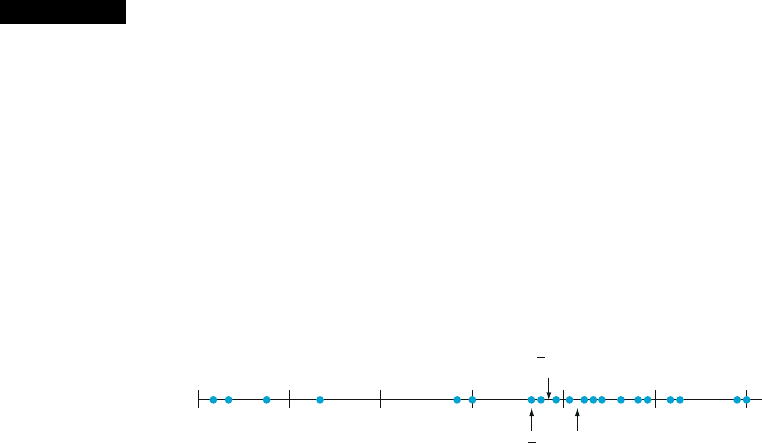
Example 1.13 Consider the following 20 observations, ordered from smallest to largest, each one
representing the lifetime (in hours) of a type of incandescent lamp:
612 623 666 744 883 898 964 970 983 1003
1016 1022 1029 1058 1085 1088 1122 1135 1197 1201
The average of all 20 observations is
x ¼ 965:0, and
~
x ¼ 1009:5. The 10% trimmed
mean is obtained by deleting the smallest two observations (612 and 623) and the
largest two (1197 and 1201) and then averaging the remaining 16 to obtain
x
trð10Þ
¼ 979:1. The effect of trimming here is to produce a “central value” that is
somewhat above the mean (
x is pulled down by a few small lifetimes) and yet
considerably below the median. Similarly, the 20% trimmed mean averages
the middle 12 values to obtain
x
trð20Þ
¼ 999:9, even closer to the median. (See
Figure 1.15.)
Generally speaking, using a trimmed mean with a moderate trimming
proportion (between 5% and 25%) will yield a measure that is neither as sensitive
to outliers as the mean nor as insensitive as the median. For this reason, trimmed
means have merited increasing attention from statisticians for both descriptive and
inferential purposes. More will be said about trimmed means when point estimation
is discussed in Chapter 7. As a final point, if the trimming proportion is denoted
by a and na is not an integer, then it is not obvious how the 100a% trimmed mean
600 800 1000 1200
x
x
x
tr(10)
~
Figure 1.15 Dotplot of lifetimes (in hours) of incandescent lamps ■
1.3 Measures of Location 29

should be computed. For example, if a ¼ .10 (10%) and n ¼ 22, then na ¼ (22)
(.10) ¼ 2.2, and we cannot trim 2.2 observations from each end of the ordered
sample. In this case, the 10% trimmed mean would be obtained by first trimming
two observations from each end and calculating
x
tr
, then trimming three and
calculating
x
tr
, and finally interpolating between the two values to obtain
x
trð10Þ
.
Categorical Data and Sample Proportions
When the data is categorical, a frequency distribution or relative fre quency distri-
bution provides an effective tabular summary of the data. The natural numerical
summary quantities in this situation are the individual frequencies and the relative
frequencies. For example, if a survey of individuals who own laptops is undertaken
to study brand preference, then each individual in the sample would identify the
brand of laptop that he or she owned, from which we could count the number
owning Sony, Macintosh, Hewlett-Packard, and so on. Consider sampling a dichot-
omous population—one that consists of only two categor ies (such as voted or
did not vote in the last election, does or does not own a laptop, etc.). If we let x
denote the number in the sample falling in category A, then the number in category
Bisn x. The relative frequency or sample proportion in category A is x/n and the
sample proportion in category B is 1 x/n. Let’s denote a response that falls in
category A by a 1 and a response that falls in category B by a 0. A sample size of
n ¼ 10 might then yield the responses 1, 1, 0, 1, 1, 1, 0, 0, 1, 1. The sample mean
for this numerical sample is (because the number of 1’s ¼ x ¼ 7).
x
1
þþx
n
n
¼
1 þ 1 þ 0 þþ1 þ 1
n
¼
7
10
¼
x
n
¼ sample proportion
This result can be generalized and summarized as follows: If in a categorical
data situation we focus attention on a particular category and code the sample
results so that a 1 is recorded for an individual in the category and a 0 for an
individual not in the category, then the sample proportion of individuals in the
category is the sample mean of the sequence of 1’sand0’s. Thus a sample mean can
be used to summarize the results of a categorical sample. These remarks also apply
to situations in which categories are defined by grouping values in a numerical
sample or population (e.g., we might be interested in knowing whether indivi duals
have owned their present automob ile for at least 5 years, rather than studying the
exact length of ownersh ip).
Analogous to the sample proportion x/n of individuals falling in a particular
category, let p represent the proportion of individuals in the entire population
falling in the category. As with x/n, p is a quantity between 0 and 1. While x/n is
a sample characteristic, p is a characteristic of the population. The relationship
between the two parallels the relationship between
~
x and
~
m and between
x and m.In
particular, we will subsequently use x/n to make inferences about p. If, for example,
a sample of 100 car owners reveals that 22 owned their cars at least 5 years, then we
might use 22/100 ¼ .22 as a point estimate of the proportion of all owners who
have owned their car at least 5 years. We will study the properties of x/n as an
estimator of p and see how x/n can be used to answer other inferential questions.
With k categories (k > 2), we can use the k sample proportions to answer questions
about the population propor tions p
1
, ... , p
k
.
30 CHAPTER 1 Overview and Descriptive Statistics

Exercises Section 1.3 (30–40)
30. The May 1, 2009 issue of The Montclarion
reported the following home sale amounts for a
sample of homes in Alameda, CA that were sold
the previous month (1000s of $):
590 815 575 608 350 1285 408 540 555 679
a. Calculate and interpret the sample mean and
median.
b. Suppose the 6th observation had been 985
rather than 1285. How would the mean and
median change?
c. Calculate a 20% trimmed mean by first
trimming the two smallest and two largest
observations.
d. Calculate a 15% trimmed mean.
31. In Superbowl XXXVII, Michael Pittman of
Tampa Bay rushed (ran with the football) 17
times on first down, and the results were the
following gains in yards:
23 14165 962
132022411
a. Determine the value of the sample mean.
b. Determine the value of the sample median.
Why is it so different from the mean?
c. Calculate a trimmed mean by deleting the
smallest and largest observations. What is
the corresponding trimming percentage?
How does the value of this
x
tr
compare to
the mean and median?
32. The minimum injection pressure (psi) for injec-
tion molding specimens of high amylose corn
was determined for eight different specimens
(higher pressure corresponds to greater proces-
sing difficulty), resulting in the following obser-
vations (from “Thermoplastic Starch Blends with
a Polyethylene-Co-Vinyl Alcohol: Processability
and Physical Properties,” Polymer Engrg. & Sci.,
1994: 17–23):
15.0 13.0 18.0 14.5 12.0 11.0 8.9 8.0
a. Determine the values of the sample mean,
sample median, and 12.5% trimmed mean,
and compare these values.
b. By how much could the smallest sample
observation, currently 8.0, be increased with-
out affecting the value of the sample median?
c. Suppose we want the values of the sample
mean and median when the observations are
expressed in kilograms per square inch (ksi)
rather than psi. Is it necessary to reexpress
each observation in ksi, or can the values
calculated in part (a) be used directly? [Hint:
1kg¼ 2.2 lb.]
33. A sample of 26 offshore oil workers took part in
a simulated escape exercise, resulting in the
accompanying data on time (sec) to complete
the escape (“Oxygen Consumption and Ventila-
tion During Escape from an Offshore Platform,”
Ergonomics, 1997: 281–292):
389 356 359 363 375 424 325 394 402
373 373 370 364 366 364 325 339 393
392 369 374 359 356 403 334 397
a. Construct a stem-and-leaf display of the data.
How does it suggest that the sample mean and
median will compare?
b. Calculate the values of the sample mean and
median. [Hint:
P
x
i
¼ 9638.]
c. By how much could the largest time, currently
424, be increased without affecting the value
of the sample median? By how much could
this value be decreased without affecting the
value of the sample median?
d. What are the values of
x and
~
x when the
observations are reexpressed in minutes?
34. The article “Snow Cover and Temperature Rela-
tionships in North America and Eurasia” (J. Cli-
mate Appl. Meteorol., 1983: 460–469) used
statistical techniques to relate the amount of
snow cover on each continent to average conti-
nental temperature. Data presented there
included the following ten observations on Octo-
ber snow cover for Eurasia during the years
1970–1979 (in million km
2
):
6.5 12.0 14.9 10.0 10.7 7.9 21.9 12.5 14.5 9.2
What would you report as a representative, or
typical, value of October snow cover for this
period, and what prompted your choice?
35. Blood pressure values are often reported to the
nearest 5 mmHg (100, 105, 110, etc.). Suppose
the actual blood pressure values for nine ran-
domly selected individuals are
118.6 127.4 138.4 130.0 113.7 122.0 108.3 131.5 133.2
a. What is the median of the reported blood
pressure values?
b. Suppose the blood pressure of the second
individual is 127.6 rather than 127.4 (a small
change in a single value). How does this
1.3 Measures of Location 31
affect the median of the reported values?
What does this say about the sensitivity of
the median to rounding or grouping in the
data?
36. The propagation of fatigue cracks in various
aircraft parts has been the subject of extensive
study in recent years. The accompanying data
consists of propagation lives (flight hours/10
4
)
to reach a given crack size in fastener holes
intended for use in military aircraft (“Statistical
Crack Propagation in Fastener Holes under Spec-
trum Loading,” J. Aircraft, 1983: 1028–1032):
.736 .863 .865 .913 .915 .937 .983 1.007
1.011 1.064 1.109 1.132 1.140 1.153 1.253 1.394
a. Compute and compare the values of the sam-
ple mean and median.
b. By how much could the largest sample obser-
vation be decreased without affecting the
value of the median?
37. Compute the sample median, 25% trimmed
mean, 10% trimmed mean, and sample mean
for the microdrill data given in Exercise 25, and
compare these measures.
38. A sample of n ¼ 10 automobiles was selected,
and each was subjected to a 5-mph crash test.
Denoting a car with no visible damage by S (for
success) and a car with such damage by F, results
were as follows:
SSFSSSFFSS
a. What is the value of the sample proportion of
successes x/n?
b. Replace each S with a 1 and each F with a 0.
Then calculate
x for this numerically coded
sample. How does
x compare to x/n?
c. Suppose it is decided to include 15 more cars
in the experiment. How many of these would
have to be S’s to give x/n ¼ .80 for the entire
sample of 25 cars?
39. a. If a constant c is added to each x
i
in a sample,
yielding y
i
¼ x
i
+c, how do the sample mean
and median of the y
i
’s relate to the mean and
median of the x
i
’s? Verify your conjectures.
b. If each x
i
is multiplied by a constant c, yielding
y
i
¼ cx
i
, answer the question of part (a).
Again, verify your conjectures.
40. An experiment to study the lifetime (in hours) for
a certain type of component involved putting ten
components into operation and observing them for
100 hours. Eight of the components failed during
that period, and those lifetimes were recorded.
Denote the lifetimes of the two components still
functioning after 100 hours by 100+. The resulting
sample observations were
48 79 100+ 35 92 86 57 100+ 17 29
Which of the measures of center discussed in this
section can be calculated, and what are the values
of those measures? [Note: The data from this
experiment is said to be “censored on the right.”]
1.4
Measures of Variability
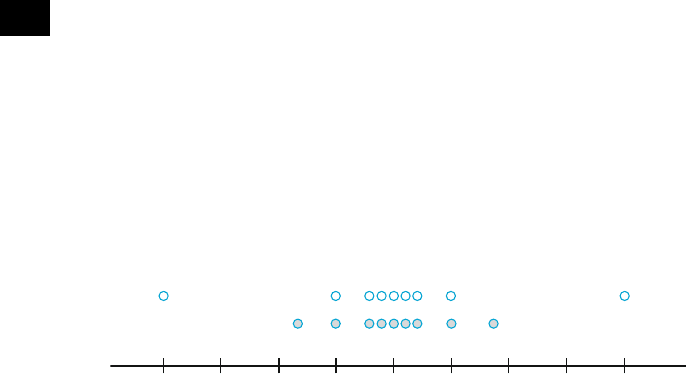
Reporting a measure of center gives only partial information about a data set or
distribution. Different samples or populations may have identical measures of
center yet differ from one another in other important ways. Figure 1.16 shows
dotplots of three samples with the same mean and median, yet the extent of spread
about the center is different for all three samples. The first sample has the largest
amount of variability, the third has the smallest amount, and the second is interme-
diate to the other two in this respect.
30 40 50
*********
60 70
1:
2:
3:
Figure 1.16 Samples with identical measures of center but different amounts of
variability
32
CHAPTER 1 Overview and Descriptive Statistics

Measures of Variability for Sample Data
The simplest measure of variability in a sample is the range, which is the difference
between the largest and smallest sample values. Notice that the value of the range
for sample 1 in Figure 1.16 is much larger than it is for sample 3, reflecting more
variability in the first sample than in the third. A defect of the range, though, is that
it depends on only the two most extreme observations and disregards the positions
of the remaining n 2 values. Samples 1 and 2 in Figure 1.16 have identical ranges,
yet when we take into account the observations between the two extremes, there is
much less variability or dispersion in the second sample than in the first.
Our primary measures of variability involve the deviations from the mean,
x
1
x; x
2
x; ...; x
n
x. That is, the deviations from the mean are obtained by
subtracting
x from each of the n sample observations. A deviation will be positive if
the obser vation is larger than the mean (to the right of the mean on the measurement
axis) and negative if the observation is smaller than the mean. If all the deviations
are small in magnitude, then all x
i
’s are close to the mean and there is little
variability. On the other hand, if some of the deviations are large in magnitude,
then some x
i
’s lie far from
x, suggesting a greater amount of variability. A simple
way to combine the deviations into a single quantity is to average them (sum them
and divide by n). Unfortunately, there is a major problem with this suggestion:
sum of deviations ¼
X
n
i¼1
ðx
i
xÞ¼0
so that the average deviation is always zero. The verification uses several standar d
rules of summation and the fact that
P
x ¼
x þ
x þþ
x ¼ n
x:
X
ðx
i
xÞ¼
X
x
i
X
x ¼
X
x
i
n
x ¼
X
x
i
n
1
n
X
x
i
¼ 0
How can we change the deviations to nonnegative quantities so the positive
and negative deviations do not counteract each other when they are combined? One
possibility is to work with the absolute values of the deviations and calculate the
average absolute deviation
P
x
i
x
jj
=n. Because the absolute value operation
leads to a number of theoretical difficulties, consider instead the squared deviations
ðx
1
xÞ
2
; ðx
2
xÞ
2
; ...; ðx
n
xÞ
2
. Rather than use the average squared deviation
P
x
i
xðÞ
2
=n, for several reasons we will divide the sum of squared deviations by
n 1 rather than n.
DEFINITION
The sample variance, denoted by s
2
, is given by
s
2
¼
P
x
i
xðÞ
2
n 1
¼
S
xx
n 1
The sample standard deviation, denoted by s, is the (positive) square
root of the variance:
s ¼
ffiffiffiffi
s
2
p
1.4 Measures of Variability 33

The unit for s is the same as the unit for each of the x
i
’s. If, for example, the
observations are fuel efficiencies in miles per gallon, then we might have s ¼ 2.0
mpg. A rough interpretation of the sample standard deviation is that it is the size of a
typical or representative deviation from the sample mean within the given sample.
Thus if s ¼ 2.0 mpg, then some x
i
’s in the sample are closer than 2.0 to
x, whereas
others are farther away; 2.0 is a representative (or “standard”) deviation from the
mean fuel efficiency. If s ¼ 3.0 for a second sample of cars of another type, a typical
deviation in this sample is roughly 1.5 times what it is in the first sample, an
indication of more variability in the second sample.
Example 1.14 The website www.fueleconomy.gov contains a wealth of information about fuel
characteristics of various vehicles. In addition to EPA mileage ratings, there are
many vehicles for which users have reported their own values of fuel efficiency
(mpg). Consider Table 1.3 with n ¼ 11 efficiencies for the 2009 Ford Focus
equipped with an automatic transmission (for this model, the EPA reports an
overall rating of 27–24 mpg in city driving and 33 mpg in highway driving).
Effects of rounding account for the sum of deviations not being exactly zero.
The numerator of s
2
is S
xx
¼ 314.110, from which
s
2
¼
S
xx
n 1
¼
314:110
11 1
¼ 31:41 s ¼ 5:60
The size of a representative deviation from the sample mean 33.26 is roughly
5.6 mpg.
[Note: Of the nine people who also reported driving behavior, only three did
more than 80% of their driving in highway mode; we bet you can guess which cars
they drove. We haven’t a clue why all 11 reported values exceed the EPA figure –
maybe only drivers with really good fuel efficiencies communicate their results.]
Motivation for s
2
To explain why s
2
rather than the average squared deviation is used to measure
variability, note first that whereas s
2
measures sample variability, there is a measure
of variability in the population called the population variance. We will use s
2
(the
Table 1.3 Dat a for Example 1.14
x
i
x
i
x ðx
i
xÞ
2
1 27.3 5.96 35.522
2 27.9 5.36 28.730
3 32.9 0.36 0.130
4 35.2 1.94 3.764
5 44.9 11.64 135.490
6 39.9 6.64 44.090
7 30.0 3.26 10.628
8 29.7 3.56 12.674
9 28.5 4.76 22.658
10 32.0 1.26 1.588
11
37.6 4.34 18.836
P
x
i
¼ 365:9
P
ðx
i
xÞ¼:04
P
ðx
i
xÞ
2
¼ 314:110
x ¼ 33:26
■
34 CHAPTER 1 Overview and Descriptive Statistics

square of the lower case Greek letter sigma) to denote the population variance and
s to denote the population standard deviation (the square root of s
2
). When the
population is finite and consists of N values,
s
2
¼
X
N
i¼1
ðx
i
mÞ
2
N
=
which is the average of all squared deviations from the population mean (for the
population, the divisor is N and not N 1). More general definitions of s
2
appear in
Chapters 3 and 4.
Just as
x will be used to make inferences about the population mean m,we
should define the sample variance so that it can be used to make inferences about
s
2
. Now note that s
2
involves squared deviations about the population mean m.
If we actually knew the value of m, then we could define the sample variance as the
average squared deviation of the sample x
i
’s about m. However, the value of m is
almost never known, so the sum of squared deviations about
x must be used. But the
x
i
’s tend to be closer to their average
x than to the population average m,soto
compensate for this the divisor n 1 is used rather than n. In other words, if we
used a divisor n in the sample variance, then the resulting quantity would tend to
underestimate s
2
(produce estimated values that are too small on the average),
whereas dividing by the slightly smaller n 1 corrects this underestimation.
It is custom ary to refer to s
2
as being based on n 1 degrees of freedom (df).
This terminology results from the fact that although s
2
is based on the n quantities
x
1
x; x
2
x; ...; x
n
x, these sum to 0, so specifying the values of any n 1of
the quantities determines the remaining value. For example, if n ¼ 4 and
x
1
x ¼ 8; x
2
x ¼6; and x
4
x ¼4, then automatically x
3
x ¼ 2, so
only three of the four values of x
i
x are freely determined (3 df).
A Computing Formula for s
2
Computing and squaring the deviations can be tedious, especially if enough
decimal accuracy is being used in
x to guard against the effects of rounding. An
alternative formula for the numerator of s
2
circumvents the need for all the
subtraction necessary to obtain the deviations. The formula involves both
P
x
i
ðÞ
2
, summing and then squaring, and
P
x
2
i
, squaring and then summing.
An alternative expression for the numerator of s
2
is
S
xx
¼
X
ðx
i
xÞ
2
¼
X
x
2
i
P
x
i
ðÞ
2
n
Proof Because
x ¼
P
x
i
=n; n
x
2
¼ n
P
x
i
ðÞ
2
n
2
¼
P
x
i
ðÞ
2
n
=
. Then,
X
ðx
i
xÞ
2
¼
X
ðx
2
i
2
x x
i
þ
x
2
Þ¼
X
x
2
i
2
x
X
x
i
þ
X
ð
x
2
Þ
¼
X
x
2
i
2
x n
x þnð
xÞ
2
¼
X
x
2
i
nð
xÞ
2
¼
X
x
2
i
P
x
i
ðÞ
2
n
■
1.4 Measures of Variability 35

Example 1.15 Traumatic knee dislocation often requires surgery to repair ruptured ligam ents. One
measure of recovery is range of motion (measured as the angle formed when,
starting with the leg straight, the knee is bent as far as possible). The given data on
postsurgical range of motion appeared in the article “Reconstruction of the Anterior
and Posterior Cruciate Ligaments After Knee Dislocation” (Amer. J. Sports Med.,
1999: 189–197):
154 142 137 133 122 126 135 135 108 120 127 134 122
The sum of these 13 sample observations is
P
x
i
¼ 1695, and the sum of their
squares is
X
x
2
i
¼ 154
2
þ 142
2
þþ122
2
¼ 222; 581
Thus the numerator of the sample variance is
S
xx
¼
X
x
2
i
½ð
X
x
i
Þ
2
=n ¼ 222 ; 581 ð1695Þ
2
=13 ¼ 1579:0769
from which s
2
¼ 1579.0769/12 ¼ 131.59 and s ¼ 11.47. ■
The shortcut method can yield values of s
2
and s that differ from the values
computed usin g the definitions. These differences are due to effects of rounding
and will not be important in most samples. To minimize the effects of rounding
when using the shortcut formula, intermediate calculations should be done using
several more sign ificant digits than are to be retained in the final answer. Because
the numerator of s
2
is the sum of nonnegative quantities (squared deviations), s
2
is
guaranteed to be nonnega tive. Yet if the shortcut method is used, particularly with
data having little variability, a slight numerical error can result in the numerator
being zero or negative [
P
x
2
i
less than or equal to
P
x
i
ðÞ
2
=n]. Of course, a negative
s
2
is wrong, and a zero s
2
should occur only if all data values are the same.
As an example of the potential difficulties with the formula, consider the data
1001, 1002, 1003. The formula gives S
xx
¼1001
2
+ 1002
2
+ 1003
2
(1001 +
1002 + 1003)
2
/3 ¼ 3,012,014 3,012,012 ¼ 2. Thus, we could carry six decimal
digits and still get the wrong answer of 3,012,010 3,012,010 ¼ 0. All seven
digits must be carried to get the right answer. The problem occurs because we are
subtracting two numbers of nearly equal size, so the number of accurate digits in the
answer is many fewer than in the numbers being subtracted.
Several other properties of s
2
can facilitate its computation.
PROPOSITION
Let x
1
, x
2
,..., x
n
be a sample and c be a constant.
1. If y
1
¼ x
1
+c, y
2
¼ x
2
+c,... , y
n
¼ x
n
+c, then s
2
y
¼ s
2
x
, and
2. If y
1
¼ cx
1
,..., y
n
¼ cx
n
, then s
2
y
¼ c
2
s
2
x
, s
y
¼jcjs
x
,
where s
x
2
is the sample variance of the x’s and s
y
2
is the sample variance of
the y’s.
36 CHAPTER 1 Overview and Descriptive Statistics

In words, Result 1 says that if a constant c is added to (or subtracted from) each data
value, the variance is unchanged. This is intuitive, because adding or subtracting c
shifts the location of the data set but leaves distances between data values
unchanged. According to Result 2, multiplication of each x
i
by c results in s
2
being multiplied by a factor of c
2
. These properties can be proved by noting in
Result 1 that
y ¼
x þ c and in Result 2 that
y ¼ c
x (see Exercise 59).
Boxplots
Stem-and-leaf display s and histograms convey rather general impressions about a
data set, whereas a single summary such as the mean or standard deviation focuses
on just one aspect of the data. In recent years, a pictorial summary called a boxplot
has been used successfully to describe several of a data set’s most prominent
features. These features include (1) center, (2) spread, (3) the extent and nature
of any departure from symmetry, and (4) identification of “outliers,” observations
that lie unusually far from the main body of the data. Because even a single outlier
can drastically affect the values of
x and s, a boxplot is based on measures that are
“resistant” to the presence of a few outliers—the median and a measure of spread
called the fourth sprea d .
DEFINITION
Order the n observations from smallest to largest and separate the smallest
half from the largest half; the median
~
x is included in both halves if n is odd.
Then the lower fourth is the median of the smallest half and the upper
fourth is the median of the largest half. A measure of spread that is resistant
to outliers is the fourth spread f
s
, given by
f
s
¼ upper fourth lower fourth
Roughly speaking, the fourth spread is unaffected by the positions of those
observations in the smallest 25% or the largest 25% of the data.
The simplest boxplot is based on the following five-number summary:
smallest x
i
lower fourth median upper fourth largest x
i
First, draw a horizontal measurement scale. Then place a rectangle above this axis;
the left edge of the rectangle is at the lower fourth, and the right edge is at the upper
fourth (so box width ¼ f
s
). Place a vertical line segment or some other symbol inside
the rectangle at the location of the median; the position of the median symbol
relative to the two edges conveys information about skewness in the middle 50%
of the data. Finally, draw “whiskers” out from either end of the rectangle to the
smallest and largest observations. A boxplot with a vertical orientation can also be
drawn by making obvious modifications in the construction process.
Example 1.16 Ultrasound was used to gather the accompanying corrosion data on the thickness of
the floor plate of an aboveground tank used to store crude oil (“Statistical Analysis
of UT Corrosion Data from Floor Plates of a Crude Oil Aboveground Storage
Tank,” Mater. Eval., 1994: 846–849); each observation is the largest pit depth in
the plate, expressed in milli-in.
1.4 Measures of Variability 37