Devore J.L., Berk K.N. Modern Mathematical Statistics with Applications
Подождите немного. Документ загружается.


Thus a sample size of 381 should be used. The expression for n based on the
traditional CI gives a slightly larger value of 385.
■
One-Sided Confidence Intervals (Confidence Bounds)
The confidence intervals discussed thus far give both a lower confidence bound and
an upper confidence bound for the parameter being estimated. In some circum-
stances, an investigator will want only one of these two types of bounds. For
example, a psychologist may wish to calculate a 95% upper confidence bound for
true average reaction time to a particular stimulus, or a surgeon may want only a
lower confidence bound for true average remission time after colon cancer
surgery. Because the cumulative area under the standard normal curve to the left
of 1.645 is .95,
P
X m
S=
ffiffiffi
n
p
< 1:645
:95
Manipulating the inequality inside the parentheses to isolate m on one side and
replacing rv’s by calculated values gives the inequality m >
x 1:645s=
ffiffiffi
n
p
; the
expression on the right is the desired lower confidence bound. Starting with
P(1.645 < Z) .95 and manipulating the inequality results in the upper confi-
dence bound. A similar argument gives a one-sided bound associated with any
other confidence level.
PROPOSITION
A large-sample upper confidence bound for m is
m <
x þ z
a
s
ffiffiffi
n
p
and a large-sample lower confidence bound for m is
m >
x z
a
s
ffiffiffi
n
p
A one-sided confidence bound for p results from replacing z
a/2
by z
a
and
by either + or – in the CI formula (8.10) for p. In all cases the confidence
level is approximately 100(1 a)%.
Example 8.10 A random sample of 50 patients who had been seen at an outpatient clinic was
selected, and the waiting time to see a physician was determined for each one,
resulting in a sample mean time of 40.3 min and a sample standard deviation of
28.0 min (suggested by the article “An Example of Good but Partially Successful
OR Engagement: Improving Outpatient Clinic Operations”, Interfaces 28, #5).
An upper confidence bound for tru e average waiting time with a confidence level
of roughly 95% is
398 CHAPTER 8 Statistical Intervals Based on a Single Sample

40:3 þð1: 645Þð28:0Þ=
ffiffiffiffiffi
50
p
¼ 40:3 þ 6:5 ¼ 46:8
That is, with a confidence level of about 95%, m < 46.8. Note that the sample
standard deviation is quite large relative to the sample mean. If these were the
values of s and m, respectively, then population normality would not be sensible
because there would then be quite a large probability of obtaining a negative
waiting time. But because n is large here, our confiden ce b ound is valid even
though the population distribution is probably positively skewed.
■
Exercises Section 8.2 (12–28)
12. A random sample of 110 lightning flashes in a
region resulted in a sample average radar echo
duration of .81 s and a sample standard deviation
of .34 s (“Lightning Strikes to an Airplane in a
Thunderstorm,” J. Aircraft, 1984: 607–611).
Calculate a 99% (two-sided) confidence interval
for the true average echo duration m, and inter-
pret the resulting interval.
13. The article “Extravisual Damage Detection?
Defining the Standard Normal Tree” (Photogram-
metric Engrg. Remote Sensing, 1981: 515–522)
discusses the use of color infrared photography in
identification of normal trees in Douglas fir
stands. Among data reported were summary sta-
tistics for green-filter analytic optical densitomet-
ric measurements on samples of both healthy and
diseased trees. For a sample of 69 healthy trees,
the sample mean dye-layer density was 1.028, and
the sample standard deviation was .163.
a. Calculate a 95% (two-sided) CI for the true
average dye-layer density for all such trees.
b. Suppose the investigators had made a rough
guess of .16 for the value of s before collect-
ing data. What sample size would be neces-
sary to obtain an interval width of .05 for a
confidence level of 95%?
14. The article “Evaluating Tunnel Kiln Perfor-
mance” (Amer. Ceramic Soc. Bull., Aug. 1997:
59–63) gave the following summary information
for fracture strengths (MPa) of n ¼ 169 ceramic
bars fired in a particular kiln:
x ¼ 89:10;
s ¼ 3:73.
a. Calculate a (two-sided) confidence interval
for true average fracture strength using a con-
fidence level of 95%. Does it appear that true
average fracture strength has been precisely
estimated?
b. Suppose the investigators had believed a
priori that the population standard deviation
was about 4 MPa. Based on this supposition,
how large a sample would have been required
to estimate m to within .5 MPa with 95%
confidence?
15. Determine the confidence level for each of the
following large-sample one-sided confidence
bounds:
a. Upper bound:
x þ :84s=
ffiffiffi
n
p
b. Lower bound:
x 2:05s=
ffiffiffi
n
p
c. Upper bound:
x þ :67s=
ffiffiffi
n
p
16. A sample of 66 obese adults was put on a low-
carbohydrate diet for a year. The average weight
loss was 11 lb and the standard deviation was
19 lb. Calculate a 99% lower confidence bound
for the true average weight loss. What does the
bound say about confidence that the mean weight
loss is positive?
17. A study was done on 41 first-year medical stu-
dents to see if their anxiety levels changed during
the first semester. One measure used was the
level of serum cortisol, which is associated with
stress. For each of the 41 students the level was
compared during finals at the end of the semester
against the level in the first week of classes. The
average difference was 2.08 with a standard
deviation of 7.88. Find a 95% lower confidence
bound for the population mean difference m.
Does the bound suggest that the mean population
stress change is necessarily positive?
18. The article “Ultimate Load Capacities of Expan-
sion Anchor Bolts” (J. Energy Engrg., 1993:
139–158) gave the following summary data on
shear strength (kip) for a sample of 3/8-in. anchor
bolts: n ¼ 78;
x ¼ 4:25; s ¼ 1:30. Calculate a
lower confidence bound using a confidence
level of 90% for true average shear strength.
19. The article “Limited Yield Estimation for Visual
Defect Sources” (IEEE Trans. Semicon. Manuf.,
1997: 17–23) reported that, in a study of a
8.2 Large-Sample Confidence Intervals for a Population Mean and Proportion 399
particular wafer inspection process, 356 dies
were examined by an inspection probe and 201
of these passed the probe. Assuming a stable
process, calculate a 95% (two-sided) confidence
interval for the proportion of all dies that pass the
probe.
20. The Associated Press (October 9, 2002) reported
that in a survey of 4722 American youngsters aged
6–19, 15% were seriously overweight (a body
mass index of at least 30; this index is a measure
of weight relative to height). Calculate and inter-
pret a confidence interval using a 99% confidence
level for the proportion of all American youngsters
who are seriously overweight.
21. A random sample of 539 households from a mid-
western city was selected, and it was determined
that 133 of these households owned at least one
firearm (“The Social Determinants of Gun Own-
ership: Self-Protection in an Urban Environment,”
Criminology, 1997: 629–640). Using a 95% con-
fidence level, calculate a lower confidence bound
for the proportion of all households in this city that
own at least one firearm.
22. In a sample of 1000 randomly selected consumers
who had opportunities to send in a rebate claim
form after purchasing a product, 250 of these
people said they never did so (“Rebates: Get
What You Deserve”, Consumer Reports, May
2009: 7). Reasons cited for their behavior included
too many steps in the process, amount too small,
missed deadline, fear of being placed on a mailing
list, lost receipt, and doubts about receiving the
money. Calculate an upper confidence bound at
the 95% confidence level for the true proportion of
such consumers who never apply for a rebate.
Based on this bound, is there compelling evidence
that the true proportion of such consumers is smal-
ler than 1/3? Explain your reasoning.
23. The article “An Evaluation of Football Helmets
Under Impact Conditions” (Amer. J. Sports Med.,
1984: 233–237) reports that when each football
helmet in a random sample of 37 suspension-type
helmets was subjected to a certain impact test, 24
showed damage. Let p denote the proportion of all
helmets of this type that would show damage
when tested in the prescribed manner.
a. Calculate a 99% CI for p.
b. What sample size would be required for the
width of a 99% CI to be at most .10, irrespec-
tive of
^
p?
24. A sample of 56 research cotton samples resulted
in a sample average percentage elongation of 8.17
and a sample standard deviation of 1.42 (“An
Apparent Relation Between the Spiral Angle f,
the Percent Elongation E
1
, and the Dimensions of
the Cotton Fiber,” Textile Res. J., 1978: 407–410).
Calculate a 95% large-sample CI for the true aver-
age percentage elongation m. What assumptions
are you making about the distribution of percent-
age elongation?
25. A state legislator wishes to survey residents of her
district to see what proportion of the electorate is
aware of her position on using state funds to pay
for abortions.
a. What sample size is necessary if the 95% CI
for p is to have width of at most .10 irrespective
of p?
b. If the legislator has strong reason to believe
that at least
2
3
of the electorate know of her
position, how large a sample size would you
recommend?
26. The superintendent of a large school district, hav-
ing once had a course in probability and statistics,
believes that the number of teachers absent on any
given day has a Poisson distribution with parame-
ter l. Use the accompanying data on absences for
50 days to derive a large-sample CI for l.[Hint:
The mean and variance of a Poisson variable both
equal l,so
Z ¼
X l
ffiffiffiffiffiffiffiffi
l=n
p
has approximately a standard normal distri-
bution. Now proceed as in the derivation of
the interval for p by making a probability
statement (with probability 1 a) and solv-
ing the resulting inequalities for l (see the
argument just after (8.10))].
Number of
absences 0 123 45678910
Frequency 1 48108753211
27. Reconsider the CI (8.10) for p, and focus on a
confidence level of 95%. Show that the confi-
dence limits agree quite well with those of the
traditional interval (8.11) once two successes and
two failures have been appended to the sample
[i.e., (8.11) based on (x+2) S’s in (n+4) trials].
[Hint: 1.96 2.] [Note: Agresti and Coull showed
that this adjustment of the traditional interval
also has actual confidence level close to the nomi-
nal level.]
400
CHAPTER 8 Statistical Intervals Based on a Single Sample

28. Young people may feel they are carrying the
weight of the world on their shoulders, when
what they are actually carrying too often is an
excessively heavy backpack. The article “Effec-
tiveness of a School-Based Backpack Health Pro-
motion Program” ( Work, 2003: 113–123) reported
the following data for a sample of 131 sixth
graders: for backpack weight lbðÞ;
x ¼ 13:83;
s ¼ 5:05; for backpack weight as a percentage
of body weight, a 95% CI for the population
mean was (13.62, 15.89).
a. Calculate and interpret a 99% CI for population
mean backpack weight.
b. Obtain a 99% CI for population mean weight
as a percentage of body weight.
c. The American Academy of Orthopedic Sur-
geons recommends that backpack weight be at
most 10% of body weight. What does your
calculation of (b) suggest, and why?
8.3
Intervals Based on a Normal Population
Distribution
The CI for m presented in Section 8.2 is valid provided that n is large. The resulting
interval can be used whatever the nature of the population distribution. The CLT
cannot be invoked, however, when n is small. In this case, one way to proceed is to
make a specific assumption about the form of the population distribution and then
derive a CI tailored to that assumption. For example, we could develop a CI for m
when the population is described by a gamma distribution, another interval for the
case of a Weibull population, and so on. Statisticians have indeed carried out this
program for a number of different distributional families. Because the normal
distribution is more frequently appropriate as a population model than is any
other type of distribution, we will focus here on a CI for this situation.
ASSUMPTION
The population of interest is normal, so that X
1
, ..., X
n
constitutes a random
sample from a normal distribution with both m and s unknown.
The key result underlying the interval in Section 8.2 is that for large n, the rv
Z ¼ð
X mÞ=ðS=
ffiffiffi
n
p
Þ has approximately a standard normal distribution. When n is
small, S is no longer likely to be close to s, so the variability in the distribution of Z
arises from randomness in both the numerator and the denominator. This implies
that the probability distribution of ð
X mÞ=ðS=
ffiffiffi
n
p
Þ will be more spread out than
the standard normal distribution. Inferences are based on the following result from
Section 6.4 using the family of t distributions:
THEOREM
When
X is the mean of a random sample of size n from a normal distribution
with mean m, the rv
T ¼
X m
S=
ffiffiffi
n
p
ð8:13Þ
has the t distribution with n 1 degre es of freedom (df ).
8.3 Intervals Based on a Normal Population Distribution 401
Properties of t Distributions
Before applying this theorem, a review of properties of t distributions is in order.
Although the variable of interest is still ð
X mÞ=ðS=
ffiffiffi
n
p
Þ, we now denote it by T to
emphasize that it does not have a standard normal distribution when n is small.
Recall that a normal distribution is governed by two parameters, the mean m and the
standard deviation s.At distribution is governed by only one parameter, the
number of degrees of freedom of the distribution, abbreviated df and denoted
by n. Possible values of n are the positive integer s 1, 2, 3, .... Each different value
of n corresponds to a different t distribution.
The density function for a random variable having a t distribution was derived
in Section 6.4. It is quite complicated, but fortunately we need concern ourselves only
with several of the more important features of the corresponding density curves.
PROPERTIES
OF T DISTRI-
BUTIONS
1. Each t
n
curve is bell-shaped and centered at 0.
2. Each t
n
curve is more spread out than the standard normal (z) curve.
3. As n increas es, the spread of the t
n
curve decreases.
4. As n !1, the sequence of t
n
curves approaches the standard normal
curve (so the z curve is often called the t curve with df ¼1).
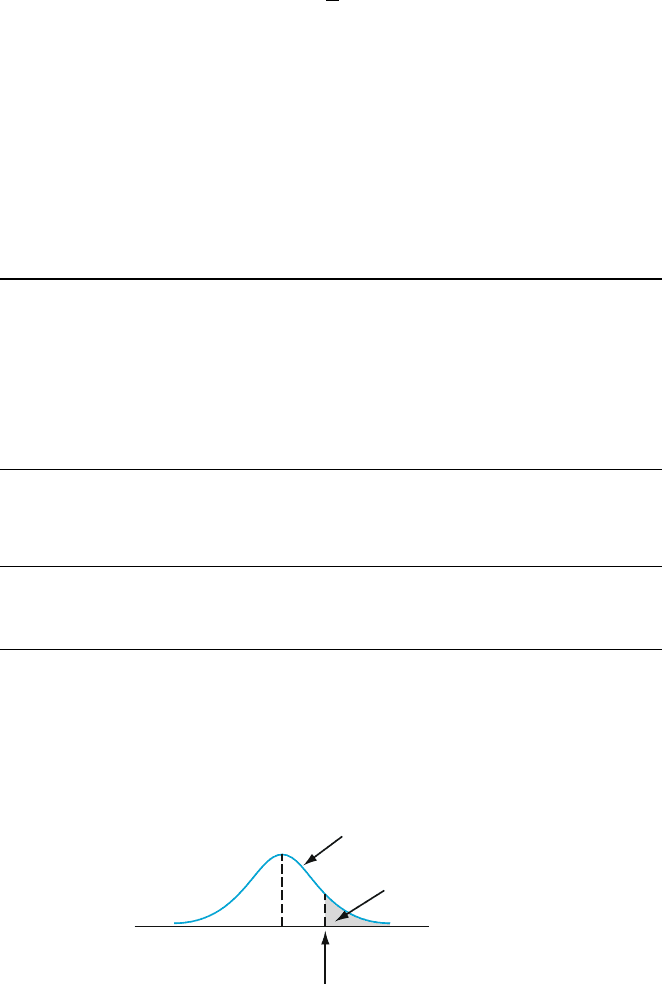
Recall the notation for values that capture p articular upper-tail t-curve areas.
NOTATION
Let t
a,n
¼ the number on the measurement axis for which the area under the
t curve with n df to the right of t
a,n
,isa; t
a,n
is called a t critical value.
This notation is illustrated in Figure 8.7. Appendix Table A.5 gives t
a,n
for selected
values of a and n. The colu mns of the table correspond to different values of a.
To obtain t
.05,15
, go to the a ¼ .05 column, look down to the n ¼ 15 row, and
read t
.05,15
¼ 1.753. Similarly, t
.05,22
¼ 1.717 (.05 column, n ¼ 22 row), and
t
.01,22
¼ 2.508.
The values of t
a,n
exhibit regular behavior as we move across a row or down a
column. For fixed n, t
a,n
increases as a decreases, since we must move farther to the
0
Shaded area =
a
t
a,n
t
n
curve
Figure 8.7 A pictorial definition of t
a,n
402 CHAPTER 8 Statistical Intervals Based on a Single Sample

right of zero to capture area a in the tail. For fixed a,asn is increased (i.e., as we
look down any particular colu mn of the t table) the value of t
a,n
decreases. This is
because a larger value of n implies a t distribution with smaller spread, so it is not
necessary to go so far from zero to capture tail area a. Furthermore, t
a,n
, decreases
more slowly as n increases. Consequently, the table values are shown in increments
of 2 between 30 and 40 df and then jump to n ¼ 50, 60, 120, and finally 1.
Because t
1
is the standard normal curve , the familiar z
a
values appear in the last
row of the table. The rule of thumb suggested earlier for use of the large-sample CI
(if n > 40) comes from the approximate equality of the standard normal and
t distributions for n 40.
The One-Sample t Confidence Interval
The standardized variable T has a t distribution with n 1 df, and the area
under the corresponding t density curve between t
a/2,n1
and t
a/2,n1
is 1 a
(area a/2 lies in each tail), so
Pðt
a=2;n1
< T < t
a=2;n1
Þ¼1 a ð8:14Þ
Expression (8.14) differs from expressions in previous sections in that T and t
a/2,n1
are used in place of Z and z
a/2
, but it can be manipulated in the same manner to
obtain a confidence interval for m.
PROPOSITION
Let
x and s be the sample mean and sample standar d deviation computed
from the results of a random sample from a normal population with mean m.
Then a 100(1 a)% confidence interval for m, the one-sample t CI,is
x t
a=2;n1
s
ffiffiffi
n
p
;
x þ t
a=2;n1
s
ffiffiffi
n
p
ð8:15Þ
or, more compactly,
x t
a=2;n1
s=
ffiffiffi
n
p
.
An upper confidence bound for m is
x þ t
a;n1
s
ffiffiffi
n
p
and replacing + by in this latter expression gives a lower confidence
bound for m; both have confidence level 100(1 a)%.
Example 8.11 Here are the alcohol percentages for a sample of 16 beers (light beers excluded):
4.68 4.13 4.80 4.63 5.08 5.79 6.29 6.79
4.93 4.25 5.70 4.74 5.88 6.77 6.04 4.95
Figure 8.8 shows a normal probability plot obtained from SAS. The plot is
sufficiently straight for the percentage to be assumed appro ximately normal.
8.3 Intervals Based on a Normal Population Distribution 403
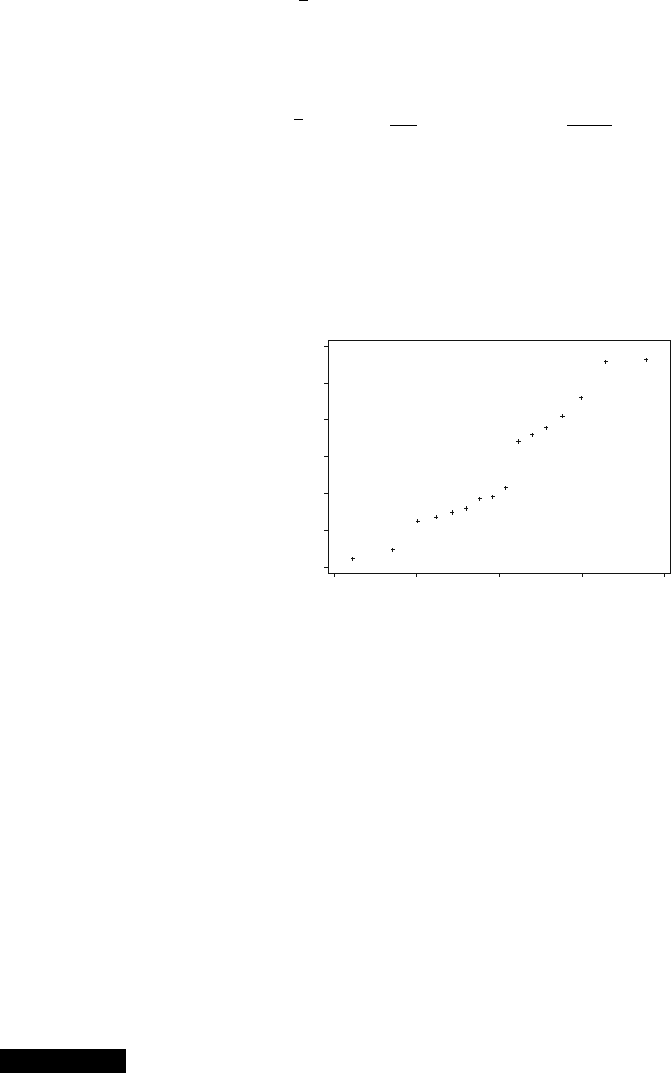
The mean is x ¼ 5:34 and the standard deviation is s ¼ .8483. The sample
size is 16, so a confidence interval for the popul ation mean percentage is based on
15 df. A confidence level of 95% for a two-sided interval requires the t critical
value of 2.131. The resulting interval is
x t
:025;15
s
ffiffiffi
n
p
¼ 5:34 ð2:131Þ
:8483
ffiffiffiffiffi
16
p
¼ 5:34 :45 ¼ð4:89; 5:79Þ
A 95% lower bound would use 1.753 in place of 2.131. It is interesting that the
95% confidence interval is consistent with the usual statemen t about the equiva-
lence of wine and beer in terms of alcohol content. That is, assuming an alcohol
percentage of 13% for wine, a 5-oz serving yields .65 oz of alcohol, while,
assuming 5.34% alcohol, a 12-oz serving of beer has .64 oz of alcohol.
Unfortunately, it is not easy to select n to control the width of the t interval.
This is because the width involves the unknown (before data collection) s and
because n enters not only through 1=
ffiffiffi
n
p
but also through t
a/2,n1
. As a result, an
appropriate n can be obtained only by trial and error.
In Chapter 14, we will discuss a small-sample CI for m that is valid provided
only that the population distribution is symmetric, a weaker assumption than
normality. However, when the population distribution is normal, the t interval
tends to be shorter than would be any other interval with the same confidence level.
A Prediction Interval for a Single Future Value
In many applications, an investigator wishes to predict a single value of a variable to
be observed at some future time, rather than to estimate the mean value of that
variable.
Example 8.12 Consider the following sample of fat content (in percentage) of n ¼ 10 randomly
selected hot dogs (“Sensory and Mechanical Assessment of the Quality of Frank-
furters,” J. Texture Stud., 1990: 395–409):
25.2 21.3 22.8 17.0 29.8 21.0 25.5 16.0 20.9 19.5
−2 −10 1 2
7.0
6.5
6.0
5.5
5.0
4.5
4.0
Normal Quantiles
p
e
r
c
e
n
t
Figure 8.8 A normal probability plot of the alcohol percentage data ■
404
CHAPTER 8 Statistical Intervals Based on a Single Sample

Assuming that these were selected from a normal population distribution, a 95% CI
for (interval estimate of) the population mean fat content is
x t
:025;9
s
ffiffiffi
n
p
¼ 21:90 2:262
4:134
ffiffiffiffiffi
10
p
¼ 21:90 2:96 ¼ð18:94; 24:86Þ
Suppose, however, you are going to eat a single hot dog of this type and want a
prediction for the resulting fat content. A point prediction, analogous to a point
estimate, is just
x ¼ 21:90. This prediction unfortunately gives no information
about reliability or precision. ■
The general setup is as follows: We will have available a random sample X
1
,
X
2
, ..., X
n
from a normal population distribution, and we wish to predict the value
of X
n+1
, a single future observation. A point predictor is X, and the resulting
prediction error is
X X
nþ
1
. The expected value of the prediction error is
Eð
X X
nþ
1
Þ¼EðXÞEX
nþ
1
ðÞ¼m m ¼ 0
Since X
n+1
is independent of X
1
, ..., X
n
, it is independent of X, so the variance of
the prediction error is
Vð
X X
nþ
1
Þ¼VðXÞþVX
nþ
1
ðÞ¼
s
2
n
þ s
2
¼ s
2
1 þ
1
n
The prediction error is a linear combination of independent normally distributed
rv’s, so itself is normally distributed. Thus
Z ¼
ðX X
nþ1
Þ0
ffiffiffiffiffiffiffiffiffiffiffiffiffiffiffiffiffiffiffi
s
2
1 þ
1
n
q
¼
X X
nþ1
ffiffiffiffiffiffiffiffiffiffiffiffiffiffiffiffiffiffiffi
s
2
1 þ
1
n
q
has a standard normal distribution. As in the derivation of the distribution of
ð
X mÞ=ðS=
ffiffiffi
n
p
Þ in Section 6.4, it can be shown (Exercise 43) that replacing s by
the sample standard deviation S (of X
1
, ... , X
n
) results in
T ¼
X X
nþ1
S
ffiffiffiffiffiffiffiffiffiffi
1 þ
1
n
q
t distribut ion with n 1df
Manipulating this T variable as T ¼ð
X mÞ=ðS=
ffiffiffi
n
p
Þ was manipulated in the
development of a CI gives the following resu lt.
PROPOSITION
A prediction interval (PI) for a single observation to be selected from a
normal population distribution is
x t
a=2;n1
s
ffiffiffiffiffiffiffiffiffiffiffi
1 þ
1
n
r
ð8:16Þ
The prediction level is 100(1 a)%.
The interpretation of a 95% prediction level is similar to that of a 95% confidence
level; if the interval (8.16) is calculated for sample after sample, in the long run
95% of these intervals will include the corresponding future values of X.
8.3 Intervals Based on a Normal Population Distribution 405

Example 8.13
(Example 8.12
continued)
With n ¼ 10, x ¼ 21:90, s ¼ 4.134, and t
.025,9
¼ 2.262, a 95% PI for the fat
content of a single hot dog is
21:90 ð2:262Þð4: 134Þ
ffiffiffiffiffiffiffiffiffiffiffiffiffiffi
1 þ
1
10
r
¼ 21:90 9:81 ¼ 12:09; 31:71Þð
This interval is quite wide, indicating substantial uncertainty about fat content.
Notice that the width of the PI is more than three times that of the CI.
■
The error of prediction is X X
nþ
1
, a difference between two random vari-
ables, whereas the estimation error is
X m, the difference between a random
variable and a fixed (but unknown) value. The PI is wider than the CI because
there is more variability in the prediction error (due to X
n+1
) than in the estimation
error. In fact, as n gets arbitrarily large, the CI shrinks to the single value m, and
the PI approaches m z
a/2
·s. There is uncertainty about a single X value even
when there is no need to estimate.
Tolerance Intervals
In addition to confidence intervals and prediction intervals, statisticians are some-
times called upon to obtain a third type of interval called a tolerance interval (TI).
A TI is an interval that with a high degree of reliability captures at least a specified
percentage of the x values in a population distribution. For example, if the popula-
tion distribution of fuel efficienc y is normal, then the interval from m 1.645s to
m + 1.645s captures 90% of the fuel efficiency values in the population. It can then
be shown that if m and s are replaced by their natural estimates
x and s based on a
sample of size n ¼ 20 and the z critical value 1.645 is replaced by a tolerance
critical value 2.310, the resulting interval contains at least 90% of the popu lation
values with a confiden ce level of 95%.
Please consult one of the chapter references for more information on TIs. And
before you calculate a particular statistical interval, be sure that it is the correct type
of interval to fulfill your objective!
Intervals Based on Nonnormal Population Distributions
The one-sample t CI for m is robust to small or even moderate departures from
normality unless n is quite small. By this we mean that if a critical value for 95%
confidence, for example, is used in calculating the interval, the actual confidence
level will be reasonably close to the nominal 95% level. If, however, n is small and
the population distribution is highly nonnormal, then the actual confidence level
may be considerably different from the one you think you are using when you
obtain a particular critical value from the t table. It would certainly be distressing to
believe that your confidence level is about 95% when in fact it was really more like
88%! The bootstrap technique, discussed in the last section of this chapter, has been
found to be quite successf ul at estimating parameters in a wide variety of non-
normal situations.
In contrast to the confidence interval, the validity of the prediction intervals
described in this section is closely tied to the normality assumption. These latter
intervals should not be used in the absence of compelling evidence for normality.
The excellent reference Statistical Intervals, cited in the bibliography at the end of
this chapter, discusses alternative procedures of this sort for various other situations.
406 CHAPTER 8 Statistical Intervals Based on a Single Sample

Exercises Section 8.3 (29–43)
29. Determine the values of the following quantities:
a. t
.1,15
b. t
.05,15
c. t
.05,25
d. t
.05,40
e. t
.005,40
30. Determine the t critical value that will capture
the desired t curve area in each of the following
cases:
a. Central area ¼ .95, df ¼ 10
b. Central area ¼ .95, df ¼ 20
c. Central area ¼ .99, df ¼ 20
d. Central area ¼ .99, df ¼ 50
e. Upper-tail area ¼ .01, df ¼ 25
f. Lower-tail area ¼ .025, df ¼ 5
31. Determine the t critical value for a two-sided
confidence interval in each of the following
situations:
a. Confidence level ¼ 95%, df ¼ 10
b. Confidence level ¼ 95%, df ¼ 15
c. Confidence level ¼ 99%, df ¼ 15
d. Confidence level ¼ 99%, n ¼ 5
e. Confidence level ¼ 98%, df ¼ 24
f. Confidence level ¼ 99%, n ¼ 38
32. Determine the t critical value for a lower or an
upper confidence bound for each of the situations
described in Exercise 31.
33. A sample of ten guinea pigs yielded the follow-
ing measurements of body temperature in
degrees Celsius (Statistical Exercises in Medical
Research, New York: Wiley, 1979, p. 26):
38.1 38.4 38.3 38.2 38.2 37.9 38.7 38.6
38.0 38.2
a. Verify graphically that it is reasonable to
assume the normal distribution.
b. Compute a 95% confidence interval for the
population mean temperature.
c. What is the CI if temperature is re-expressed
in degrees Fahrenheit? Are guinea pigs
warmer on average than humans?
34. Here is a sample of ACT scores (average of the
Math, English, Social Science, and Natural Sci-
ence scores) for students taking college freshman
calculus:
24.00 28.00 27.75 27.00 24.25 23.50 26.25
24.00 25.00 30.00 23.25 26.25 21.50 26.00
28.00 24.50 22.50 28.25 21.25 19.75
a. Using an appropriate graph, see if it is plausible
that the observations were selected from a
normal distribution.
b. Calculate a two-sided 95% confidence inter-
val for the population mean.
c. The university ACT average for entering
freshmen that year was about 21. Are the
calculus students better than average, as
measured by the ACT?
35. A sample of 14 joint specimens of a particular
type gave a sample mean proportional limit
stress of 8.48 MPa and a sample standard devia-
tion of .79 MPa (“Characterization of Bearing
Strength Factors in Pegged Timber Connec-
tions,” J. Struct. Engrg., 1997: 326–332).
a. Calculate and interpret a 95% lower confi-
dence bound for the true average proportional
limit stress of all such joints. What, if any,
assumptions did you make about the distribu-
tion of proportional limit stress?
b. Calculate and interpret a 95% lower predic-
tion bound for the proportional limit stress of
a single joint of this type.
36. Even as traditional markets for sweetgum lumber
have declined, large section solid timbers tradi-
tionally used for construction bridges and mats
have become increasingly scarce. The article
“Development of Novel Industrial Laminated
Planks from Sweetgum Lumber” (J. of Bridge
Engr., 2008: 64–66) described the manufacturing
and testing of composite beams designed to add
value to low-grade sweetgum lumber. Here is
data on the modulus of rupture (psi; the article
contained summary data expressed in MPa):
6807.99 7637.06 6663.28 6165.03 6991.41 6992.23
6981.46 7569.75 7437.88 6872.39 7663.18 6032.28
6906.04 6617.17 6984.12 7093.71 7659.50 7378.61
7295.54 6702.76 7440.17 8053.26 8284.75 7347.95
7422.69 7886.87 6316.67 7713.65 7503.33 7674.99
a. Verify the plausibility of assuming a normal
population distribution.
b. Estimate the true average modulus of rupture
in a way that conveys information about pre-
cision and reliability.
c. Predict the modulus for a single beam in a
way that conveys information about precision
and reliability. How does the resulting predic-
tion compare to the estimate in (b).
8.3 Intervals Based on a Normal Population Distribution 407