Devore J.L., Berk K.N. Modern Mathematical Statistics with Applications
Подождите немного. Документ загружается.

20. Lightbulbs of a certain type are advertised as having
an average lifetime of 750 h. The price of these
bulbs is very favorable, so a potential customer
has decided to go ahead with a purchase arrange-
ment unless it can be conclusively demonstrated
that the true average lifetime is smaller than what
is advertised. A random sample of 50 bulbs was
selected, the lifetime of each bulb determined, and
the appropriate hypotheses were tested using MINI-
TAB, resulting in the accompanying output.
Variable N Mean StDev SEMean Z P-Value
lifetime 50 738.44 38.20 5.40 2.14 0.016
What conclusion would be appropriate for a
significance level of .05? A significance level
of .01? What significance level and conclusion
would you recommend?
21. The true average diameter of ball bearings of a
certain type is supposed to be .5 in. A one-sample
t test will be carried out to see whether this is the
case. What conclusion is appropriate in each of
the following situations?
a. n ¼ 13, t ¼ 1.6, a ¼ .05
b. n ¼ 13, t ¼1.6, a ¼ .05
c. n ¼ 25, t ¼2.6, a ¼ .01
d. n ¼ 25, t ¼3.9
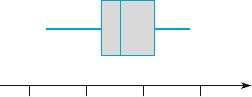
22. The article “The Foreman’s View of Quality Con-
trol” (Quality Engrg., 1990: 257–280) described
an investigation into the coating weights for large
pipes resulting from a galvanized coating pro-
cess. Production standards call for a true average
weight of 200 lb per pipe. The accompanying
descriptive summary and boxplot are from
MINITAB.
Variable N Mean Median TrMean StDev SEMean
ctg wt 30 206.73 206.00 206.81 6.35 1.16
Variable Min Max Q1 Q3
ctg wt 193.00 218.00 202.75 212.00
200 210190 220
Coating weigh
t
a. What does the boxplot suggest about the status
of the specification for true average coating
weight?
b. A normal probability plot of the data was quite
straight. Use the descriptive output to test the
appropriate hypotheses.
23. Exercise 33 in Chapter 1 gave n ¼ 26 observations
on escape time (sec) for oil workers in a simulated
exercise, from which the sample mean and sample
standard deviation are 370.69 and 24.36, respec-
tively. Suppose the investigators had believed a
priori that true average escape time would be at
most 6 min. Does the data contradict this prior
belief? Assuming normality, test the appropriate
hypotheses using a significance level of .05.
24. Reconsider the sample observations on stabilized
viscosity of asphalt specimens introduced in
Exercise 43 in Chapter 1 (2781, 2900, 3013,
2856, and 2888). Suppose that for a particular
application, it is required that true average viscosity
be 3000. Does this requirement appear to have been
satisfied? State and test the appropriate hypotheses.
25. Recall the first-grade IQ scores of Example 1.2.
Here is a random sample of 10 of those scores:
107 113 108 127 146 103 108 118 111 119
The IQ test score has approximately a normal
distribution with mean 100 and standard deviation
15 for the entire U.S. population of first-graders.
Here we are interested in seeing whether the pop-
ulation of first-graders at this school is different
from the national population. Assume that the
normal distribution with standard deviation 15 is
valid for the school, and test at the .05 level to see
whether the school mean differs from the national
mean. Summarize your conclusion in a sentence
about these first-graders.
26. In recent years major league baseball games have
averaged 3 h in duration. However, because games
in Denver tend to be high-scoring, it might be
expected that the games would be longer there.
In 2001, the 81 games in Denver averaged
185.54 min with standard deviation 24.6 min.
What would you conclude?
27. On the label, Pepperidge Farm bagels are said to
weigh four ounces each (113 g). A random sample
of six bagels resulted in the following weights (in
grams):
117.6 109.5 111.6 109.2 119.1 110.8
a. Based on this sample, is there any reason to
doubt that the population mean is at least 113 g?
448
CHAPTER 9 Tests of Hypotheses Based on a Single Sample

b. Assume that the population mean is actually
110 g and that the distribution is normal with
standard deviation 4 g. In a z test of H
0
:
m ¼ 113 against H
a
: m < 113 with a ¼ .05,
find the probability of rejecting H
0
with six
observations.
c. Under the conditions of part (b) with a ¼ .05,
how many more observations would be needed
in order for the power to be at least .95?
28. Minor surgery on horses under field conditions
requires a reliable short-term anesthetic producing
good muscle relaxation, minimal cardiovascular
and respiratory changes, and a quick, smooth
recovery with minimal aftereffects so that horses
can be left unattended. The article “A Field Trial
of Ketamine Anesthesia in the Horse” (Equine
Vet. J., 1984: 176–179) reports that for a sample
of n ¼ 73 horses to which ketamine was adminis-
tered under certain conditions, the sample average
lateral recumbency (lying-down) time was
18.86 min and the standard deviation was
8.6 min. Does this data suggest that true average
lateral recumbency time under these conditions is
less than 20 min? Test the appropriate hypotheses
at level of significance .10.
29. The amount of shaft wear (.0001 in.) after a fixed
mileage was determined for each of n ¼ 8 internal
combustion engines having copper lead as a bear-
ing material, resulting in
x ¼ 3:72 and s ¼ 1.25.
a. Assuming that the distribution of shaft wear is
normal with mean m, use the t test at level .05 to
test H
0
: m ¼ 3.50 versus H
a
: m > 3.50.
b. Using s ¼ 1.25, what is the type II error prob-
ability b(m
0
) of the test for the alternative
m
0
¼ 4.00?
30. The recommended daily dietary allowance for zinc
among males older than age 50 years is 15 mg/day.
The article “Nutrient Intakes and Dietary Patterns
of Older Americans: A National Study” (J. Geron-
tol., 1992: M145–150) reports the following sum-
mary data on intake for a sample of males age
65–74 years: n ¼ 115,
x ¼ 11:3, and s ¼ 6.43.
Does this data indicate that average daily zinc
intake in the population of all males age 65–74
falls below the recommended allowance?
31. In an experiment designed to measure the time
necessary for an inspector’s eyes to become used
to the reduced amount of light necessary for pene-
trant inspection, the sample average time for
n ¼ 9 inspectors was 6.32 s and the sample stan-
dard deviation was 1.65 s. It has previously been
assumed that the average adaptation time was at
least 7 s. Assuming adaptation time to be normally
distributed, does the data contradict prior belief?
Use the t test with a ¼ .1.
32. A sample of 12 radon detectors of a certain
type was selected, and each was exposed to
100 pCi/L of radon. The resulting readings were
as follows:
105.6 90.9 91.2 96.9 96.5 91.3
100.1 105.0 99.6 107.7 103.3 92.4
a. Does this data suggest that the population mean
reading under these conditions differs from
100? State and test the appropriate hypotheses
using a ¼ .05.
b. Suppose that prior to the experiment, a value of
s ¼ 7.5 had been assumed. How many deter-
minations would then have been appropriate to
obtain b ¼ .10 for the alternative m ¼ 95?
33. Show that for any D > 0, when the population
distribution is normal and s is known, the two-
tailed test satisfies b(m
0
D) ¼ b(m
0
+ D), so
that b(m
0
) is symmetric about m
0
.
34. For a fixed alternative value m
0
, show that
b(m
0
) ! 0asn !1for either a one-tailed or a
two-tailed z test in the case of a normal population
distribution with known s.
35. The industry standard for the amount of alcohol
poured into many types of drinks (e.g., gin for a
gin and tonic, whiskey on the rocks) is 1.5 oz.
Each individual in a sample of 8 bartenders with
at least 5 years of experience was asked to pour
rum for a rum and coke into a short, wide (tum-
bler) glass, resulting in the following data:
2.00 1.78 2.16 1.91 1.70 1.67 1.83 1.48
(Summary quantities agree with those given in the
article “Bottoms Up! The Influence of Elongation on
Pouring and Consumption Volume,” J. Consumer
Res., 2003: 455–463.)
a. What does a boxplot suggest about the distri-
bution of the amount poured?
b. Carry out a test of hypotheses to decide
whether there is strong evidence for conclud-
ing that the true average amount poured differs
from the industry standard.
c. Does the validity of the test you carried out in
(b) depend on any assumptions about the pop-
ulation distribution? If so, check the plausibil-
ity of such assumptions.
d. Suppose the actual standard deviation of the
amount poured is .20 oz. Determine the proba-
bility of a type II error for the test of (b) when
the true average amount poured is actually
(1) 1.6, (2) 1.7, (3) 1.8.
9.2 Tests About a Population Mean 449

9.3
Tests Concerning a Population Proportion
Let p denote the proportion of individuals or objects in a population who possess
a specified property (e.g., cars with manual transmissions or smokers who smoke a
filter cigarette). If an individual or object with the propert y is labeled a success (S),
then p is the population proportion of successes. Tests concerning p will be based
on a random sample of size n from the population. Provided that n is small relative
to the population size, X (the number of S’s in the sample) has (approximately) a
binomial distribution. Furthermore, if n itself is large, both X and the estimator
^
p ¼ X=n are approximately normally distributed. We first consider large-sample
tests based on this latter fact and then turn to the small-sample case that directly
uses the binomial distribution.
Large-Sample Tests
Large-sample tests concerning p are a special case of the more general large-sample
procedures for a parameter y. Let
^
y be an estimator of y that is (at least approxi-
mately) unbiased and has approximately a normal distribution. The null hypothesis
has the form H
0
: y ¼ y
0
, where y
0
denotes a number (the null value) appropriate
to the problem context. Suppose that when H
0
is true, the standard deviation of
^
y, s
^
y
, involves no unknown parameters. For example, if y ¼ m and
^
y ¼ X,
s
^
y
¼ s
X
¼ s=
ffiffiffi
n
p
, which involves no unknown para meters only if the value of s
is known. A large-sample test statistic results from standardizing
^
y under the
assumption that H
0
is true [so that Eð
^
yÞ¼y
0
]:
Test statistic:
^
y y
0
s
^
y
If the alternative hypothesis is H
a
: y > y
0
, an upper-tailed test whose significance
level is approximately a is specified by the rejection region z z
a
. The other two
alternatives, H
a
: y < y
0
and H
a
: y 6¼ y
0
, are tested using a lower-tailed z test and a
two-tailed z test, respectively.
In the case y ¼ p, s
^
y
will not involve any unknown parameters when H
0
is
true, but this is atypical. When s
^
y
does involve unknown parameters, it is often
possible to use an estimated standard deviation S
^
y
in place of s
^
y
and still have Z
approximately normally distributed when H
0
is true (because when n is large,
s
^
y
s
^
y
for most samples). The large-sample test of the previous section furnishes
an example of this: Because s is usually unknown, we use s
^
y
¼ s
X
¼ s=
ffiffiffi
n
p
in place
of s=
ffiffiffi
n
p
in the denominator of z.
The estimator
^
p ¼ X=n is unbiased [Eð
^
pÞ¼p], has approximately a normal
distribution, and its standard deviation is s
^
p
¼
ffiffiffiffiffiffiffiffiffiffiffiffiffiffiffiffiffiffiffiffiffiffi
pð1 pÞ=n
p
. These facts were
used in Section 8.2 to obtain a confidence interval for p. When H
0
is true, Eð
^
pÞ¼p
0
and s
^
p
¼
ffiffiffiffiffiffiffiffiffiffiffiffiffiffiffiffiffiffiffiffiffiffiffiffiffiffi
p
0
ð1 p
0
Þ=n
p
,sos
^
p
does not involve any unknown parameters. It then
follows that when n is large and H
0
is true, the test statistic
Z ¼
^
p p
0
ffiffiffiffiffiffiffiffiffiffiffiffiffiffiffiffiffiffiffiffiffiffiffiffiffiffi
p
0
ð1 p
0
Þ=n
p
450 CHAPTER 9 Tests of Hypotheses Based on a Single Sample

has approximately a standard normal distribution. If the alternative hypothesis is
H
a
: p > p
0
and the upper-tailed rejection region z z
a
is used, then
Pðtype I errorÞ¼PðH
0
is rejected when it is trueÞ
¼PðZ z
a
when Z has approximat ely a standard normal
distributionÞa
Thus the desired level of significa nce a is attained by using the critical value that
captures area a in the upper tail of the z curve. Rejection regions for the other two
alternative hypotheses, lower-tailed for H
a
: p < p
0
and two-tailed for H
a
: p 6¼ p
0
,
are justified in an analogous manner.
Null hypothesis: H
0
: p ¼ p
0
Test statistic value: z ¼
^
p p
0
ffiffiffiffiffiffiffiffiffiffiffiffiffiffiffiffiffiffiffiffiffiffiffiffiffiffi
p
0
ð1 p
0
Þ=n
p
Alternative Hypothesis Rejection Region
H
a
: p > p
0
z z
a
(upper-tailed)
H
a
: p < p
0
z z
a
(lower-tailed)
H
a
: p 6¼ p
0
either z z
a/2
or z z
a/2
(two-tailed)
These test procedures are valid provided that np
0
10 and n(1 p
0
) 10.
Example 9.11 Recent information suggests that obesity is an increasing problem in America
among all age groups. The Associated Press (Oct. 9, 2002) repor ted that 1276
individuals in a sample of 4115 adults were found to be obese (a body mass index
exceeding 30; this index is a measure of weight relative to height). A 1998 survey
based on people’s own assessment revealed that 20% of adult Americans consid-
ered themselves obese. Does the rece nt data suggest that the true proportion of
adults who are obese is more than 1.5 times the percentage from the self-assessment
survey? Let’s carry out a test of hypotheses using a significance level of .10.
1. p ¼ the proportion of all American adults who are obese.
2. Sayin g that the current percentage is 1.5 times the self-assessment percentage is
equivalent to the asse rtion that the current percentage is 30%, from which we
have the null hypothesis as H
0
: p ¼ .30.
3. Th e phrase “more than” in the problem description implies that the alternative
hypothesis is H
a
: p > .30.
4. Since np
0
¼ 4115(.3) 10 and nq
0
¼ 4115(.7) 10, the large-sample z test
can certainly be used. The test statistic value is
z ¼ð
^
p :3Þ=
ffiffiffiffiffiffiffiffiffiffiffiffiffiffiffiffiffiffiffiffi
ð:3Þð:7Þ=n
p
9.3 Tests Concerning a Population Proportion 451

5. Th e form of H
a
implies that an upper-tailed test is appropriate: Reject H
0
if z z
.10
¼ 1.28.
6.
^
p ¼ 1276=4115 ¼ :310, from which
z ¼ð:310 :3Þ=
ffiffiffiffiffiffiffiffiffiffiffiffiffiffiffiffiffiffiffiffiffiffiffiffiffiffiffi
ð:3Þð:7Þ=4115
p
¼ :010=:0071 ¼ 1:40:
7. Since 1.40 exceeds the critical value 1.28, z lies in the rejection region. This
justifies rejecting the null hypothesis. Using a significance level of .10, it does
appear that more than 30% of American adults are obese.
■
b and Sample Size Determination When H
0
is true, the test statistic Z has
approximately a standard normal distribution. Now suppose that H
0
is not true
and that p ¼ p
0
.ThenZ still has approximately a normal distribution (because it is a
linear function of
^
p), but its mean value and variance are no longer 0 and 1,
respectively. Instead,
EðZÞ¼
p
0
p
0
ffiffiffiffiffiffiffiffiffiffiffiffiffiffiffiffiffiffiffiffiffiffiffiffiffiffi
p
0
ð1 p
0
Þ=n
p
VðZÞ¼
p
0
ð1 p
0
Þ=n
p
0
ð1 p
0
Þ=n
The probability of a type II error for an upper-tailed test is b(p
0
) ¼ P(Z < z
a
when
p ¼ p
0
). This can be computed by using the given mean and variance to standardize
and then referring to the standard normal cdf. In addition, if it is desired that
the level a test also have b(p
0
) ¼ b for a specified value of b, this equation can
be solved for the necessary n as in Section 9.2. General expressions for b(p
0
) and n
are given in the accompanying box.
Alternative Hypothesis b(p
0
)
H
a
: p > p
0
F
p
0
p
0
þ z
a
ffiffiffiffiffiffiffiffiffiffiffiffiffiffiffiffiffiffiffiffiffiffiffiffiffiffi
p
0
ð1 p
0
Þ=n
p
ffiffiffiffiffiffiffiffiffiffiffiffiffiffiffiffiffiffiffiffiffiffiffiffi
p
0
ð1 p
0
Þ=n
p
"#
H
a
: p < p
0
1 F
p
0
p
0
z
a
ffiffiffiffiffiffiffiffiffiffiffiffiffiffiffiffiffiffiffiffiffiffiffiffiffiffi
p
0
ð1 p
0
Þ=n
p
ffiffiffiffiffiffiffiffiffiffiffiffiffiffiffiffiffiffiffiffiffiffiffiffi
p
0
ð1 p
0
Þ=n
p
"#
H
a
: p 6¼ p
0
F
p
0
p
0
þ z
a=2
ffiffiffiffiffiffiffiffiffiffiffiffiffiffiffiffiffiffiffiffiffiffiffiffiffiffi
p
0
ð1 p
0
Þ=n
p
ffiffiffiffiffiffiffiffiffiffiffiffiffiffiffiffiffiffiffiffiffiffiffiffi
p
0
ð1 p
0
Þ=n
p
"#
F
p
0
p
0
z
a=2
ffiffiffiffiffiffiffiffiffiffiffiffiffiffiffiffiffiffiffiffiffiffiffiffiffiffi
p
0
ð1 p
0
Þ=n
p
ffiffiffiffiffiffiffiffiffiffiffiffiffiffiffiffiffiffiffiffiffiffiffiffi
p
0
ð1 p
0
Þ=n
p
"#
The sample size n for which the level a test also satisfies b(p
0
) ¼ b is
n ¼
z
a
ffiffiffiffiffiffiffiffiffiffiffiffiffiffiffiffiffiffiffiffiffi
p
0
ð1 p
0
Þ
p
þ z
b
ffiffiffiffiffiffiffiffiffiffiffiffiffiffiffiffiffiffiffiffi
p
0
ð1 p
0
Þ
p
p
0
p
0
"#
2
one tailed test
z
a=2
ffiffiffiffiffiffiffiffiffiffiffiffiffiffiffiffiffiffiffiffiffi
p
0
ð1 p
0
Þ
p
þ z
b
ffiffiffiffiffiffiffiffiffiffiffiffiffiffiffiffiffiffiffiffi
p
0
ð1 p
0
Þ
p
p
0
p
0
"#
2
two tailed test (an
approximate solution)
8
>
>
>
>
>
<
>
>
>
>
>
:
452 CHAPTER 9 Tests of Hypotheses Based on a Single Sample

Example 9.12 A package-delivery service advertises that at least 90% of all packages brought to its
office by 9 a.m. for delivery in the same city are delivered by noon that day. Let
p denote the true proportion of such packages that are delivered as advertised and
consider the hypotheses H
0
: p ¼ .9 versus H
a
: p < .9. If only 80% of the packages
are delivered as advertised, how likely is it that a level .01 test based on n ¼ 225
packages will detect such a departure from H
0
? What should the sample size be to
ensure that b(.8) ¼ .01? With a ¼ .01, p
0
¼ .9, p
0
¼ .8, and n ¼ 225,
bð:8Þ¼1 F
:9 :8 2:33
ffiffiffiffiffiffiffiffiffiffiffiffiffiffiffiffiffiffiffiffiffiffiffiffiffi
ð:9Þð:1Þ=225
p
ffiffiffiffiffiffiffiffiffiffiffiffiffiffiffiffiffiffiffiffiffiffiffiffiffi
ð:8Þð:2Þ=225
p
"#
¼ 1 Fð2:00 Þ¼:0228
Thus the probability that H
0
will be rejected using the test when p ¼ .8 is .9772—
roughly 98% of all samples will result in correct rejection of H
0
.
Using z
a
¼ z
b
¼ 2.33 in the sample size formula yields
n ¼
2:33
ffiffiffiffiffiffiffiffiffiffiffiffiffiffiffi
ð:9Þð:1Þ
p
þ 2:33
ffiffiffiffiffiffiffiffiffiffiffiffiffiffiffi
ð:8Þð:2Þ
p
:8 :9
"#
2
266
■
Small-Sample Tests
Test procedures when the sample size n is small are based direct ly on the binomial
distribution rather than the normal approximation. Consider the alternative hypoth-
esis H
a
: p > p
0
and again let X be the number of successes in the sample. Then X
is the test statistic, and the upper-tailed rejection region has the form x c. When
H
0
is true, X has a binomial distribution with parameters n and p
0
,so
Pðtype I errorÞ¼PðH
0
is rejected when it is trueÞ
¼ P½X c when X Binðn; p
0
Þ
¼ 1 P½X c 1 when X Binðn; p
0
Þ
¼ 1 Bðc 1; n; p
0
Þ
As the critica l value c decreases, more x values are included in the rejection
region and P(type I error) increases. Because X has a discrete probability distribu-
tion, it is usually not possible to find a valu e of c for which P(type I error) is exactly
the desired significance level a (e.g., .05 or .01). Instead, the largest rejection region
of the form {c, c +1,..., n } satisfying 1 B(c 1; n, p
0
) a is used.
Let p
0
denote an alternative value of pp
0
>p
0
ðÞ.Whenp ¼ p
0
; X Bin n; p
0
ðÞ,
so
bðp
0
Þ¼Pðtype II error when p ¼ p
0
Þ¼P½X < c when X Binðn; p
0
Þ
¼ Bðc 1; n; p
0
Þ
That is, b(p
0
) is the result of a straightforward binomial probability calculation.
The sample size n necessary to ensure that a level a test also has specified b at a
particular alternative value p
0
must be determined by trial and error using the
binomial cdf.
Test procedures for H
a
: p < p
0
and for H
a
: p 6¼ p
0
are constructed in a similar
manner. In the former case, the appropriate rejection region has the form x c (a lower-
tailed test). The critical value c is the largest number satisfying B(c; n, p
0
) a.
9.3 Tests Concerning a Population Proportion 453

The rejection region when the alternative hypothesis is H
a
: p 6¼ p
0
consists of both large
and small x values.
Example 9.13 A plastics manufacturer has developed a new type of plastic trash can and
proposes to sell them with an unconditional 6-year warra nty. To see whether this
is economically feasible, 20 prototype cans are subjected to an accelerated life
test to simulate 6 years of use. The proposed warranty will be modified only if
the sample data strongly suggests that fewer than 90% of such cans would survive
the 6-year period. Let p denote the proportion of all cans that survive the acceler-
ated test. The relevant hypotheses are then H
0
: p ¼ .9 versus H
a
: p < .9. A decision
will be based on the test statistic X, the number among the 20 that survive.
If the desired significance level is a ¼ .05, c must satisfy B(c; 20, .9) .05.
From Appendix Table A.1, B(15; 20, .9) ¼ .043, and B(16; 20, .9) ¼ .133. The
appropriate rejection region is therefore x 15. If the accelerated test results in
x ¼ 14, H
0
would be rejected in favor of H
a
, necessitating a modification of
the proposed warranty. The probability of a type II error for the alternative value
p
0
¼ .8 is
bð:8Þ¼P½H
0
is not rejected when X Binð 20 ;:8Þ
¼ P½X 16 when X Binð20;:8Þ
¼ 1 Bð15; 20;:8Þ1 :370 ¼ :630
That is, when p ¼ .8, 63% of all samples consi sting of n ¼ 20 cans would result in
H
0
being incorrectly not rejected. This error probability is high because 20 is a
small sample size and p
0
¼ .8 is close to the null value p
0
¼ .9. ■
Exercises Section 9.3 (36–44)
36. State DMV records indicate that of all vehicles
undergoing emissions testing during the previous
year, 70% passed on the first try. A random sam-
ple of 200 cars tested in a particular county during
the current year yields 124 that passed on the
initial test. Does this suggest that the true propor-
tion for this county during the current year differs
from the previous statewide proportion? Test the
relevant hypotheses using a ¼ .05.
37. A manufacturer of nickel–hydrogen batteries ran-
domly selects 100 nickel plates for test cells,
cycles them a specified number of times, and
determines that 14 of the plates have blistered.
a. Does this provide compelling evidence for con-
cluding that more than 10% of all plates blister
under such circumstances? State and test the
appropriate hypotheses using a significance
level of .05. In reaching your conclusion,
what type of error might you have committed?
b. If it is really the case that 15% of all plates
blister under these circumstances and a sample
size of 100 is used, how likely is it that the null
hypothesis of part (a) will not be rejected by
the level .05 test? Answer this question for a
sample size of 200.
c. How many plates would have to be tested to
have b(.15) ¼ .10 for the test of part (a)?
38. A random sample of 150 recent donations at a
blood bank reveals that 82 were type A blood.
Does this suggest that the actual percentage of
type A donations differs from 40%, the percentage
of the population having type A blood? Carry out
a test of the appropriate hypotheses using a signif-
icance level of .01. Would your conclusion have
been different if a significance level of .05 had
been used?
39. A university library ordinarily has a complete
shelf inventory done once every year. Because of
new shelving rules instituted the previous year, the
head librarian believes it may be possible to save
money by postponing the inventory. The librarian
decides to select at random 1000 books from the
454
CHAPTER 9 Tests of Hypotheses Based on a Single Sample
library’s collection and have them searched in a
preliminary manner. If evidence indicates strongly
that the true proportion of misshelved or unloca-
table books is <.02, then the inventory will be
postponed.
a. Among the 1000 books searched, 15 were mis-
shelved or unlocatable. Test the relevant
hypotheses and advise the librarian what to do
(use a ¼ .05).
b. If the true proportion of misshelved and lost
books is actually .01, what is the probability
that the inventory will be (unnecessarily) taken?
c. If the true proportion is .05, what is the proba-
bility that the inventory will be postponed?
40. The article “Statistical Evidence of Discrimina-
tion” (J. Amer. Statist. Assoc., 1982: 773–783)
discusses the court case Swain v. Alabama
(1965), in which it was alleged that there was
discrimination against blacks in grand jury selec-
tion. Census data suggested that 25% of those
eligible for grand jury service were black, yet a
random sample of 1050 people called to appear for
possible duty yielded only 177 blacks. Using a
level .01 test, does this data argue strongly for a
conclusion of discrimination?
41. A plan for an executive traveler’s club has been
developed by an airline on the premise that 5% of
its current customers would qualify for member-
ship. A random sample of 500 customers yielded
40 who would qualify.
a. Using this data, test at level .01 the null hypoth-
esis that the company’s premise is correct
against the alternative that it is not correct.
b. What is the probability that when the test of
part (a) is used, the company’s premise will be
judged correct when in fact 10% of all current
customers qualify?
42. Each of a group of 20 intermediate tennis players
is given two rackets, one having nylon strings and
the other synthetic gut strings. After several weeks
of playing with the two rackets, each player will
be asked to state a preference for one of the two
types of strings. Let p denote the proportion of all
such players who would prefer gut to nylon, and
let X be the number of players in the sample who
prefer gut. Because gut strings are more expen-
sive, consider the null hypothesis that at most 50%
of all such players prefer gut. We simplify this to
H
0
: p ¼ .5, planning to reject H
0
only if sample
evidence strongly favors gut strings.
a. Which of the rejection regions {15, 16, 17, 18,
19, 20}, {0, 1, 2, 3, 4, 5}, or {0, 1, 2, 3, 17, 18,
19, 20} is most appropriate, and why are the
other two not appropriate?
b. What is the probability of a type I error for the
chosen region of part (a)? Does the region spec-
ify a level .05 test? Is it the best level .05 test?
c. If 60% of all enthusiasts prefer gut, calculate
the probability of a type II error using the
appropriate region from part (a). Repeat if
80% of all enthusiasts prefer gut.
d. If 13 out of the 20 players prefer gut, should H
0
be rejected using a significance level of .10?
43. A manufacturer of plumbing fixtures has devel-
oped a new type of washerless faucet. Let p ¼ P(a
randomly selected faucet of this type will develop
a leak within 2 years under normal use). The
manufacturer has decided to proceed with produc-
tion unless it can be determined that p is too large;
the borderline acceptable value of p is specified as
.10. The manufacturer decides to subject n of these
faucets to accelerated testing (approximating
2 years of normal use). With X ¼ the number
among the n faucets that leak before the test con-
cludes, production will commence unless the
observed X is too large. It is decided that if
p ¼ .10, the probability of not proceeding should
be at most .10, whereas if p ¼ .30 the probability
of proceeding should be at most .10. Can n ¼ 10
be used? n ¼ 20? n ¼ 25? What is the appropriate
rejection region for the chosen n, and what are the
actual error probabilities when this region is used?
44. Scientists have recently become concerned about
the safety of Teflon cookware and various food
containers because perfluorooctanoic acid (PFOA)
is used in the manufacturing process. An article in
the July 27, 2005, New York Times reported that of
600 children tested, 96% had PFOA in their blood.
According to the FDA, 90% of all Americans have
PFOA in their blood.
a. Does the data on PFOA incidence among chil-
dren suggest that the percentage of all children
who have PFOA in their blood exceeds the
FDA percentage for all Americans? Carry out
an appropriate test of hypotheses.
b. If 95% of all children have PFOA in their
blood, how likely is it that the null hypothesis
tested in (a) will be rejected when a signifi-
cance level of .01 is employed?
c. Referring back to (b), what sample size would be
necessary for the relevant probability to be .10?
9.3 Tests Concerning a Population Proportion 455

9.4
P-Values
Using the rejection region method to test hypotheses enta ils first selecting a
significance level a. Then after computing the value of the test statistic, the null
hypothesis H
0
is rejected if the value falls in the rejection region and is otherw ise
not rejected. We now consi der another way of reaching a conclusi on in a hypothesis
testing analysis. This alternative approach is based on calculation of a certain
probability called a P-value. One advantage is that the P-value provides an intuitive
measure of the strength of evidence in the data against H
0
DEFINITION
The P-value is the probability, calculated assuming that the null hypothesis is
true, of obtaining a value of the test statistic at least as contradictory to H
0
as
the value calculated from the available sample.
The definition is quite a mouthful. Here are some key points:
• The P-value is a probability.
• This probability is calculated assuming that the null hypothesi s is true.
• To determine the P-val ue, we must first decide which values of the test
statistic are at least as contradictory to H
0
as the value obtained from our sample.
Example 9.14 Urban storm water can be contaminated by many sources, including discarded
batteries. When ruptured, these batteries release metals of environmental significance.
The paper “Urban Battery Litter” (J. Environ. Engr., 2009: 46–57) presented sum-
mary data for characteristics of a variety of batteries found in urban areas around
Cleveland. A sample of 51 Panasonic AAA batteries gave a sample mean zinc mass of
2.06 g. and a sample standard deviation of .141 g. Does this data provide compelling
evidence for concluding that the population mean zinc mass exceeds 2.0 g.?
With m denoting the true average zinc mass for such batteries, the relevant
hypotheses are H
0
: m ¼ 2.0 vers us H
a
: m > 2.0. The sample size is large enough so
that a z test can be used without making any specific assumption about the shape of
the population distribution. The test statistic value is
z ¼
x 2:0
s=
ffiffiffi
n
p
¼
2:06 2:0
:141=
ffiffiffiffiffi
51
p
¼ 3:04
Now we must decide which values of z are at least as contradictory to H
0.
Let’s first
consider an easier task: Which values of
x are at least as contradictory to the null
hypothesis as 2.06, the mean of the observations in our sample? Because > appears
in H
a
, it should be clear that 2.10 is at least as contradictory to H
0
as is 2.06, so is
2.25, and so in fact is any
x value that exceeds 2.06. But an x value that exceeds 2.06
corresponds to a value of z that exceeds 3.04. Thus the P-value is
P-value ¼ PðZ 3:04 when m ¼ 2:0Þ
456 CHAPTER 9 Tests of Hypotheses Based on a Single Sample

Since the test statistic Z was created by subtracting the null value 2.0 in the
numerator, when m ¼ 2.0 (i.e., when H
0
is true) Z has approximately a standard
normal distribut ion. As a result,
P-value ¼ PðZ 3:04 when m ¼ 2:0Þ
area under the z curve to the right of 3:04
¼ 1 F 3:04ðÞ¼:0012
■
We will shortly illustrate how to determine the P -value for any z or t test; that is,
any test where the reference distribution is the sta ndard normal distribution (and z
curve) or some t distribution (and corresponding t curve). For the moment, though,
let’s focus on reaching a conclusion once the P-value is available. Because it is a
probability, the P-value must be between 0 and 1. What kinds of P-values provide
evidence against the null hypothesis? Consider two specific instances:
• P-value ¼ .250: In this case, fully 25% of all possible test statistic values are
more contradictory to H
0
than the one that came out of our sample. So our data is
not that contradictory to the null hypothesis.
• P-value ¼ .0018: Here, only .18%, much less than 1%, of all possible test
statistic values, are at least as contradictory to H
0
as wha t we obtained. Thus the
sample appears to be highly contradictory to the null hypot hesis.
More generally, the smaller the P-value, the more evidence there is in the sample
data against the null hypothesis and for the alternative hypothesis . That is,
H
0
should be rejected in favor of H
a
when the P-value is sufficiently small.
So what constitutes “sufficiently small”?
DECISION
RULE BASED
ON THE
P-VALUE
Select a significance level a (as before, the desired type I error probability).
Then reject H
0
if P-value a; do not reject H
0
if P-value > a
Thus if the P-value exceeds the chosen significance level, the null hypothesis cannot
be rejected at that level. But if the P-value is equal to or < a, then there is enough
evidence to justify rejecting H
0
. In Example 8.14, we calculated P-value ¼ .0012.
Then using a significance level of .01, we would reject the null hypothesis in favor of
the alternative hypothesis because .0012 .01. However, suppose we select a
significance level of only .001, which requires more substantial evidence from the
data before H
0
can be rejected. In this case we would not reject H
0
because
.0012 > .001.
How does the decision rule based on the P-value compare to the decision
rule employed in the rejection region approach? The two procedures —the
rejection region method and the P-value method—are in fact identical. Whatever
the conclusion reached by employing the rejection region approach with a particular
a, the same conclusion will be reached via the P-value approach using that same a.
Example 9.15 The nicotine content problem discussed in Example 9.5 involved testing H
0
:
m ¼ 1.5 versus H
a
: m > 1.5 using a z test (i.e., a test which utilizes the z curve
as the reference distribution). The inequality in H
a
implies that the upper-tailed
9.4 P-Values 457