Devore J.L., Berk K.N. Modern Mathematical Statistics with Applications
Подождите немного. Документ загружается.


CHAPTER FOURTEEN
Alternative
Approaches
to Inference
Introduction
In this final chapter we consider some inferential methods that are different in
important ways from those considered earlier. Recall that many of the confidence
intervals and test procedures developed in Chapters 9–12 were based on some sort
of a normality assumption. As long as such an assumption is at least approximately
satisfied, the actual confidence and significance levels will be at least approxi-
mately equal to the “nominal” levels, those prescribed by the experimenter through
the choice of particular
t
or
F
critical values. However, if there is a substantial
violation of the normality assumption, the actual levels may differ considerably
from the nominal levels (e.g., the use of t
.025
in a confidence interva l formula may
actually result in a confidence level of only 88% rather than the nominal 95%).
In the first three sections of this chapter, we develop distribution-free or non-
parametric procedures that are valid for a wide variety of underlying distributions
rather than being tied to normality. We have actually already introduced several
such methods: the bootstrap intervals and permutation tests are valid without
restrictive assumptions on the underlying distrib ution(s).
Section 14.4 introduces the Bayesian approach to inference. The standard
frequentist view of inference is that the parameter of interest, y, has a fixed but
unknown value. Bayesians, however, regard y as a random variable having a prior
probability distribution that incorporates whatever is known about its value. Then
to learn more about y, a sample from the conditional distribution f (x|y)is
obtained, and Bayes’ theorem is used to produce the posterior distribution of y
given the data x
1
, ... , x
n
. All Bayesian methods are based on this posterior
distribution.
J.L. Devore and K.N. Berk, Modern Mathematical Statistics with Applications, Springer Texts in Statistics,
DOI 10.1007/978-1-4614-0391-3_14,
#
Springer Science+Business Media, LLC 2012
758

14.1
The Wilcoxon Signed-Rank Test
A research chemist replicated a particular experiment a total of 10 times and obtained
the following values of reaction temperature, ordered from smallest to largest:
.57 .19 .05 .76 1.30 2.02 2.17 2.46 2.68 3.02
The distribution of reaction temperature is of course continuous. Suppose the
investigator is willing to assume that this distribution is symmetric, so that the pdf
satisfies f ð
e
m þ tÞ¼f ð
e
m tÞ for any t >0, where
e
m is the median of the distribution
(and also the mean m provided that the mean exists). This condition on f (x) simply
says that the height of the density curve above a value any particular distance to the
right of the median is the same as the height that same distance to the left of the
median. The assumption of symmetry may at first thought seem quite bold, but
remember that we have frequently assumed a normal distribution. Since a normal
distribution is symmetric, the assumption of symmetry without any additional
distributional specification is actually a weaker assumption than normality.
Let’s now consider testing the null hypothesis that
e
m ¼ 0. This amounts to
saying that a temperature of any particular magnitude, say 1.50, is no more likely
to be positive (+1.50) than to be negative (1.50). A glance at the data casts doubt
on this hypot hesis; for example, the sample median is 1.66, which is far larger in
magnitude than any of the three negative observations.
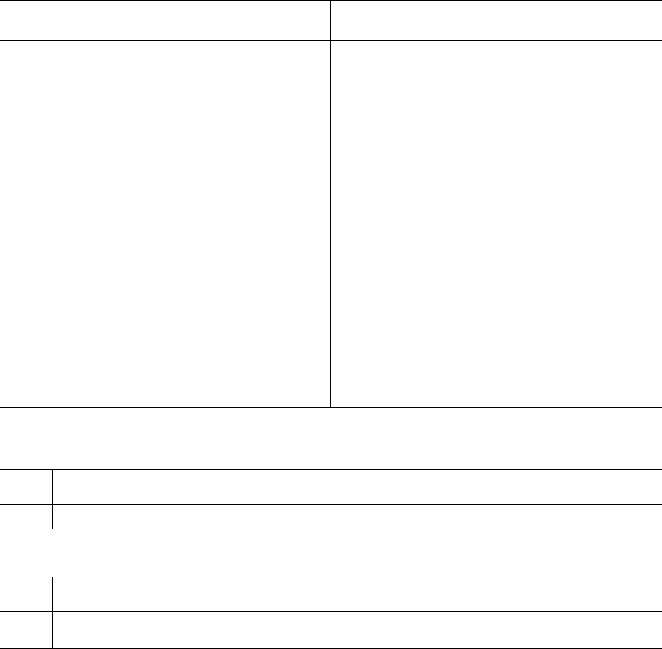
Figure 14.1 shows graphs of two symmetric pdf’s, one for which H
0
is
true and the other for which the median of the distribution considerably exceeds 0.
In the first case we expect the magnitudes of the negative observations in the
sample to be comparable to those of the positive sample observations. However,
in the second case observations of large absolute magnitude will tend to be positive
rather than negative.
For the sample of ten reaction temperatures, let’s for the moment disregard
the signs of the observations and rank the absolute magnitudes from 1 to 10, with
the smallest getting rank 1, the second smallest rank 2, and so on. Then apply the
sign of each observation to the corresponding rank (so some signed ranks will be
negative, e.g. 3, whereas others will be positive, e.g. 8). The test statistic will be
S
+
¼ the sum of the positively signed ranks.
Absolute Magnitude .05 .19 .57 .76 1.30 2.02 2.17 2.46 2.68 3.02
Rank 12345678910
Signed Rank 1 2 345678910
s
þ
¼ 4 þ 5 þ 6 þ 7 þ 8 þ 9 þ 10 ¼ 49
00
ab
Figure 14.1 Distributions for which (a)
~
m ¼ 0; (b)
~
m 0
14.1 The Wilcoxon Signed-Rank Test 759
When the median of the distribution is much greater than 0, most of the observa-
tions with large absolute magnitudes should be positive, resulting in positively
signed ranks and a large value of s
+
. On the other hand, if the median is 0,
magnitudes of positively signed observations should be intermingled with those
of negatively signed observations , in which case s
+
will not be very large. Thus
we should reject H
0
:
e
m ¼ 0 when s
+
is “quite large”— the rejection region shoul d
have the form s
+
c.
The critical value c should be chosen so that the test has a desired significance
level (type I error probability), such as .05 or .01. This necessitates finding the
distribution of the test statistic S
+
when the null hypothesis is true. Let’s consider
n ¼ 5, in which case there are 2
5
¼ 32 ways of applying signs to the five ranks 1, 2, 3,
4, and 5 (each rank could have a sign or a + sign). The key point is that when H
0
is
true, any collection of five signed ranks has the same chance as does any other
collection. That is, the smallest observation in absolute magnitude is equally likely to
be positive or negative, the same is true of the second smallest observation in absolute
magnitude, and so on. Thus the collection 1, 2, 3, 4, 5 of signed ranks is just as likely
as the collection 1, 2, 3, 4, 5, and just as likely as any one of the other 30 possibilities.
Table 14.1 lists the 32 possible signed-rank sequences when n ¼ 5 along
with the value s
+
for each sequence. This immediately gives the “null distribution”
of S
+
displayed in Table 14.2. For example, Table 14.1 shows that three of the
32 possible sequences have s
+
¼ 8, so PS
þ
¼ 8 when H
0
is trueðÞ¼1=32 þ
1=32 þ 1=32 ¼ 3=32. This null distribution appears in Table 14.2. Notice that it
Table 14.1 Possible signed-rank sequences for n ¼ 5
Sequence s
+
Sequence s
+
1 2 3 4 50 1 2 3 þ4 54
þ1 2 3 4 51 þ1 2 3 þ4 55
1 þ2 3 4 52 1 þ2 3 þ4 56
1 2 þ3 4 53 1 2 þ3 þ4 57
þ1 þ2 3 4 53 þ1 þ2 3 þ4 57
þ
1 2 þ3 4 54 þ1 2 þ3 þ4 58
1 þ2 þ3 4 55 1 þ2 þ3 þ4 59
þ1 þ2 þ3 4 56 þ1 þ2 þ3 þ4 510
1 2 3 4 þ55 1 2 3 þ4 þ59
þ1 2 3 4 þ56 þ1 2 3 þ4 þ510
1
þ2 3 4 þ57 1 þ2 3 þ4 þ511
1 2 þ3 4 þ58 1 2 þ3 þ4 þ512
þ1 þ2 3 4 þ58 þ1 þ2 3 þ4 þ512
þ1 2 þ3 4 þ59 þ1 2 þ3 þ4 þ513
1 þ2 þ3 4 þ510 1 þ2 þ3 þ4 þ514
þ1 þ
2 þ3 4 þ511 þ1 þ2 þ3 þ4 þ515
Table 14.2 Null distribution of S
+
when n ¼ 5
s
+
0 1234567
p(s
+
) 1/32 1/32 1/32 2/32 2/32 3/32 3/32 3/32
s
+
8 9 10 11 12 13 14 15
p(s
+
) 3/32 3/32 3/32 2/32 2/32 1/32 1/32 1/32
760
CHAPTER 14 Alternative Approaches to Inference

is symmetric about 7.5 [more generally, symmetrically distributed over the possible
values 0; 1; 2;:::; nnþ 1ðÞ=2]. This symmetry is important in relating the rejection
region of lower-tailed and two-tailed tests to that of an upper-tailed test.
For n ¼ 10 there are 2
10
¼ 1024 possible signed rank sequences, so a listing
would involve much effort. Each sequence, though, would have probability 1/1024
when H
0
is true, from which the distribution of S
+
when H
0
is true can be easily obtained.
We are now in a p osition to determine a rejection region for testing H
0
:
e
m ¼ 0
versus H
a
:
e
m > 0 that has a suitably small significance level a. Consider the
rejection region R ¼fs
þ
: s
þ
13g¼ 13; 14; 15
fg
. Then
a ¼ P reject H
0
when H
0
is trueðÞ
¼ PðS
þ
¼ 13; 14; or 15 when H
0
is trueÞ
¼ 1=32 þ 1=32 þ 1=32 ¼ 3=32
¼ :094
so that R ¼ {13, 14, 15} specifies a test with approximate level .1. For the rejec-
tion region {14, 15}, a ¼ 2/32 ¼ .063. For the sample x
1
¼ :58; x
2
¼ 2:50;
x
3
¼:21; x
4
¼ 1:23; x
5
¼ :97, the signed rank sequence is 1, +2, +3, +4, +5,
so s
+
¼ 14 and at level .063 H
0
would be rejected.
A General Description of the Wilcoxon Signed-Rank Test
Because the underlying distribution is assumed symmetric, m ¼
e
m, so we will state
the hypotheses of interest in terms of m rather than
e
m.
1
ASSUMPTION
X
1
, X
2
, ... , X
n
is a random sample from a continuous and symmetric
probability distribution with mean (and median) m.
When the hypothesized value of m is m
0
, the absolute differences
jx
1
m
0
; :::
jj
x
n
m
0
j, must be ranked from smallest to largest.
Null hypothesis: H
0
: m ¼ m
0
Test statistic value: s
+
¼ the sum of the ranks associated with positive (x
i
m
0
)’s
Alternative Hypothesis Rejection Region for Level a Test
H
a
: m > m
0
s
þ
c
1
H
a
: m < m
0
s
þ
c
2
½where c
2
¼ nðn þ 1Þ=2 c
1
H
a
: m 6¼ m
0
either s
þ
c or s
þ
nðn þ 1Þ=2 c
where the critical values c
1
and c obtained from Appendix Table A.12 satisfy
PðS
þ
c
1
Þa and PðS
þ
cÞa=2 when H
0
is true.
1
If the tails of the distribution are “too heavy,” as was the case with the Cauchy distribution of Chapter 7,
then m will not exist. In such cases, the Wilcoxon test will still be valid for tests concerning
e
m.
14.1 The Wilcoxon Signed-Rank Test
761

Example 14.1 A producer of breakfast cereals wants to verify that a filler machine is operating
correctly. The machine is supposed to fill one-pound boxes with 460 g, on the
average. This is a little above the 453.6 g needed for one pound. When the contents
are weighed, it is found that 15 boxes yield the following measurements:
454.4 470.8 447.5 453.2 462.6 445.0 455.9 458.2
461.6 457.3 452.0 464.3 459.2 453.5 465.8
It is believed that deviations of any magnitude from 460 g are just as likely to be
positive as negative (in accord with the symmetry assumption) but the distribution
may not be normal. Therefore, the Wilcoxon signed-rank test will be used to see if
the filler machine is calibrated correctly.
The hypotheses are H
0
: m ¼ 460 versus H
a
: m 6¼ 460, where m is the true
average weight. Subtracting 460 from each measurement gives
5.6 10.8 12.5 6.8 2.6 15.0 4.1 1.8 1.6 2.7
8.0 4.3 .8 6.5 5.8
The ranks are obtained by ordering these from smallest to largest without regard to sign.
Absolute
Magnitude .8 1.6 1.8 2.6 2.7 4.1 4.3 5.6 5.8 6.5 6.8 8.0 10.8 12.5 15.0
Rank 123456789101112131415
Sign + + + + +
Thus s
þ
¼ 2 þ 4 þ 7 þ 9 þ 13 ¼ 35. From Appendix Table A.12, PðS
þ
95Þ¼
PðS
þ
25Þ¼:024 when H
0
is true, so the two-tailed test with approximate level
.05 rejects H
0
when either s
+
95 or 25 [the exact a is 2(.024) ¼ .048]. Since
s
+
¼ 35 is not in the rejection region, it cannot be concluded at level .05 that m
differs from 460. Even at level .094 (approximately .1), H
0
cannot be rejected, since
P(S
+
30) ¼ P(S
+
90) ¼ .047 implies that s
+
values between 30 and 90 are not
significant at that level. The P-value of the data is thus >.1.
■
Although a theoretical implication of the continuity of the underlying distri-
bution is that ties will not occur, in practice they often do because of the discrete-
ness of measuring instruments. If there are several data values with the same
absolute magnitude, then they would be assigned the average of the ranks they
would receive if they differed very slightly from one another. For example, if in
Example 14.1 x
8
¼ 458.2 is changed to 458.4, then two different values of
(x
i
460) would have absolute magnitude 1.6. The ranks to be averaged would
be 2 and 3, so each would be assigned rank 2.5.
Paired Observations
When the data consisted of pairs ðX
1
; Y
1
Þ; ...; ðX
n
; Y
n
Þ and the differences
D
1
¼ X
1
Y
1
; ...; D
n
¼ X
n
Y
n
were normally distributed, in Chapter 10 we
used a paired t test for hypotheses about the expected difference m
D
. If normality
is not assumed, hypotheses about m
D
can be tested by using the Wilcoxon signed-
rank test on the D
i
’s provided that the distribution of the differences is continuous
and symmetric. If X
i
and Y
i
both have continuous distributions that differ only with
762 CHAPTER 14 Alternative Approaches to Inference

respect to their means (so the Y distribution is the X distribut ion shifted by
m
1
m
2
¼ m
D
), then D
i
will have a continuous symmetric distribution (it is not
necessary for the X and Y distributions to be symmetric individually). The null
hypothesis is H
0
: m
D
¼ D
0
, and the test statistic S
+
is the sum of the ranks
associated with the positive (D
i
D
0
)’s.
Example 14.2 About 100 years ago an experiment was done to see if drugs could help people with
severe insomnia (“The Action of Optical Isomers, II: Hyoscines,” J. Physiol., 1905:
501–510). There were 10 patients who had trouble sleeping, and each patient
tried several medications. Here we compare just the control (no medication) and
levo-hyoscine. Does the drug offer an improvement in average sleep time? The
relevant hypotheses are H
0
: m
D
¼ 0 versus H
a
: m
D
< 0. Here are the sleep times,
differences, and signed ranks.
Patient 12345678910
Control 0.6 1.1 2.5 2.8 2.9 3.0 3.2 4.7 5.5 6.2
Drug 2.5 5.7 8.0 4.4 6.3 3.8 7.6 5.8 5.6 6.1
Difference 1.9 4.6 5.5 1.6 3.4 .8 4.4 1.1 .1 .1
Signed rank 6 9 10 5 7 3 8 4 1.5 1.5
Notice that there is a tie for the lowest rank, so the two lowest ranks are split
between observations 9 and 10, and each receives rank 1.5. Appendix Table A.12
shows that for a test with significance level approximately .05, the null hypothesis
should be rejected if s
þ
10ðÞ11ðÞ=2 44 ¼ 11. The test statistic value is 1.5,
which falls in the rejection region. We therefore reject H
0
at significance level .05
in favor of the conclusion that the drug gives greater mean sleep time. The
accompanying MINITAB output shows the test statistic value and also the
corresponding P-value, which is P(S
+
1.5 when H
0
is true).
Test of median ¼ 0.000000 versus median < 0.000000
N
for Wilcoxon Estimated
N Test Statistic P Median
diff 10 10 1.5 0.005
2.250
■
Efficiency of the Wilcoxon Signed-Rank Test
When the underlying distribution being sampled is normal, either the t test or the
signed-rank test can be used to test a hypothesis about m. The t test is the best test in
such a situation because among all level a tests it is the one having minimum b.Itis
generally agreed that there are many experimental situations in which normality
can be reasonably assumed, as well as some in which it should not be. These two
questions mus t be addressed in an attempt to compare the tests:
1. When the underlying distribution is normal (the “home ground” of the t test),
how much is lost by using the signed-rank test?
2. When the underlying distribution is not normal, can a significant improvement
be achieved by using the signed-rank test?
If the Wilcoxon test does not suffer much with respect to the t test on the “home
ground” of the latter, and performs significantly better than the t test for a large number
of other distributions, then there will be a strong case for using the Wilcoxon test.
14.1 The Wilcoxon Signed-Rank Test 763

Unfortunately, there are no simple answers to the two questions. Upon
reflection, it is not surprising that the t test can perform poorly when the underlying
distribution has “heavy tails” (i. e., when observed values lying far from m are
relatively more likely than they are when the distribution is normal). This is because
the behavior of the t test depends on the sample mean and variance, which are both
unstable in the presence of heavy tails. The difficulty in producing answers to the
two questions is that b for the Wilcoxon test is very difficult to obtain and study for
any underlying distribution, and the same can be said for the t test when the
distribution is not normal. Even if b were easily obtained, any measure of efficiency
would clearly depend on which underlying distribution was assumed. A number of
different efficiency measures have been proposed by statisticians ; one that many
statisticians regard as credible is called asym ptotic relative efficiency (ARE).
The ARE of one test with resp ect to another is essentially the limiting ratio of
sample sizes necessary to obtain identical error probabiliti es for the two tests. Thus
if the ARE of one test with respect to a second equals .5, then when sam ple sizes are
large, twice as large a sample size will be required of the first test to perform as well
as the second test. Although the ARE does not characterize test performance for
small sample sizes, the following results can be shown to hold:
1. When the underlying distribution is normal, the ARE of the Wilcoxon test with
respect to the t test is approximately .95.
2. For any distribution, the ARE will be at least .86 and for many distributions will
be much greater than 1.
We can summarize these results by saying that, in large-sample problems, the
Wilcoxon test is never very much less efficient than the t test and may be much
more efficient if the underlying distribution is far from normal. Although the issue
is far from resolved in the case of sample sizes obtained in most practical problems,
studies have shown that the Wilcoxon test performs reasonably and is thus a viable
alternative to the t test.
Exercises Section 14.1 (1–8)
1. Reconsider the situation described in Exercise 32 of
Section 9.2, and use the Wilcoxon test with a ¼ .05
to test the relevant hypotheses.
2. Use the Wilcoxon test to analyze the data given in
Example 9.9.
3. The accompanying data is a subset of the data re-
ported in the article “Synovial Fluid pH, Lactate,
Oxygen and Carbon Dioxide Partial Pressure in
Various Joint Diseases” (Arthritis Rheum., 1971:
476–477). The observations are pH values of syno-
vial fluid (which lubricates joints and tendons) taken
from the knees of individuals suffering from arthri-
tis. Assuming that true average pH for non-arthritic
individuals is 7.39, test at level .05 to see whether the
data indicates a difference between average pH
values for arthritic and nonarthritic individuals.
7.02 7.35 7.34 7.17 7.28 7.77 7.09
7.22 7.45 6.95 7.40 7.10 7.32 7.14
4. A random sample of 15 automobile mechanics
certified to work on a certain type of car was
selected, and the time (in minutes) necessary for
each one to diagnose a particular problem was
determined, resulting in the following data:
30.6 30.1 15.6 26.7 27.1 25.4 35.0 30.8
31.9 53.2 12.5 23.2 8.8 24.9 30.2
Use the Wilcoxon test at significance level .10 to
decide whether the data suggests that true average
diagnostic time is less than 30 minutes.
5. Both a gravimetric and a spectrophotometric method
are under consideration for determining phosphate
content of a particular material. Twelve samples of
764
CHAPTER 14 Alternative Approaches to Inference

the material are obtained, each is split in half, and a
determination is made on each half using one of the
two methods, resulting in the following data:
Sample 1234
Gravimetric 54.7 58.5 66.8 46.1
Spectrophotometric 55.0 55.7 62.9 45.5
Sample 5678
Gravimetric 52.3 74.3 92.5 40.2
Spectrophotometric 51.1 75.4 89.6 38.4
Sample 9 101112
Gravimetric 87.3 74.8 63.2 68.5
Spectrophotometric 86.8 72.5 62.3 66.0
Use the Wilcoxon test to decide whether one tech-
nique gives on average a different value than the
other technique for this type of material.
6. The signed-rank statistic can be represented as
S
þ
¼ W
1
þ W
2
þþW
n
; where W
i
¼ i if the
sign of the x
i
m
0
with the ith largest absolute
magnitude is positive (in which case i is included
in S
+
) and W
i
¼ 0 if this value is negative (i ¼ 1, 2,
3, ... , n). Furthermore, when H
0
is true, the W
i
’s
are independent and PðW ¼ iÞ¼PðW ¼ 0Þ¼: 5.
a. Use these facts to obtain the mean and variance
of S
+
when H
0
is true. [Hint: The sum of the first
n positive integers is nðn þ 1Þ=2, and the sum of
the squares of the first n positive integers is
nðn þ 1Þð2n þ 1Þ=6.]
b. The W
i
’s are not identically distributed (e.g.,
possible values of W
2
are 2 and 0 whereas pos-
sible values of W
5
are 5 and 0), so our Central
Limit Theorem for identically distributed and
independent variables cannot be used here
when n is large. However, a more general CLT
can be used to assert that when H
0
is true and
n > 20, S
+
has approximately a normal distri-
bution with mean and variance obtained in (a).
Use this to propose a large-sample standardized
signed-rank test statistic and then an appropriate
rejection region with level a for each of the three
commonly encountered alternative hypotheses.
[Note: When there are ties in the absolute mag-
nitudes, it is still correct to standardize S
+
by
subtracting the mean from (a), but there is a
correction for the variance which can be found
in books on nonparametric statistics.]
c. A particular type of steel beam has been de-
signed to have a compressive strength (lb/in
2
)
of at least 50,000. An experimenter obtained a
random sample of 25 beams and determined the
strength of each one, resulting in the following
data (expressed as deviations from 50,000):
10 27 36 55 73 77 81
90 95 99 113 127 129 136
150 155 159 165 178 183 192
199 212 217 229
Carry out a test using a significance level of
approximately .01 to see if there is strong evi-
dence that the design condition has been violated.
7. The accompanying 25 observations on fracture
toughness of base plate of 18% nickel maraging
steel were reported in the article “Fracture Testing
of Weldments” (ASTM Special Publ. No. 381,
1965: 328–356). Suppose a company will agree to
purchase this steel for a particular application only
if it can be strongly demonstrated from experimen-
tal evidence that true average toughness exceeds
75. Assuming that the fracture toughness distribu-
tion is symmetric, state and test the appropriate
hypotheses at level .05, and compute a P-value.
[Hint: Use Exercise 6(b).]
69.5 71.9 72.6 73.1 73.3 73.5 74.1 74.2 75.3
75.5 75.7 75.8 76.1 76.2 76.2 76.9 77.0 77.9
78.1 79.6 79.7 80.1 82.2 83.7 93.7
8. Suppose that observations X
1
, X
2
, ..., X
n
are made
on a process at times 1, 2, ..., n. On the basis of this
data, we wish to test
H
0
: the X
i
’s constitute an independent and iden-
tically distributed sequence
versus
H
a
: X
i+1
tends to be larger than X
i
for i ¼ 1, ..., n
(an increasing trend)
Suppose the X
i
’s are ranked from 1 to n. Then when H
a
is true, larger ranks tend to occur later in the sequence,
whereas if H
0
is true, large and small ranks tend
to be mixed together. Let R
i
be the rank of X
i
and consider the test statistic D ¼
P
n
i¼1
ðR
i
iÞ
2
.
14.1 The Wilcoxon Signed-Rank Test 765

Then small values of D give support to H
a
(e.g., the
smallest value is 0 for R
1
¼ 1; R
2
¼ 2; :::; R
n
¼ n),
so H
0
should be rejected in favor of H
a
if d c.When
H
0
is true, any sequence of ranks has probability 1/n!.
Use this to find c for which the test has a level as close
to .10 as possible in the case n ¼ 4. [Hint: List the 4!
rank sequences, compute d for each one, and then
obtain the null distribution of D. See the Lehmann
book (in the chapter bibliography), for more infor-
mation.]
14.2
The Wilcoxon Rank-Sum Test
When at least one of the sample sizes in a two-sample problem is small, the t test
requires the assumption of normality (at least approximately). There are situations,
though, in which an investigator would want to use a test that is valid even if the
underlying distributions are quite nonnor mal. We now describe such a test, called
the Wilcoxon rank-sum test. An alternative name for the procedure is the Mann–
Whitney test, although the Mann–Whitney test statistic is sometimes expressed in a
slightly different form from that of the Wilcoxon test. The Wilcoxon test procedure
is distribution-free because it will have the desired level of significance for a very
large class of underlying distributions.
ASSUMPTIONS
X
1
, ... , X
m
and Y
1
, ... , Y
n
are two independent random samples from
continuous distributions with means m
1
and m
2
, respectively. The X and Y
distributions have the same shape and spread, the only possible difference
between the two being in the values of m
1
and m
2
.
When H
0
: m
1
m
2
¼ D
0
is true, the X distribution is shifted by the amount D
0
to the
right of the Y distribution; whe reas when H
0
is false, the shift is by an amount other
than D
0
.
Development of the Test When m ¼ 3, n ¼ 4
Let’s first test H
0
: m
1
m
2
¼ 0. If m
1
is actually much larger than m
2
, then most of
the observed x’s will fall to the right of the observed y’s. However, if H
0
is true, then
the observed values from the two samples should be intermingled. The test statistic
will provide a quantification of how much intermingling there is in the two samples.
Consider the case m ¼ 3, n ¼ 4. Then if all three observed x’s were to the
right of all four observed y’s, this would provide strong evidence for rejecting H
0
in
favor of H
a
: m
1
m
2
6¼ 0, with a similar conclusion being appropriate if all three
x’s fall below all four of the y’s. Suppose we pool the x’s and y’s into a combined
sample of size m+n¼ 7 and rank these observat ions from smallest to largest,
with the smallest receiving rank 1 and the largest, rank 7. If either most of the
largest ranks or most of the smallest ranks were associated with X observations, we
would begin to doubt H
0
. This suggests the test statistic
W ¼ the sum of the ranks in the combined sample
associated with X observations
ð14:1Þ
For the values of m and n under consideration, the smallest possible value of W is
w ¼ 1+2+3¼ 6 (if all three x’s are smaller than all four y’s), and the largest
possible value is w ¼ 5+6+7¼ 18 (if all three x ’s are larger than all four y’s).
766 CHAPTER 14 Alternative Approaches to Inference
As an example, suppose x
1
¼3.10, x
2
¼ 1.67, x
3
¼ 2.01, y
1
¼ 5.27,
y
2
¼ 1.89, y
3
¼ 3.86, and y
4
¼ .19. Then the pooled ordered sample is 3.10, .19,
1.67, 1.89, 2.01, 3.86, and 5.27. The X ranks for this sample are 1 (for 3.10), 3 (for
1.67), and 5 (for 2.01), so the computed value of W is w ¼ 1+3+5¼ 9.
The test procedure based on the statistic (14.1) is to reject H
0
if the computed
value w is “too extreme” — that is, c for an upper-tailed test, c for a lower-
tailed test, and either c
1
or c
2
for a two-tailed test. The critical constant(s) c
(c
1
,c
2
) should be chosen so that the test has the desired level of significance a.To
see how this should be done, recall that when H
0
is true, all seven observations
come from the same population. This means that under H
0
, any possible triple of
ranks associated with the three x’s — such as (1, 4, 5), (3, 5, 6), or (5, 6, 7) — has
the same probability as any other possible rank triple. Since there are
7
3
¼ 35
possible rank triples, under H
0
each rank triple has probability 1/35. From a list of
all 35 rank triples and the w value associated with each, the probability distribution
of W can immediately be determined. For exam ple, there are four rank triples that
have w value 11 — (1, 3, 7), (1, 4, 6), (2, 3, 6), and (2, 4, 5) — so P (W ¼ 11) ¼
4/35. The summary of the listing and computations appears in Table 14.3.
The distribution of Table 14.3 is symmetric about w ¼ (6 + 18)/2 ¼ 12,
which is the middle value in the ordered list of possible W values. This is because
the two rank triples (r, s, t) (with r < s < t) and (8 t,8 s,8 r) have values
of w symmetric about 12, so for each triple with w value below 12, there is a triple
with w value above 12 by the same amount.
If the alternative hypothesis is H
a
: m
1
m
2
> 0, then H
0
should be rejected
in favor of H
a
for large W values. Choosing as the rejection region the set of
W values {17, 18}, a ¼ P type I errorðÞ¼Pð reject H
0
when H
0
is trueÞ¼PðW ¼
17 or 18 when H
0
is trueÞ¼
1
35
þ
1
35
¼
2
35
¼ :057; the region {17, 18} therefore
specifies a test with level of significance approximately .05. Similarly, the region
{6, 7}, which is appropriate for H
a
: m
1
m
2
< 0, has a ¼ .057 .05. The region
{6, 7, 17, 18}, which is appropriate for the two-sided alternative, has a ¼
4
35
¼ :114.
The W value for the data given several paragraphs previously was w ¼ 9, which is
rather close to the middle value 12, so H
0
would not be rejected at any reasonable
level a for any one of the three H
a
’s.
General Description of the Rank-Sum Test
The null hypothesis H
0
: m
1
m
2
¼ D
0
is handled by subtracting D
0
from each X
i
and using the (X
i
D
0
)’s as the X
i
’s were previously used. Recalling that for any
positive integer K, the sum of the first K integers is K(K + 1)/2, the smallest
possible value of the statistic W is m(m + 1)/2, which occurs when the (X
i
D
0
)’s
are all to the left of the Y sample. The largest possible value of W occurs when the
(X
i
D
0
)’s lie entirely to the right of the Y’s; in this case, W ¼ðn þ 1Þþþ
ðm þ nÞ¼ðsum of first m þ n integersÞðsum of first n integersÞ, which gives
Table 14.3 Probability distribution of W (m ¼ 3, n ¼ 4) when H
0
is true
w 6 7 8 9 10 11 12 13 14 15 16 17 18
P(W ¼ w)
1
35
1
35
2
35
3
35
4
35
4
35
5
35
4
35
4
35
3
35
2
35
1
35
1
35
14.2 The Wilcoxon Rank-Sum Test 767