Devore J.L., Berk K.N. Modern Mathematical Statistics with Applications
Подождите немного. Документ загружается.


Example 13.9
(Example 13.8
continued)
Using
^
l ¼ 2:10, the estimated expected cell counts are computed from np
i
ð
^
lÞ,
where n ¼ 48. For example,
np
1
ð
^
lÞ¼48
e
2:1
ð2:1Þ
0
0!
¼ð48Þðe
2:1
Þ¼5:88
Similarly, np
2
ð
^
lÞ¼12:34, np
3
ð
^
lÞ¼12:96, np
4
ð
^
lÞ¼9:07, and np
5
ð
^
lÞ¼
48 5:88 9:07 ¼ 7:75. Th en
w
2
¼
ð9 5:88Þ
2
5:88
þþ
ð6 7:75Þ
2
7:75
¼ 6:31
Since m ¼ 1 and k ¼ 5, at level .05 we need w
2
:05;3
¼ 7:815 and w
2
:05;4
¼ 9:488.
Because 6.31 7.815, we do not reject H
0
; at the 5% level, the Poisson distribu-
tion provides a reasonable fit to the d ata. Notice that w
2
:10;3
¼ 6:251 and
w
2
:10;4
¼ 7:779, so at level .10 we would have to withhold judgment on whether
the Poisson distribution was appropriate.
For comparison we can with a little additional effort maximize Expres-
sion (13.7). Use of a graphing calculator gives
^
l ¼ 2:047. Because this
differs very little from 2.10, there is little change in the results. Using 2.047, we
get the estimated expected cell counts 6.197, 12.687, 12.985, 8.860, and 7.271,
and the resulting value of w
2
is 6.230. Comparing this with w
2
:05;3
¼ 7:815, we do not
reject the Poisson null hypothesis at the .05 level. Because 6.230 does not
quite exceed w
2
:10;3
¼ 6:251, we also do not reject the null hypothesis at the
10% level. ■
Sometimes even the maximum likelihood estimates based on the full sample
are quite difficult to compute. This is the case, for example, for the two-parameter
(generalized) negative binomial distribution. In such situations, method-of-
moments estimates are often used and the resulting w
2
compared to w
2
a;k1m
,
although it is not known to what extent the use of moments estimators affects the
true critical value.
Goodness of Fit for Continuous Distributions
The chi-squa red test can also be used to test whether the sample comes from a
specified family of continuous distributions, such as the exponential family or the
normal family. The choice of cells (class intervals) is even more arbitrary in the
continuous case than in the discrete case. To ensure that the chi-squared test is
valid, the cells should be chosen independe ntly of the sample observations. Once
the cells are chosen, it is almost always quite difficult to estimate unspecified
parameters (such as m and s in the normal case) from the observed cell counts, so
instead mle’s based on the full sample are computed. The critical value c
a
again
satisfies (13.8 ), and the test procedure is given by (13.9).
Example 13.10 The Institute of Nutrition of Central America and Panama (INCAP) has carried out
extensive dietary studies and research projects in Central Amer ica. In one study
reported in the November 1964 issue of the American Journal of Clinical Nutrition
(“The Blood Viscosity of Various Socioeconomic Groups in Guatemala”), serum
738 CHAPTER 13 Goodness-of-Fit Tests and Categorical Data Analysis
total cholesterol measurements for a sample of 49 low-incom e rural Indians were
reported as follows (in mg/L):
204 108 140 152 158 129 175 146 157 174 192 194 144
152 135 223 145 231 115 131 129 142 114 173 226 155
166 220 180 172 143 148 171 143 124 158 144 108 189
136 136 197 131 95 139 181 165 142 162
Is it plausible that serum cholesterol level is normally distributed for this popula-
tion? Suppose that prior to sampling, it was believed that plausible values for m
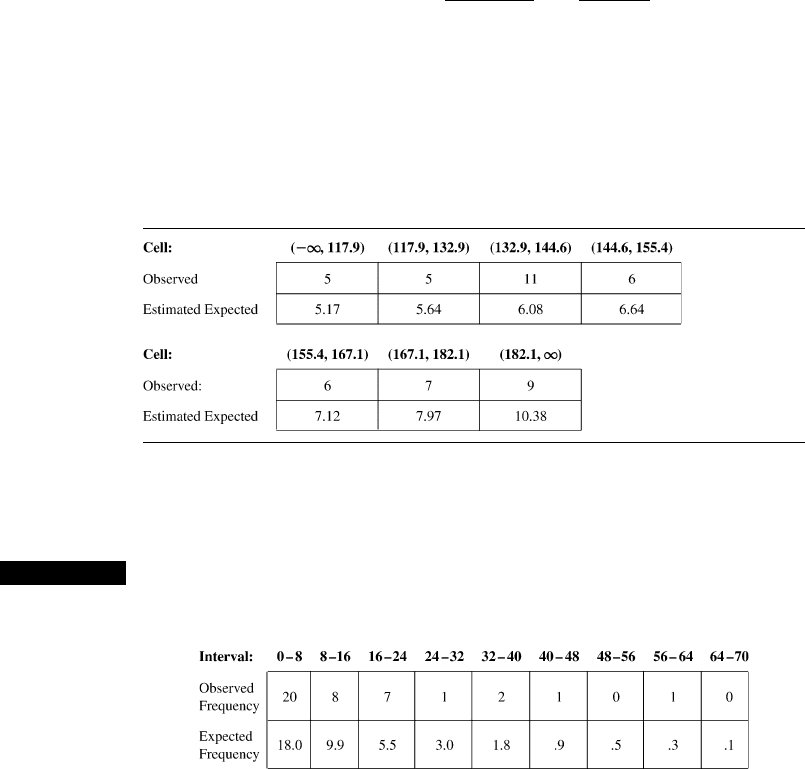
and s were 150 and 30, resp ectively. The seven equiprobable class intervals for
the standard normal distribution are (1, –1.07), (1.07, –.57), (.57, –.18),
(.18, .18), (.18, .57), (.57, 1.07), and (1.07, 1), with each endpoint also giving the
distance in standard deviations from the mean for any other normal distribution.
For m ¼ 150 and s ¼ 30, these intervals become (1, 117.9), (117.9, 132.9),
(132.9, 144.6), (144.6, 155.4), (155.4, 167.1), (167.1, 182.1), and (182.1, 1).
To obtain the estimated cell probabilities p
1
ð
^
m;
^
sÞ; ...; p
7
ð
^
m;
^
sÞ, we first need
the mle’s
^
m and
^
s.InChapter7,
^
s was shown to be ½
P
ðx
i
xÞ
2
=n
1=2
(rather than s),
so with s ¼ 31.75,
^
m ¼
x ¼ 157:02
^
s ¼
ffiffiffiffiffiffiffiffiffiffiffiffiffiffiffiffiffiffiffiffiffiffiffi
P
ðx
i
xÞ
2
n
s
¼
ffiffiffiffiffiffiffiffiffiffiffiffiffiffiffiffiffiffiffi
ðn 1Þs
2
n
r
¼ 31:42
Each p
i
ð
^
m;
^
sÞ) is then the probability that a normal rv X with mean 157.02 and
standard deviation 31.42 falls in the ith class interval. For example,
p
2
ð
^
m;
^
sÞ¼Pð117:9 X 132:9Þ¼Pð1:25 Z :77Þ¼:1150
so np
2
ð
^
m;
^
sÞ¼49 :1150ðÞ¼5:64. Observed and estimated expected cell counts are
shown in Table 13.8.
The computed w
2
is 4.60. With k ¼ 7 cells and m ¼ 2 parameters estimated,
w
2
:05;k1
¼ w
2
:05;6
¼ 12:592 and w
2
:05;k1m
¼ w
2
:05;4
¼ 9:488. Since 4.60 9.488,
a normal distribution provides quite a good fit to the data.
■
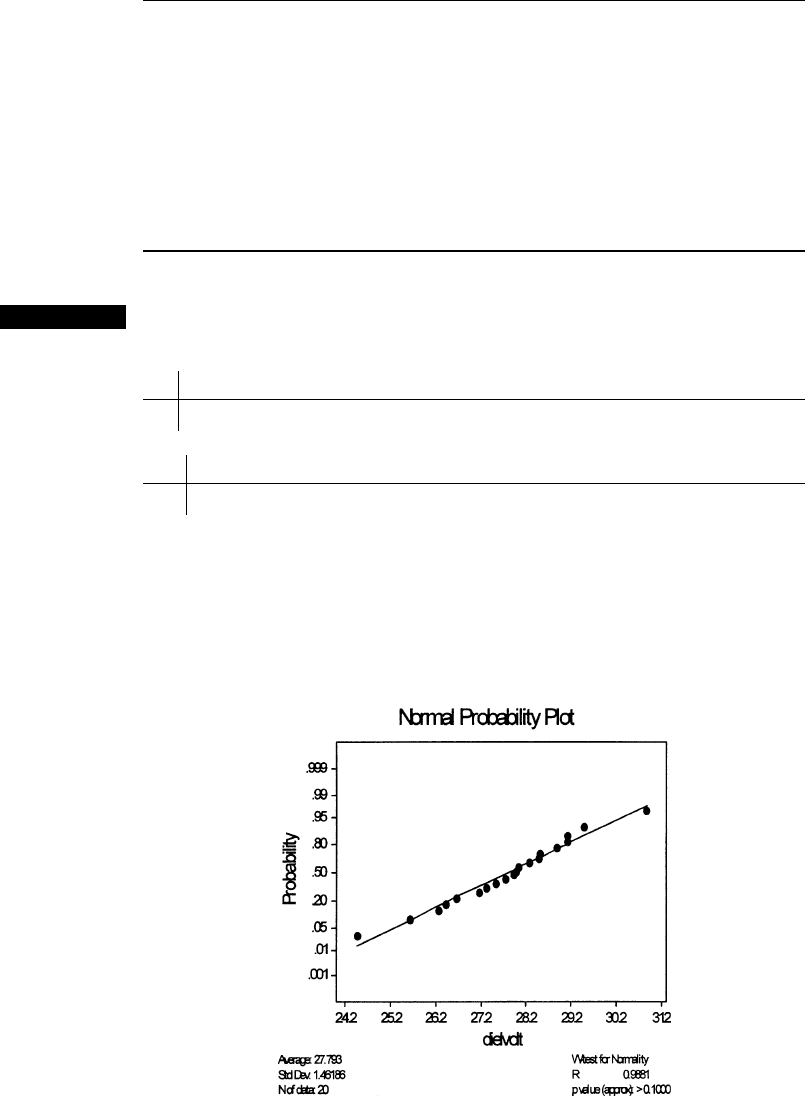
Example 13.11 The article “Some Studies on Tuft Weight Distribution in the Opening Roo m”
(Textile Res. J., 1976: 567–573) reports the accompanying data on the distribution
of output tuft weight X (mg) of cotton fibers for the input weight x
0
¼ 70.
Table 13.8 Observed and expected counts for Example 13.10
13.2 Goodness-of-Fit Tests for Composite Hypotheses 739

The authors postulated a truncated exponential distribution:
H
0
: f ðxÞ¼
le
lx
1 e
lx
0
0 x x
0
The mean of this distribution is
m ¼
ð
x
0
0
xf ðxÞdx ¼
1
l
x
0
e
lx
0
1 e
lx
0
The parameter l was estimated by replacing m by
x ¼ 13:086 and solving the
resulting equation to obtain
^
l ¼ :0742 (so
^
l is a method-of-moments estimate
and not an mle). Then with
^
l replacing l in f(x), the estimated expected cell
frequencies as displayed previously are computed as
40
^
p
i
ð
^
lÞ¼40Pða
i1
X<a
i
Þ¼40
ð
a
i
a
i1
f ð xÞdx ¼
40ðe
^
la
i1
e
^
la
i
Þ
1 e
^
lx
0
where [a
i–1
, a
i
) is the ith class interval. To obtain expected cell counts of at least 5,
the last six cells are combined to yield observed counts 20, 8, 7, 5 and expected
counts of 18.0, 9.9, 5.5, 6.6. The computed value of chi-squared is then w
2
¼ 1.34.
Because w
2
:05;2
¼ 5:992, H
0
is not rejected, so the truncated exponential model
provides a good fit.
■
A Special Test for Normality
Probability plots were introduced in Section 4.7 as an informal method for asses-
sing the plausibility of any specified population distribution as the one from which
the given sample was selected. The straighter the probability plot, the more
plausible is the distribution on which the plot is based. A normal probability plot
is used for checking whether any member of the normal distribution family is
plausible. Let’s denote the sample x
i
’s when ordered from smallest to largest by
x
(1)
, x
(2)
, ..., x
(n)
. Then the plot suggested for checking normality was a plot of the
points (x
(i)
, y
i
), where y
i
¼ F
–1
[(i – .5)/ n ].
A quantitative measure of the extent to which points cluster about a straight line
is the sample correlation coefficient r introduced in Chapter 12. Consider calculating r
for the n pairs (x
(1)
, y
1
), ...,(x
(n)
, y
n
). The y
i
’s here are not observed values in a random
sample from a y population, so properties of this r are quite different from those
described in Section 12.5. However, it is true that the more r deviates from one, the
less the probability plot resembles a straight line (remember that a probability plot
must slope upward). This idea can be extended to yield a formal test procedure: Reject
the hypothesis of population normality if r c
a
, where c
a
is a critical value chosen to
yield the desired significance level a. That is, the critical value is chosen so that when
the population distribution is actually normal, the probability of obtaining an r value
that is at most c
a
(and thus incorrectly rejecting H
0
) is the desired a. The developers of
the MINITAB statistical computer package give critical values for a ¼ .10, .05, and
.01 in combination with different sample sizes. Because no theory exists for the
distribution of r for a normal plot, the critical values are determined by computer
simulation. These critical values are based on a slightly different definition of the y
i
’s
than that given previously. The new values give slightly better approximations to the
expected values of the ordered normal observations.
MINITAB will also construct a normal probability plot based on these y
i
’s.
The plot will be almost identical in appearance to that based on the previous y
i
’s.
740 CHAPTER 13 Goodness-of-Fit Tests and Categorical Data Analysis
When there are several tied x
(i)
’
s, MINITAB computes r by using the average of the
corresponding y
i
’s as the second number in each pair.
Let y
i
¼ F
–1
[(i – .375)/(n + .25)] and compute the sample correlation coef-
ficient r for the n pairs (x
(1)
, y
1
), ...,(x
(n)
, y
n
). The Ryan–Joiner test of
H
0
: the population distributio n is normal
versus
H
a
: the population distribution is not normal
consists of rejecting H
0
when r c
a
. Critical values c
a
are give n in Appendix
Table A.11 for various significance levels a and sample sizes n.
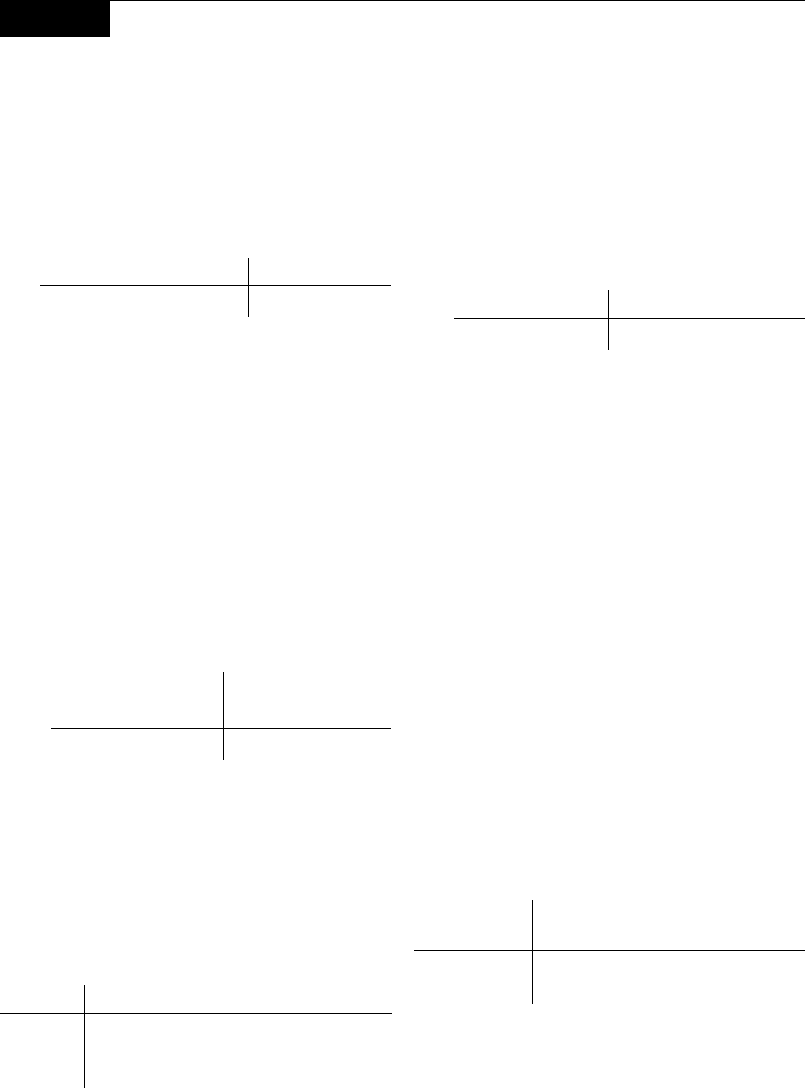
Example 13.12 The following sample of n ¼ 20 observations on dielectric breakdown voltage of a
piece of epoxy resin first appeared in Example 4.36.
y
i
1.871 1.404 1.127 .917 .742 .587 .446 .313 .186 .062
x
(i)
24.46 25.61 26.25 26.42 26.66 27.15 27.31 27.54 27.74 27.94
y
i
.062 .186 .313 .446 .587 .742 .917 1.127 1.404 1.871
x
(i)
27.98 28.04 28.28 28.49 28.50 28.87 29.11 29.13 29.50 30.88
We asked MINITAB to carry out the Ryan–Joiner test, and the result appears in
Figure 13.3. The test statistic value is r ¼ .9881, and Appendix Table A.11 gives
.9600 as the critical value that captures lower-tail area .10 under the r sampling
distribution curve when n ¼ 20 and the underlying distribution is actually normal.
Since .9881 > .9600, the null hypothesis of normality cannot be rejected even for a
significance level as large as .10.
■
Figure 13.3 MINITAB output from the Ryan–Joiner test for the data of Example 13.12
13.2 Goodness-of-Fit Tests for Composite Hypotheses 741
Exercises Section 13.2 (12–22)
12. Consider a large population of families in which
each family has exactly three children. If the
genders of the three children in any family are
independent of one another, the number of male
children in a randomly selected family will have
a binomial distribution based on three trials.
a. Suppose a random sample of 160 families
yields the following results. Test the relevant
hypotheses by proceeding as in Example 13.5.
Number of Male Children 0123
Frequency 14 66 64 16
b. Suppose a random sample of families in a
nonhuman population resulted in observed
frequencies of 15, 20, 12, and 3, respectively.
Would the chi-squared test be based on the
same number of degrees of freedom as the test
in part (a)? Explain.
13. A study of sterility in the fruit fly (“Hybrid
Dysgenesis in Drosophila melanogaster:The
Biology of Female and Male Sterility,” Genetics,
1979: 161–174) reports the following data on the
number of ovaries developed for each female fly
in a sample of size 1,388. One model for unilat-
eral sterility states that each ovary develops with
some probability p independently of the other
ovary. Test the fit of this model using w
2
.
x ¼ Number of
Ovaries Developed 012
Observed Count 1212 118 58
14. The article “Feeding Ecology of the Red-Eyed
Vireo and Associated Foliage-Gleaning Birds”
(Ecol. Monogr., 1971: 129–152) presents the
accompanying data on the variable X ¼ the num-
ber of hops before the first flight and preceded by
a flight. The author then proposed and fit a geo-
metric probability distribution [p(x) ¼ P(X ¼ x)
¼ p
x–1
· q for x ¼ 1, 2, ...,whereq ¼ 1–p]to
the data. The total sample size was n ¼ 130.
x 1 2 3 456789101112
Number
of Times x
Observed
483120965421 1 2 1
a. The likelihood is ðp
x
1
1
qÞðp
x
n
1
qÞ¼
p
Sx
i
n
q
n
. Show that the mle of p is given by
^
p ¼
P
x
i
nðÞ=
P
x
i
, and compute
^
p for the
given data.
b. Estimate the expected cell counts using
^
p of
part (a) [expected cell counts ¼ n
^
p
x1
^
q for
x ¼ 1, 2, ... ], and test the fit of the model
using a w
2
test by combining the counts for
x ¼ 7, 8, ..., and 12 into one cell (x 7).
15. A certain type of flashlight is sold with the four
batteries included. A random sample of 150
flashlights is obtained, and the number of defec-
tive batteries in each is determined, resulting in
the following data:
Number Defective 01234
Frequency 26 51 47 16 10
Let X be the number of defective batteries in a
randomly selected flashlight. Test the null hypo-
thesis that the distribution of X is Bin(4, y). That
is, with p
i
¼ P(i defectives), test
H
0
: p
i
¼
4
i
y
i
ð1 yÞ
4i
i ¼ 0; 1; 2; 3; 4
[Hint: To obtain the mle of y, write the likelihood
(the function to be maximized) as y
u
(1 – y)
v
,
where the exponents u and v are linear functions
of the cell counts. Then take the natural log,
differentiate with respect to y, equate the result
to 0, and solve for
^
y.]
16. In a genetics experiment, investigators looked at
300 chromosomes of a particular type and
counted the number of sister-chromatid
exchanges on each (“On the Nature of Sister-
Chromatid Exchanges in 5-Bromodeoxyuridine-
Substituted Chromosomes,” Genetics, 1979:
1251–1264). A Poisson model was hypothesized
for the distribution of the number of exchanges.
Test the fit of a Poisson distribution to the data by
first estimating l and then combining the counts
for x ¼ 8andx ¼ 9 into one cell.
x ¼ Number
of Exchanges
0 123456789
Observed
Counts
6 2442596244411462
17. An article in Annals of Mathematical Statistics
reports the following data on the number of
borers in each of 120 groups of borers. Does
the Poisson pmf provide a plausible model for
the distribution of the number of borers in a
group? [Hint: Add the frequencies for 7, 8, ...,
12 to establish a single category “ 7.”]
742
CHAPTER 13 Goodness-of-Fit Tests and Categorical Data Analysis
Number
of Borers
0 1 2 3 456789101112
Frequency 24 16 16 18 15 9 6 5 3 4 3 0 1
18. The article “A Probabilistic Analysis of Dissolved
Oxygen–Biochemical Oxygen Demand Relation-
ship in Streams” (J. Water Resources Control
Fed., 1969: 73–90) reports data on the rate of
oxygenation in streams at 20
C in a certain region.
The sample mean and standard deviation were
computed as
x ¼ :173 and s ¼ .066, respectively.
Based on the accompanying frequency distribu-
tion, can it be concluded that oxygenation rate is a
normally distributed variable? Use the chi-
squared test with a ¼ .05.
Rate (per day) Frequency
Below .100 12
.100–below .150 20
.150–below .200 23
.200–below .250 15
.250 or more 13
19. Each headlight on an automobile undergoing an
annual vehicle inspection can be focused either too
high (H), too low (L), or properly (N). Checking
the two headlights simultaneously (and not distin-
guishing between left and right) results in the six
possible outcomes HH, LL, NN, HL, HN,andLN.
If the probabilities (population proportions) for the
single headlight focus direction are P(H) ¼ y
1
,
P(L) ¼ y
2
,andP(N) ¼ 1–y
1
– y
2
and the two
headlights are focused independently of each
other, the probabilities of the six outcomes for a
randomly selected car are the following:
p
1
¼ y
2
1
p
2
¼ y
2
2
p
3
¼ð1 y
1
y
2
Þ
2
p
4
¼ 2y
1
y
2
p
5
¼ 2y
1
ð1 y
1
y
2
Þ
p
6
¼ 2y
2
ð1 y
1
y
2
Þ
Use the accompanying data to test the null
hypothesis
H
0
: p
1
¼ p
1
ðy
1
; y
2
Þ; :::; p
6
¼ p
6
ðy
1
; y
2
Þ
where the p
i
(y
1
, y
2
)’s are given previously.
Outcome HH LL NN HL HN LN
Frequency 49 26 14 20 53 38
[Hint: Write the likelihood as a function of y
1
and
y
2
, take the natural log, then compute @=@y
1
and
@=@y
2
, equate them to 0, and solve for
^
y
1
;
^
y
2
.]
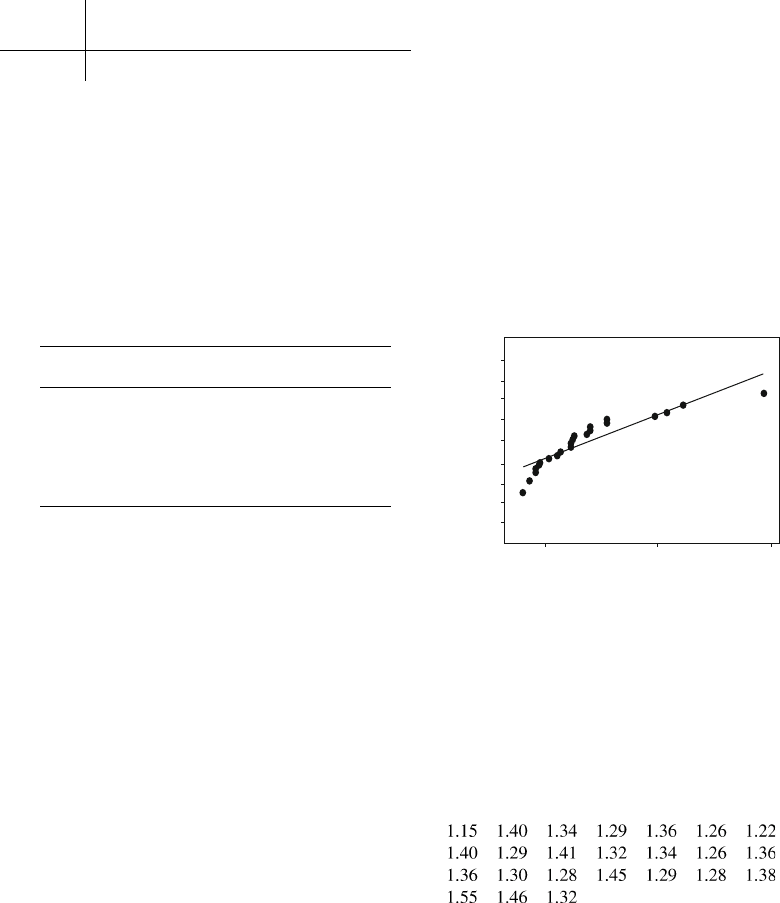
20. The article “Compatibility of Outer and Fusible
Interlining Fabrics in Tailored Garments (Textile
Res. J., 1997: 137–142) gave the following
observations on bending rigidity (mN · m) for
medium-quality fabric specimens, from which
the accompanying MINITAB output was
obtained:
24.6 12.7 14.4 30.6 16.1 9.5 31.5 17.2
46.9 68.3 30.8 116.7 39.5 73.8 80.6 20.3
25.8 30.9 39.2 36.8 46.6 15.6 32.3
.999
.99
.96
.80
.50
.20
.05
.01
.001
Probability
20 70 120
bending
West for Normality
R: 0.9116
pvalue(approx): <0.0100
Average: 37.4217
Std Dev. 25.8101
N of data: 23
Normal Probability Plot
Would you use a one-sample t confidence inter-
val to estimate true average bending rigidity?
Explain your reasoning.
21. The article from which the data in Exercise 20 was
obtained also gave the accompanying data on the
composite mass/outer fabric mass ratio for high-
quality fabric specimens.
MINITAB gave r ¼ .9852 as the value of the
Ryan– Joiner test statistic and reported that P-
value > .10. Would you use the one-sample
t test to test hypotheses about the value of the
true average ratio? Why or why not?
22. The article “Nonbloated Burned Clay Aggregate
Concrete” (J. Mater., 1972: 555–563) reports the
following data on 7 day flexural strength of
13.2 Goodness-of-Fit Tests for Composite Hypotheses 743
nonbloated burned clay aggregate concrete samples
(psi):
Test at level .10 to decide whether flexural strength is a
normally distributed variable.
13.3
Two-Way Contingency Tables
In the previous two sections, we discussed inferential problems in which the count
data was displayed in a rectangular table of cells. Each table consisted of one row
and a specified number of columns, where the columns corresponded to categories
into which the population had been divided. We now study problems in which the
data also consists of counts or frequencies, but the data table will now have I rows
(I 2) and J columns, so IJ cells. There are two commonly encountered situations
in which such data arises:
1. Th ere are I populations of interest, each corresponding to a different row of the
table, and each population is divided into the same J categor ies. A sample is
taken from the ith population (i ¼ 1, ..., I), and the counts are entered in the
cells in the ith row of the table. For example, customers of each of I ¼ 3
department store chains might have available the same J ¼ 5 payment
categories: cash, check, store credit card, Visa, and MasterCard.
2. There is a single population of interest, with each individual in the population cate-
gorized with respect to two different factors. There are I categories associated
with the first factor, and J categories associated with the second factor. A single
sample is taken, and the number of individuals belonging in both category i of factor
1 and category j of factor 2 is entered in the cell in row i, column j (i ¼ 1, ..., I;
j ¼ 1, ..., J). As an example, customers making a purchase might be classified
according to both department in which the purchase was made, with I ¼ 6
departments, and according to method of payment, with J ¼ 5asin(1)above.
Let n
ij
denote the number of individuals in the sample (s) falling in the (i, j )th cell
(row i, column j ) of the table—that is, the (i, j )th cell count. The table displaying
the n
ij
’
s is called a two-way contingency table; a prototype is shown in Table 13.9.
Table 13.9 A two-way contingency table
744 CHAPTER 13 Goodness-of-Fit Tests and Categorical Data Analysis

In situations of type 1, we want to investigate whe ther the proportions in the
different categories are the same for all populations. The null hypothesis states that
the populations are homogeneous with respect to these categories . In type 2 situa-
tions, we investigate whethe r the categories of the two factors occur independently
of each other in the population.
Testing for Homogeneity
We assume that each individual in every one of the I populations belongs in exactly
one of J categories. A sample of n
i
individuals is taken from the ith population; let
n ¼ S n
i
and
n
ij
¼ the number of individuals in the ith sample who fall into category j
n
j
¼
X
I
i¼1
n
ij
¼
the total number of individuals among
the n sampled who fall into category j
The n
ij
’s are recorded in a two-way contingency table with I rows and J columns.
The sum of the n
ij
’s in the ith row is n
i
, whereas the sum of entries in the jth column
is n
·j
.
Let
p
ij
¼
the proportion of the individuals in
population i who fall into category j
Thus, for population 1, the J proportions are p
11
, p
12
, ..., p
1J
(which sum to 1) and
similarly for the other populations. The null hypothesis of homogeneity states that
the proportion of individuals in category j is the same for each population and
that this is true for every category; that is, for every j, p
1j
¼ p
2j
¼¼p
Ij
.
When H
0
is true, we can use p
1
, p
2
, ..., p
J
to denote the population propor-
tions in the J different categories; these proportions are common to all I popula-
tions. The expected number of individuals in the ith sample who fall in the jth
category when H
0
is true is then E(N
ij
) ¼ n
i
· p
j
. To estimate E(N
ij
), we must first
estimate p
j
, the proportion in category j. Among the total sample of n individuals,
N
·j
fall into category j, so we use
^
p
j
¼ N
j
=n as the estimator (this can be shown to
be the maximum likelihood estimator of p
j
). Substitution of the estimate
^
p
j
for p
j
in
n
i
p
j
yields a simple formula for estimated expected counts under H
0
:
^
e
ij
¼ estimated expected count in cell ði; jÞ¼n
i
n
j
n
¼
ðith row total)ðjth column total)
n
ð13:10Þ
The test statistic also has the same form as in previous problem situations. The
number of degrees of freedom comes from the general rule of thumb. In each row of
Table 13.9 there are J – 1 freely determined cell counts (each sample size n
i
is
fixed), so there are a total of I(J – 1) freely determined cells. Parameters p
1
, ..., p
J
are estimated, but because Sp
i
¼ 1, only J – 1 of these are independent. Thus
df ¼ I(J –1)–(J –1)¼ (J – 1)(I – 1).
13.3 Two-Way Contingency Tables 745

Null hypothesis: H
0
: p
1j
¼ p
2j
¼¼p
Ij
j ¼ 1; 2; ...; J
Alternative hypothesis: H
a
: H
0
is not true
Test statistic value:
w
2
¼
X
all cells
ðobserved estimated expectedÞ
2
estimated expected
¼
X
I
i¼1
X
J
j¼1
ðn
ij
^
e
ij
Þ
2
^
e
ij
Rejection region: w
2
w
2
a;I1;J1
P-value information can be obtained as described in Section 13.1. The test
can safely be applied as long as
^
e
ij
5 for all cells.
Example 13.13 A company packages a particula r product in cans of three different sizes, each one
using a different production line. Most cans conform to specifications, but a quality
control engineer has identified the following reasons for nonconformance: (1)
blemish on can; (2) crack in can; (3) improper pull tab location; (4) pull tab
missing; (5) other. A sample of nonconforming units is selected from each of the
three lines, and each unit is categorized according to reason for nonconformity,
resulting in the following contingency table data:
Reason for Nonconformity
Blemish Crack Location Missing Other Sample Size
Production 1 34 65 17 21 13 150
Line 2 23 52 25 19 6 125
3 32 28 16 14 10 100
Total 89 145 58 54 29 375
Does the data suggest that the proportions falling in the various nonconformance
categories are not the same for the three lines? The parameters of interest are the
various proportions, and the relevant hypotheses are
H
0
: the production lines are homogeneous with respect to the five non-
conformance categories; that is, p
1j
¼ p
2j
¼ p
3j
for j ¼ 1, ...,5
H
a
: the production lines are not homogeneous with respect to the categories
The estimated expected frequencies (assuming homo geneity) must now be calcu-
lated. Consider the first nonconformance category for the first production line.
When the lines are homogeneous,
estimated expected number among the 150 selected units that are blemished
¼
ðfirst row total)ðfirst column total)
total of sample sizes
¼
ð150Þð189Þ
375
¼ 35:60
The contribution of the cell in the upper-left corner to w
2
is then
ðobserved estimated expected)
2
estimated expected
¼
ð34 35:60Þ
2
35:60
¼ :072
746 CHAPTER 13 Goodness-of-Fit Tests and Categorical Data Analysis
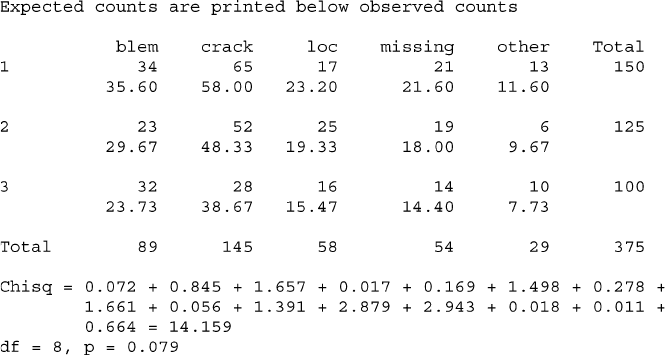
The other contributions are calculated in a similar manner. Figure 13.4 shows
MINITAB output for the chi-squared test. The observed count is the top number in
each cell, and directly below it is the estimated expected count. The contribution of
each cell to w
2
appears below the counts, and the test statistic value is w
2
¼ 14.159.
All estimated expected counts are at least 5, so combining categories is unnecessary.
The test is based on (3 – 1)(5 – 1) ¼ 8 df. Appendix Table A.10 shows that the values
that capture upper-tail areas of .08 and .075 under the 8 df curve are 14.06 and 14.26,
respectively. Thus the P-value is between .075 and .08; MINITAB gives P-value
¼ .079. The null hypothesis of homogeneity should not be rejected at the usual
significance levels of .05 or .01, but it would be rejected for the higher a of .10.
Testing for Independence
We focus now on the relationship between two different factors in a single
population. The number of categories of the first factor will be denoted by I and
the number of categories of the second factor by J. Each individual in the popula-
tion is assumed to belo ng in exactly one of the I categories associated with the first
factor and exactly one of the J categories associated with the second factor. For
example, the population of interest might consist of all individuals who regularly
watch the national news on television, with the first factor being preferred network
(ABC, CBS, NBC, PBS, CNN, or FOX, so I ¼ 6) and the second factor political
philosophy (liberal, moderate, conservative, giving J ¼ 3).
For a sample of n individuals taken from the pop ulation, let n
ij
denote the
number among the n who fall both in category i of the first factor and category j of
the second factor. The n
ij
’s can be displayed in a two-way contingency table with
I rows and J columns. In the case of homogeneity for I populations, the row totals
were fixed in advance, and only the J column totals were random. Now only the
total sample size is fixed, and both the n
i·
’s and n
·j
’s are observed values of random
variables. To state the hypotheses of interest, let
Figure 13.4 MINITAB output for the chi-squared test of Example 13.13 ■
13.3 Two-Way Contingency Tables 747