Devore J.L., Berk K.N. Modern Mathematical Statistics with Applications
Подождите немного. Документ загружается.


p
ij
¼ the proportion of individuals in the population who
belong in category i of factor 1 and category j of factor 2
¼ Pða randomly selected individual falls in both category
i of factor 1 and category j of factor 2Þ
Then
p
i
¼
X
j
p
ij
¼Pða randomly selected individual falls in category i of factor 1)
p
j
¼
X
i
p
ij
¼Pða randomly selected individual falls in category j of factor 2)
Recall that two events A and B are independent if P (A \ B) ¼ P(A)·P(B). The
null hypothesis here says that an individual’s category with respect to factor 1 is
independent of the category with respect to factor 2. In symbols, this becomes
p
ij
¼ p
i·
· p
·j
for every pair (i, j ).
The expected count in cell (i, j )isn · p
ij
,sowhenH
0
is true, E(N
ij
) ¼ n · p
i·
· p
·j
.
To obtain a chi-squared statistic, we must therefore estimate the p
i·
’s (i ¼ 1, ..., I )
and p
·j
’s ( j ¼ 1, ..., J ). The (maximum likelihood) estimates are
^
p
i
¼
n
i
n
¼ sample proportion for category i of factor 1
and
^
p
j
¼
n
j
n
¼ sample proportion for category j of factor 2
This gives estimated expec ted cell counts identical to those in the case of homo-
geneity.
^
e
ij
¼ n
^
p
i
^
p
j
¼ n
n
i
n
n
j
n
¼
n
i
n
j
n
¼
ðith row totalÞðjth column totalÞ
n
The test statistic is also identical to that used in testing for homogeneity, as is
the number of degrees of freedom. This is because the number of freely determined
cell counts is IJ – 1, sinc e only the total n is fixed in advance. There are I estimated
p
i·
’s, but only I – 1 are independently estimated since S p
i·
¼ 1, and similarly J –1
p
·j
’s are independently estimated, so I + J – two parameter s are independently
estimated. The rule of thumb now yields df ¼ IJ –1–(I + J –2)¼ IJ – I –
J +1¼ (I –1)·(J – 1).
748 CHAPTER 13 Goodness-of-Fit Tests and Categorical Data Analysis
Null hypothesis: H
0
: p
ij
¼ p
i
p
j
i ¼ 1; ...; I; j ¼ 1; ...; J
Alternative hypothesis: H
a
: H
0
is not true
Test statistic value:
w
2
¼
X
all cells
ðobserved estimated expectedÞ
2
estimated expected
¼
X
I
i¼1
X
J
j¼1
ðn
ij
^
e
ij
Þ
2
^
e
ij
Rejection region: w
2
w
2
a;ðI1ÞðJ1Þ
Again, P-value information can be obtained as described in Section 13.1.
The test can safely be applied as long as
^
e
ij
5 for all cells.
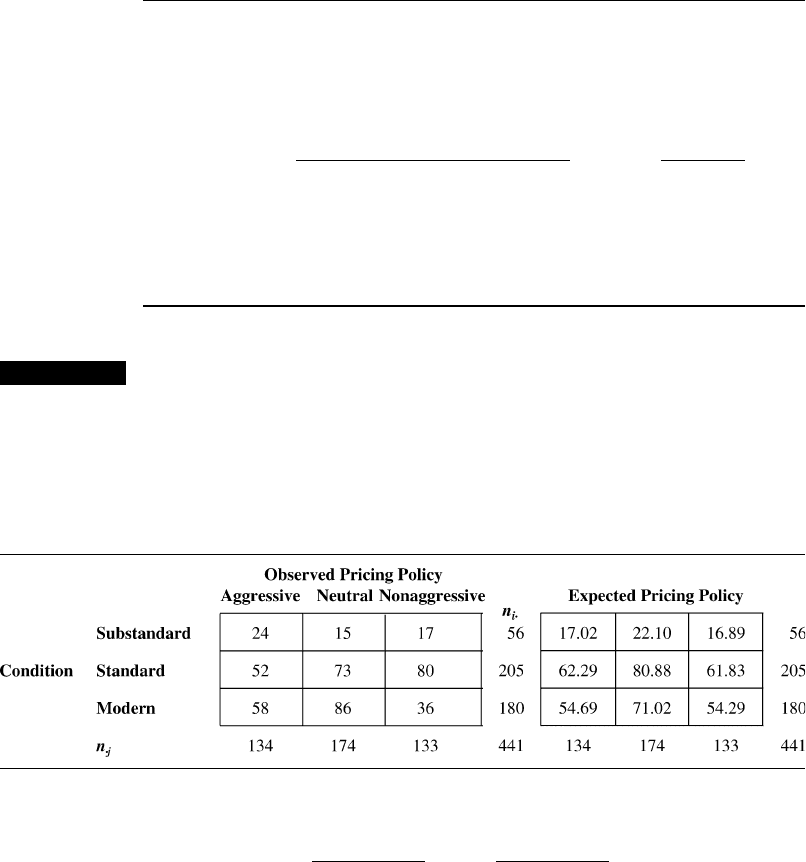
Example 13.14 A study of the relationship between facility conditions at gasoline stations and
aggressiveness in the pricing of gasoline (“An Analysis of Price Aggressiveness in
Gasoline Marketing,” J. Market. Res., 1970: 36–42) reports the accompanying data
based on a sample of n ¼ 441 stations. At level .01, does the data suggest that
facility conditions and pricing policy are independent of one another? Observed
and estimated expected counts are given in Table 13.10.
Thus
w
2
¼
ð24 17:02Þ
2
17:02
þþ
ð36 54:29Þ
2
54:29
¼ 22:47
and because w
2
:01;4
¼ 13:277, the hypothesis of independence is rejected.
We conclude that knowledge of a station’s pricing policy does give informa-
tion about the condition of facilities at the station. In particular, stations with an
aggressive pricing policy appear more likely to have substandard facilities than
stations with a neutral or nonaggressive policy.
■
Ordinal Factors and Logistic Regression
Sometimes a factor has ordinal categories, meaning that there is a natural ordering.
For example, there is a natural ordering to freshman, sophomore, junior, senior. In
such situations we can use a method that often has greater power to detect relation-
ships. Consider the case in which the first factor is ordinal and the other has two
categories. Denote by X the level of the first (ordinal) factor, the rows, which will
be the predictor in the model. Then Y designates the column, either one or two, and
Table 13.10 Observed and estimated expected counts for Example 13.14
13.3 Two-Way Contingency Tables 749
Y will be the dependent variable in the model. It is convenient for purposes of
logistic regression to label column 1 as Y ¼ 0 (failure) and column 2 as Y ¼ 1
(success), corresponding to the usual notation for binomial trials. In terms of
logistic regression, p(x) is the probability of success given that X ¼ x:
pðxÞ¼PðY ¼ 1jX ¼ xÞ¼P ðj ¼ 2ji ¼ xÞ¼
p
x2
p
x1
þ p
x2
Then the logistic model of Chapter 12 says that
e
b
0
þb
1
x
¼
pðxÞ
1 pðxÞ
¼
p
x2
p
x1
In terms of the odds of success in a row (estimated by the ratio of the two counts),
the model says that the odds change proportionally (by the fixed multiple e
b
1
) from
row to row. For example, suppose a test is given in grades 1, 2, 3, and 4 with
successes and failures as follows
Grade Failed Passed Estimated Odds
14545 1
23060 2
31872 4
41080 8
Here the model fits perfectly, with odds ratio e
b
1
¼ 2, so b
1
¼ ln(2) and b
0
¼ln(2).
In general, it should be clear that b
1
is the natural log of the odds ratio between
successive rows. If a table with I rows and 2 columns has roughly a common odds ratio
from row to row, then the logistic model should be a good fit if the rows are labeled
with consecutive integers.
We focus on the slope b
1
because the relationship between the two factors
hinges on this parameter. The hypothesis of no relationship is equivalent to H
0
:
b
1
¼ 0, which is usually tested against a two-tailed alternative.
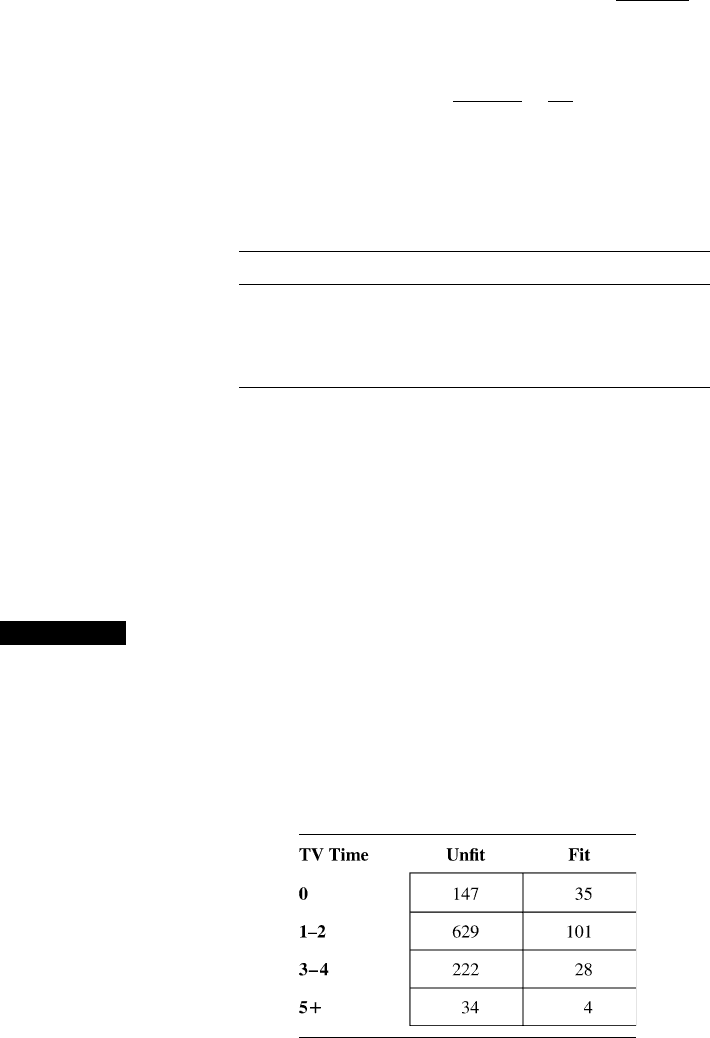
Example 13.15 Is there a relationship between TV watching and physical fitness? For an answer
we refer to the article “Television Viewing and Physical Fitness in Adults”
(Res. Quart. Exercise Sport, 1990: 315–320). Subjects were asked about their
television-viewing habits and were classified as physically fit if they scored in
the excellent or very good category on a step test. Table 13.11 shows the results in
the form of a 4 2 table. The TV column gives the hours per day
Table 13.11 TV versus fitness results
750 CHAPTER 13 Goodness-of-Fit Tests and Categorical Data Analysis
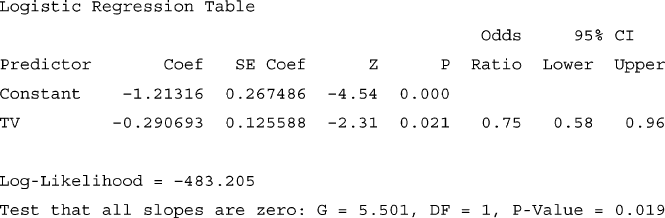
The rows need to be given specific numeric values for computational pur-
poses, and it is convenient to make these just 1, 2, 3, 4, because consecutive integers
correspond to the assumption of a common odds ratio from row to row. The
columns may need to be labeled as 0 and 1 for input to a program. The logist ic
regression results from MINITAB are shown in Figure 13.5, where the estimated
coefficient
^
b
1
for TV is given as –.29 and the odds ratio is given as .75 ¼ e
–.29
.This
means that, for each increase in TV watchi ng category, the odds of being fit decline
to about 3/4 of the previous value. There is a loss of 25% for each increment in TV.
The outpu t shows two tests for b
1
,az based on the ratio of the coefficient to
its estimated standard err or and G, which is based on a likelihood ratio test and
gives the chi-squared approximation for the difference of log likelihoods. The two
tests usually give very similar results, with G being approximately the square of z.
In this case they agree that the P-value is around .02, which means that we should
reject at the .05 level the hypothesis that b
1
¼ 0, and we can conclude that there is a
relationship between TV watching and fitness. Of course, the existence of a
relationship does not im ply anything about one causing the other. By the way, a
chi-squared test yields w
2
¼ 6.161 with 3 df, P ¼ .104, so with this test we would
not conclude that there is a relationship, even at the 10% level. There is an
advantage in using logistic regression for this kind of data.
Suppose there are two ordinal factors, each with more than two levels. This
too can be handled with logistic regression, but it requires a procedure called
ordinal logistic regression that allows an ordinal dependent variable. When one
factor is ordinal and the other is not, the analysis can be done with multinomial
(also called nominal or polytomous) logistic regression, which allows a non-ordinal
dependent variable.
Models and methods for analyzing data in which each individual is cate-
gorized with respect to three or more factors (multidimensional contingency tables)
are discusse d in several of the references in the chapter bibliography.
Figure 13.5 Logistic regression for TV versus fitness ■
13.3 Two-Way Contingency Tables 751
Exercises Section 13.3 (23–35)
23. Reconsider the Cubs data of Exercise 56
in Chapter 10. Form a 2 2 table for the data
and use a w
2
statistic to test the hypothesis of
equal population proportions. The w
2
statistic
should be the square of the z statistic in Exer-
cise 56 of Chapter 10. How are the P-values
related?
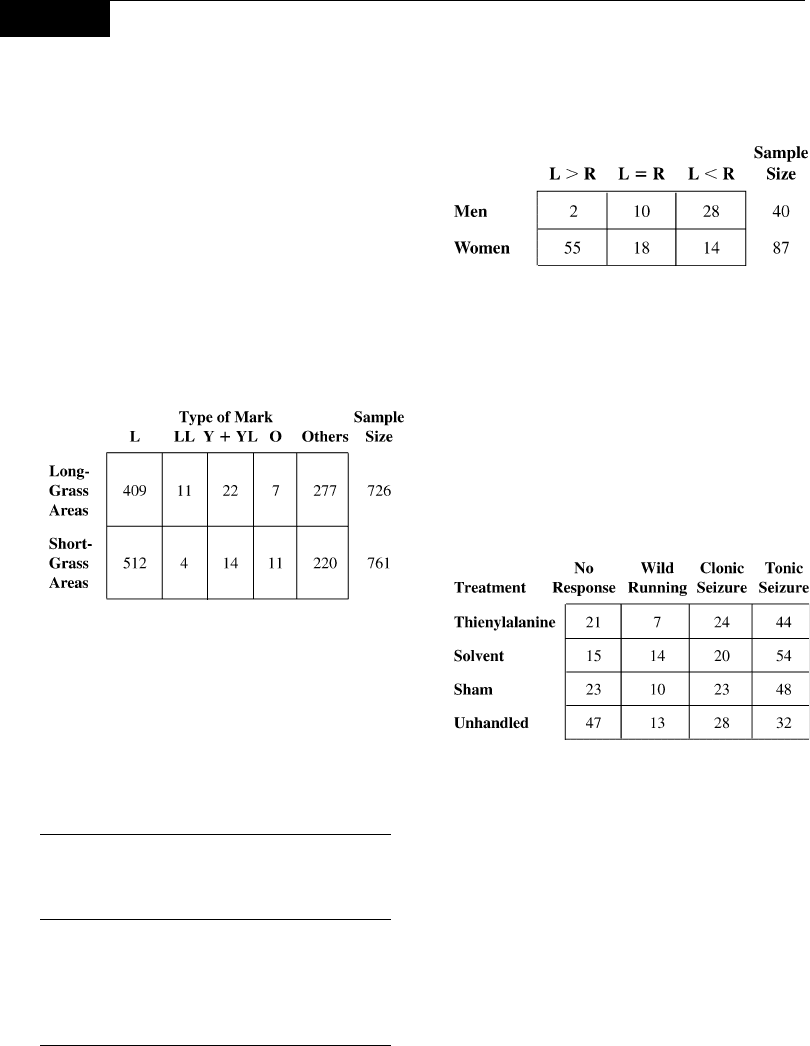
24. The accompanying data refers to leaf marks
found on white clover samples selected from
both long-grass areas and short-grass areas
(“The Biology of the Leaf Mark Polymorphism
in Trifolium repens L.,” Heredity, 1976:
306–325). Use a w
2
test to decide whether the
true proportions of different marks are identical
for the two types of regions.
25. The following data resulted from an experiment
to study the effects of leaf removal on the ability
of fruit of a certain type to mature (“Fruit Set,
Herbivory, Fruit Reproduction, and the Fruiting
Strategy of Catalpa speciosa,” Ecology, 1980:
57–64). Does the data suggest that the chance
of a fruit maturing is affected by the number of
leaves removed? State and test the appropriate
hypotheses at level .01.
Treatment
Number
of Fruits
Matured
Number
of Fruits
Aborted
Control 141 206
Two leaves removed 28 69
Four leaves removed 25 73
Six leaves removed 24 78
Eight leaves removed 20 82
26. The article “Human Lateralization from Head to
Foot: Sex-Related Factors” (Science, 1978:
1291–1292) reports for both a sample of right-
handed men and a sample of right-handed
women the number of individuals whose feet
were the same size, had a bigger left than right
foot (a difference of half a shoe size or more), or
had a bigger right than left foot.
Does the data indicate that gender has a strong
effect on the development of foot asymmetry?
State the appropriate null and alternative hypoth-
eses, compute the value of w
2
, and obtain infor-
mation about the P-value.
27. The article “Susceptibility of Mice to Audio-
genic Seizure Is Increased by Handling Their
Dams During Gestation” (Science, 1976:
427–428) reports on research into the effect of
different injection treatments on the frequencies
of audiogenic seizures.
Does the data suggest that the true percentages
in the different response categories depend on
the nature of the injection treatment? State and
test the appropriate hypotheses using a ¼ .005.
28. The accompanying data on sex combinations of
two recombinants resulting from six different
male genotypes appears in the article “A New
Method for Distinguishing Between Meiotic and
Premeiotic Recombinational Events in Drosoph-
ila melanogaster”(Genetics, 1979: 543–554).
Does the data support the hypothesis that the
frequency distribution among the three sex com-
binations is homogeneous with respect to the dif-
ferent genotypes? Define the parameters of
interest, state the appropriate H
0
and H
a
,and
perform the analysis.
752
CHAPTER 13 Goodness-of-Fit Tests and Categorical Data Analysis
Sex Combination
M/M M/F F/F
Male 135 80 39
241 84 45
333 87 31
Genotype 4 8 26 8
5 5 11 6
630 65 20
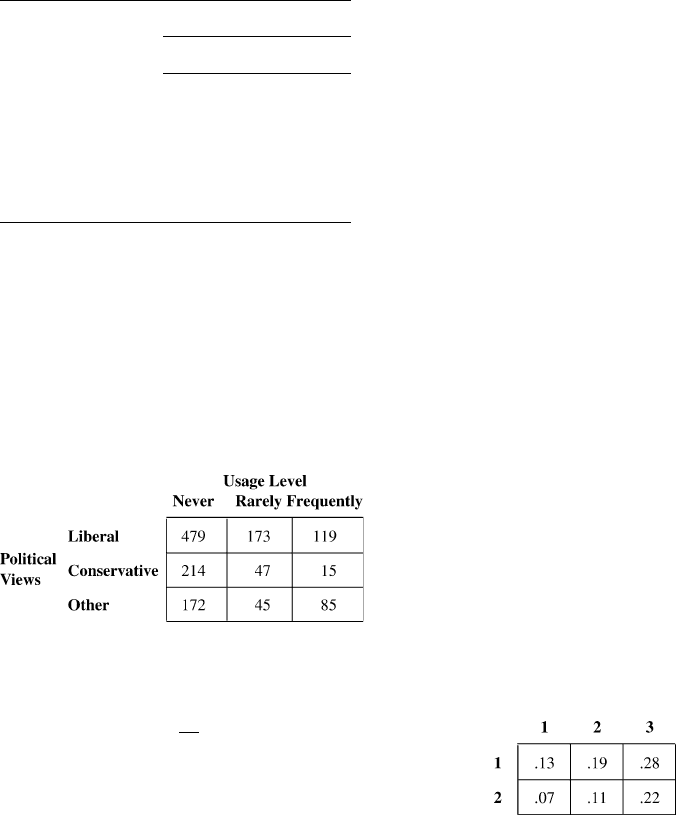
29. Each individual in a random sample of high school
and college students was cross-classified with
respect to both political views and marijuana
usage, resulting in the data displayed in the accom-
panying two-way table (“Attitudes About Mari-
juana and Political Views,” Psych. Rep., 1973:
1,051–1,054). Does the data support the hypothesis
that political views and marijuana usage level are
independent within the population? Test the appro-
priate hypotheses using level of significance .01.
30. Show that the chi-squared statistic for the test of
independence can be written in the form
w
2
¼
X
I
i¼1
X
J
j¼1
N
2
ij
^
E
ij
!
n
Why is this formula more efficient computation-
ally than the defining formula for w
2
?
31. Suppose that in Exercise 29 each student had
been categorized with respect to political views,
marijuana usage, and religious preference, with
the categories of this latter factor being Protes-
tant, Catholic, and other. The data could be dis-
played in three different two-way tables, one
corresponding to each category of the third factor.
With p
ijk
¼ P(political category i, marijuana cat-
egory j, and religious category k), the null hypoth-
esis of independence of all three factors states that
p
ijk
¼ p
i··
p
·j·
p
··k
Let n
ijk
denote the observed
frequency in cell (i, j , k). Show how to estimate
the expected cell counts assuming that H
0
is true
(
^
e
ijk
¼ n
^
p
ijk
, so the
^
p
ijk
’s must be determined).
Then use the general rule of thumb to determine
the number of degrees of freedom for the chi-
squared statistic.
32. Suppose that in a particular state consisting of four
distinct regions, a random sample of n
k
voters is
obtained from the kth region for k ¼ 1, 2, 3, 4.
Each voter is then classified according to which
candidate (1, 2, or 3) he or she prefers and accord-
ing to voter registration (1 ¼ Dem., 2 ¼ Rep.,
3 ¼ Indep.). Let p
ijk
denote the proportion of
voters in region k who belong in candidate cate-
gory i and registration category j. The null hypoth-
esis of homogeneous regions is H
0
:
p
ij1
¼ p
ij2
¼ p
ij3
¼ p
ij4
for all i, j (i.e., the propor-
tion within each candidate/registration combina-
tion is the same for all four regions). Assuming
that H
0
is true, determine
^
p
ijk
and
^
e
ijk
as functions
of the observed n
ijk
’s, and use the general rule of
thumb to obtain the number of degrees of freedom
for the chi-squared test.
33. Consider the accompanying 2 3 table displaying
the sample proportions that fell in the various com-
binations of categories (e.g., 13% of those in the
sample were in the first category of both factors).
a. Suppose the sample consisted of n ¼ 100 peo-
ple. Use the chi-squared test for independence
with significance level .10.
b. Repeat part (a) assuming that the sample size
was n ¼ 1000.
c. What is the smallest sample size n for which
these observed proportions would result in
rejection of the independence hypothesis?
34. Use logistic regression to test the relationship
between leaf removal and fruit growth in Exer-
cise 25. Compare the P-value with what was
found in Exercise 25. (Remember that w
2
1
¼ z
2
.)
Explain why you expected the logistic regression
to give a smaller P-value.
35. A random sample of 100 faculty at a university
gives the results shown below for professorial
rank versus gender.
a. Test for a relationship at the 5% level using a
chi-squared statistic.
b. Test for a relationship at the 5% level using
logistic regression.
13.3 Two-Way Contingency Tables 753

c. Compare the P-values in parts (a) and (b). Is
this in accord with your expectations? Explain.
d. Interpret your results. Assuming that today’s
assistant professors are tomorrow’s associate
professors and professors, do you see implica-
tions for the future?
Rank Male Female
Professor 25 9
Assoc Prof 20 8
Asst Prof 18 20
Supplementary Exercises (36–47)
36. The article “Birth Order and Political Success”
(Psych. Rep., 1971: 1,239–1,242) reports that
among 31 randomly selected candidates for
political office who came from families with
four children, 12 were firstborn, 11 were mid-
dleborn, and 8 were lastborn. Use this data to
test the null hypothesis that a political candidate
from such a family is equally likely to be in any
one of the four ordinal positions.
37. The results of an experiment to assess the effect
of crude oil on fish parasites are described in the
article “Effects of Crude Oils on the Gastrointes-
tinal Parasites of Two Species of Marine Fish”
(J. Wildlife Diseases, 1983: 253–258). Three
treatments (corresponding to populations in the
procedure described) were compared: (1) no con-
tamination, (2) contamination by 1–year-old
weathered oil, and (3) contamination by new
oil. For each treatment condition, a sample of
fish was taken, and then each fish was classified
as either parasitized or not parasitized. Data com-
patible with that in the article is given. Does the
data indicate that the three treatments differ with
respect to the true proportion of parasitized and
nonparasitized fish? Test using a ¼ .01.
Treatment Parasitized Nonparasitized
Control 30 3
Old oil 16 8
New oil 16 16
38. Qualifications of male and female head and
assistant college athletic coaches were compared
in the article “Sex Bias and the Validity of
Believed Differences Between Male and Female
Interscholastic Athletic Coaches” (Res. Q. Exer-
cise Sport, 1990: 259–267). Each person in ran-
dom samples of 2225 male coaches and 1141
female coaches was classified according to num-
ber of years of coaching experience to obtain the
accompanying two-way table. Is there enough
evidence to conclude that the proportions falling
into the experience categories are different for
men and women? Use a ¼ .01.
Years of Experience
Gender 1–3 4–6 7–9 10–12 13+
Male 202 369 482 361 811
Female 230 251 238 164 258
39. The authors of the article “Predicting Profes-
sional Sports Game Outcomes from Intermediate
Game Scores” (Chance, 1992: 18–22) used a chi-
squared test to determine whether there was any
merit to the idea that basketball games are not
settled until the last quarter, whereas baseball
games are over by the seventh inning. They
also considered football and hockey. Data was
collected for 189 basketball games, 92 baseball
games, 80 hockey games, and 93 football games.
The games analyzed were sampled randomly
from all games played during the 1990 season
for baseball and football and for the 1990–1991
season for basketball and hockey. For each game,
the late-game leader was determined, and then it
was noted whether the late-game leader actually
ended up winning the game. The resulting data is
summarized in the accompanying table.
Sport
Late-Game
Leader Wins
Late-Game
Leader Loses
Basketball 150 39
Baseball 86 6
Hockey 65 15
Football 72 21
The authors state, “Late-game leader is defined
as the team that is ahead after three quarters in
basketball and football, two periods in hockey,
and seven innings in baseball. The chi-square
754
CHAPTER 13 Goodness-of-Fit Tests and Categorical Data Analysis

value on three degrees of freedom is 10.52
(P < .015).”
a. State the relevant hypotheses and reach a
conclusion using a ¼ .05.
b. Do you think that your conclusion in part (a)
can be attributed to a single sport being an
anomaly?
40. The accompanying two-way frequency table
appears in the article “Marijuana Use in
College” (Youth and Society, 1979: 323–334).
Each of 445 college students was classified
according to both frequency of marijuana
use and parental use of alcohol and psychoactive
drugs. Does the data suggest that parental usage
and student usage are independent in
the population from which the sample was
drawn? Use the P-value method to reach a con-
clusion.
41. In a study of 2989 cancer deaths, the location of
death (home, acute-care hospital, or chronic-care
facility) and age at death were recorded, resulting
in the given two-way frequency table (“Where
Cancer Patients Die,” Public Health Rep., 1983:
173). Using a .01 significance level, test the null
hypothesis that age at death and location of death
are independent.
Location
Age Home Acute-Care Chronic-Care
15–54 94 418 23
55–64 116 524 34
65–74 156 581 109
Over 74 138 558 238
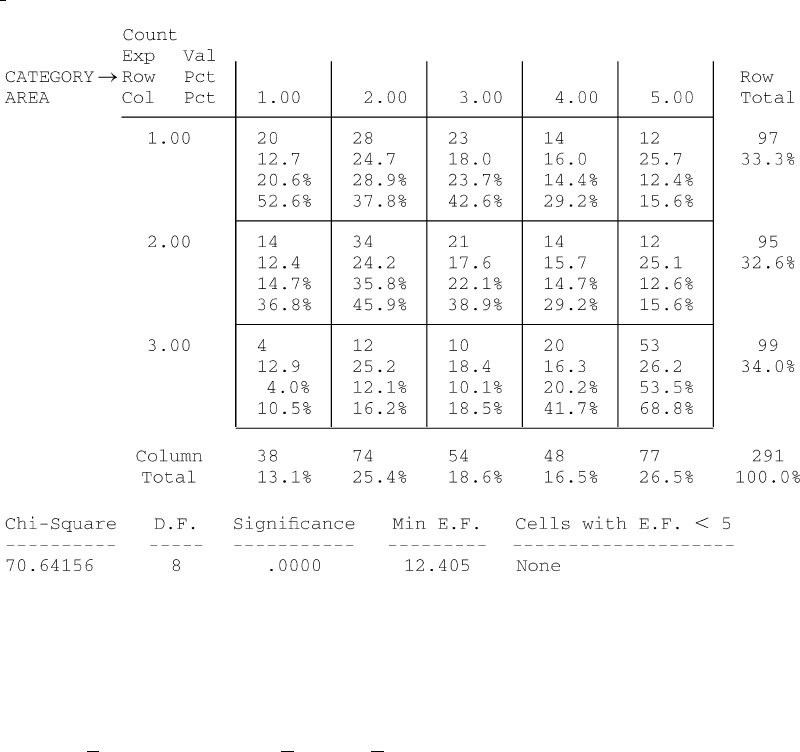
42. In a study to investigate the extent to which
individuals are aware of industrial odors in a
certain region (“Annoyance and Health Reac-
tions to Odor from Refineries and Other Indus-
tries in Carson, California,” Environ. Res., 1978:
119–132), a sample of individuals was obtained
from each of three different areas near industrial
facilities. Each individual was asked whether he
or she noticed odors (1) every day, (2) at least
once/week, (3) at least once/month, (4) less often
than once/month, or (5) not at all, resulting in the
output from SPSS on the next page. State and test
the appropriate hypotheses.
43. Many shoppers have expressed unhappiness
because grocery stores have stopped putting
prices on individual grocery items. The article
“The Impact of Item Price Removal on Grocery
Shopping Behavior” (J. Market., 1980: 73–93)
reports on a study in which each shopper in a
sample was classified by age and by whether he
or she felt the need for item pricing. Based on the
accompanying data, does the need for item pric-
ing appear to be independent of age?
Age
< 30 30–39 40–49 50–59 60
Number
in Sample
150 141 82 63 49
Number
Who Want
127 118 77 61 41
Item Pricing
44. Let p
1
denote the proportion of successes in a
particular population. The test statistic value in
Chapter 9 for testing H
0
: p
1
¼ p
10
was z ¼
ð
^
p
1
p
10
Þ=
ffiffiffiffiffiffiffiffiffiffiffiffiffiffiffiffiffi
p
10
p
20
=n
p
,wherep
20
¼ 1–p
10
.
Show that for the case k ¼ 2, the chi-squared sta-
tistic value of Section 13.1 satisfies w
2
¼ z
2
.[Hint:
First show that (n
1
– np
10
)
2
¼ (n
2
– np
20
)
2
.]
45. The NCAA basketball tournament begins with 64
teams that are apportioned into four regional tour-
naments, each involving 16 teams. The 16 teams
in each region are then ranked (seeded) from 1 to
16. During the 12-year period from 1991 to 2002,
the top-ranked team won its regional tournament
22 times, the second-ranked team won 10 times,
the third-ranked team won 5 times, and the
remaining 11 regional tournaments were won
by teams ranked lower than 3. Let P
ij
denote
the probability that the team ranked i in its region
is victorious in its game against the team ranked
j. Once the P
ij
’s are available, it is possible to
compute the probability that any particular seed
wins its regional tournament (a complicated
calculation because the number of outcomes
13.3 Supplementary Exercises 755
in the sample space is quite large). The paper
“Probability Models for the NCAA Regional
Basketball Tournaments”(Amer. Statist., 1991:
35–38) proposed several different models for
the P
ij
’s.
a. One model postulated P
ij
¼ .5 – l(i – j) with
l ¼
1
32
(from which P
16;1
¼
1
32
, P
16;2
¼
2
32
,
etc.). Based on this, P(seed #1 wins) ¼ .27477,
P(seed #2 wins) ¼ .20834, and P(seed #3
wins) ¼ .15429. Does this model appear to
provide a good fit to the data?
b. A more sophisticated model has P
ij
¼ .5 +
.2813625(z
i
– z
j
), where the z’s are measures
of relative strengths related to standard normal
percentiles [percentiles for successive highly
seeded teams are closer together than is the
case for teams seeded lower, and .2813625
ensures that the range of probabilities is the
same as for the model in part (a)]. The resulting
probabilities of seeds 1, 2, or 3 winning their
regional tournaments are .45883, .18813, and
.11032, respectively. Assess the fit of this
model.
46. Have you ever wondered whether soccer players
suffer adverse effects from hitting “headers”?
The authors of the article “No Evidence of
Impaired Neurocognitive Performance in Colle-
giate Soccer Players” (Amer. J. Sports Med.
2002: 157–162) investigated this issue from
several perspectives.
a. The paper reported that 45 of the 91 soccer
players in their sample had suffered at least one
concussion, 28 of 96 nonsoccer athletes had suf-
fered at least one concussion, and only 8 of 53
student controls had suffered at least one con-
cussion. Analyze this data and draw appropriate
conclusions.
b. For the soccer players, the sample correlation
coefficient calculated from the values of
x ¼ soccer exposure (total number of
competitive seasons played prior to enrollment
in the study) and y ¼ score on an immediate
memory recall test was r ¼–.220. Interpret this
result.
c. Here is summary information on scores on a
controlled oral word-association test for the
soccer and nonsoccer athletes:
n
1
¼ 26;
x
1
¼ 37:50; s
1
¼ 9:13;
n
2
¼ 56;
x
2
¼ 39:63; s
2
¼ 10:19
Analyze this data and draw appropriate conclu-
sions.
Crosstabulation: AREA By CATEGORY
756 CHAPTER 13 Goodness-of-Fit Tests and Categorical Data Analysis

d. Considering the number of prior nonsoccer
concussions, the values of mean SD for the
three groups were soccer players, .30 .67;
nonsoccer athletes, .49 .87; and student con-
trols, .19 .48. Analyze this data and draw
appropriate conclusions.
47. Do the successive digits in the decimal expansion
of p behave as though they were selected from a
random number table (or came from a computer’s
random number generator)?
a. Let p
0
denote the long-run proportion of digits
in the expansion that equal 0, and define p
1
, ...,
p
9
analogously. What hypotheses about these
proportions should be tested, and what is df for
the chi-squared test?
b. H
0
of part (a) would not be rejected for the
nonrandom sequence 012 ... 901 ... 901 ... .
Consider nonoverlapping groups of two digits,
and let p
ij
denote the long-run proportion of
groups for which the first digit is i and the
second digit is j. What hypotheses about these
proportions should be tested, and what is df for
the chi-squared test?
c. Consider nonoverlapping groups of 5 digits.
Could a chi-squared test of appropriate hypoth-
eses about the p
ijklm
’s be based on the first
100,000 digits? Explain.
d. The paper “Are the Digits of p an Independent
and Identically Distributed Sequence?” (Amer.
Statist., 2000: 12–16) considered the first
1,254,540 digits of p, and reported the follow-
ing P-values for group sizes of 1, ..., 5 digits:
.572, .078, .529, .691, .298. What would you
conclude?
Bibliography
Agresti, Alan, An Introduction to Categorical Data
Analysis (2nd ed.), Wiley, New York, 2007. An
excellent treatment of various aspects of categori-
cal data analysis by one of the most prominent
researchers in this area.
Everitt, B. S., The Analysis of Contingency Tables (2nd
ed.), Halsted Press, New York, 1992. A compact
but informative survey of methods for analyzing
categorical data, exposited with a minimum of
mathematics.
Mosteller, Frederick, and Richard Rourke, Sturdy Sta-
tistics, Addison-Wesley, Reading, MA, 1973. Con-
tains several very readable chapters on the varied
uses of chi-square.
Bibliography 757