FitzGerald J., Dennis A., Durcikova A. Business Data Communications and Networking
Подождите немного. Документ загружается.

HANDS-ON ACTIVITY 6C 235
(Orcelia), my router (192.168.1.1), a wireless access point
(Aironet) with two connections (into the LAN and out to
the wireless LAN), and the Indiana University VPN server
(because I had my VPN connected; Chapter 11 discusses
VPNs). You can see that all of these devices have little
utilization (under 1 percent), as well as the total number
of packets these devices have sent and received. You can
click through the other tabs in this area to see the packet
distribution.
The panel on the left of the screen shows additional
information about the types of packets, errors, and packet
sizes.
Deliverables
1. How many packets your computer can send and
receive?
2. What is the total data rate on your network?
3. What is your network utilization?
HANDS-ON ACTIVITY 6C
War-Driving and War-Walking
Wireless LANS are often not secure. It is simple to bring
your laptop computer into a public area and listen for
wireless networks. This is called War-Driving (if you
are in a car) or War-Walking (if you’re walking). As
long as you do not attempt to use any networks with-
out authorization, War-Driving and War-Walking are quite
legal. There are many good software tools available for
War-Driving. My favorites are Net Stumbler (available
from www.netstumbler.com) or Wireless NetView (avail-
able from www.nirsoft.com). Both are simple to use, yet
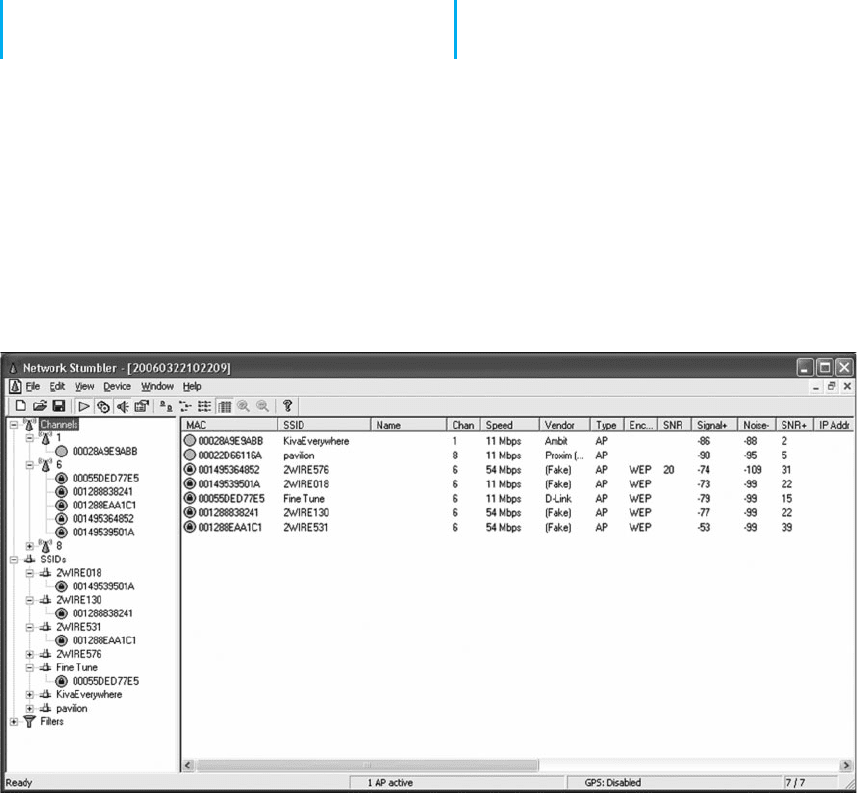
FIGURE 6.14 NetStumbler shows the networks in one downtown building
powerful. Net Stumbler historically has been the most
commonly used tool, but some users have reported prob-
lems using it on Windows 7.
The first step is to download and install the Net Stum-
bler software on a laptop computer that has wireless capa-
bility. The software is available at www.netstumbler.com.
Once you have installed the software, simply walk or
drive to a public area and start it up. Figure 6.14 shows an
example of the seven networks I discovered in my home
town of Bloomington, Indiana when I walked through one
236 CHAPTER 6 WIRED AND WIRELESS LOCAL AREA NETWORKS
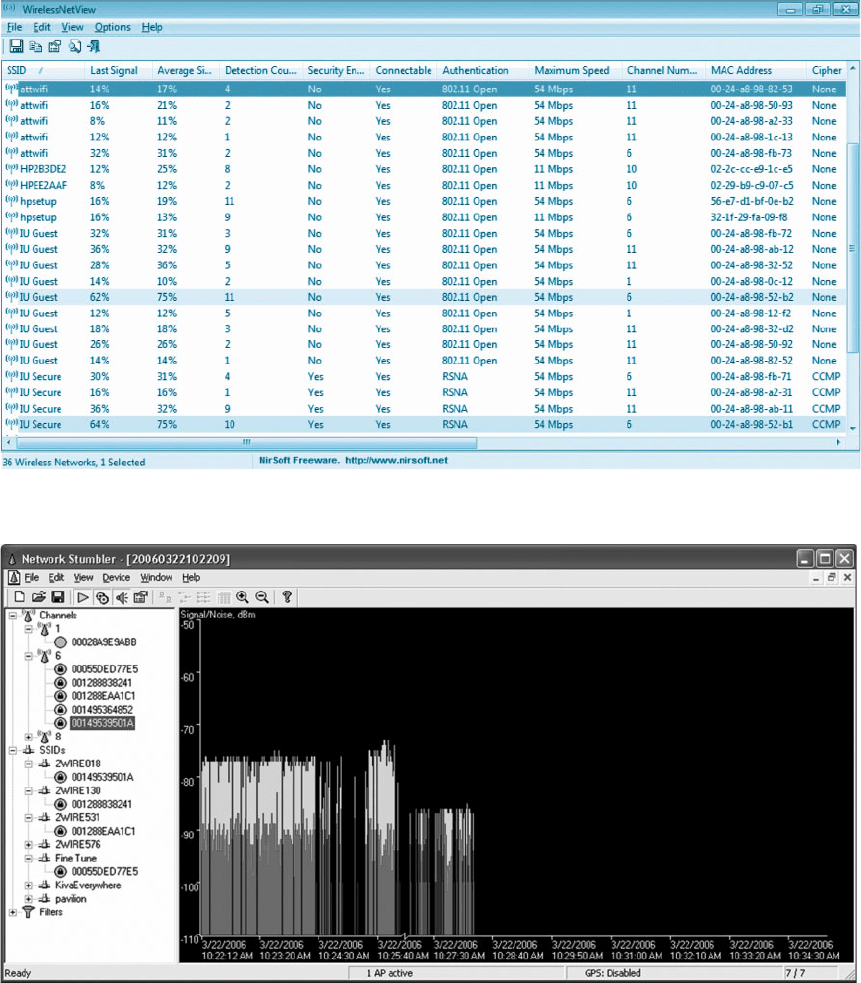
FIGURE 6.15 Wireless NetView shows the networks in Alan’s office at Indiana University
FIGURE 6.16 Changes in signal strength
HANDS-ON ACTIVITY 6C 237
building downtown using NetStumbler. For each network,
Net Stumbler displays the MAC address of the access
point (or physical address if you prefer to use that term).
It shows the SSID, the channel number the AP is con-
figured to use, the speed of the network, the access point
vendor (which can be disabled by the access point owner
to increase security), and the type of encryption in use
(if any). It also shows the signal strength both by color
coding the network (green is good) and by showing the
signal-to-noise ratio (SNR) and the strength of the signal
and the noise.
Figure 6.15 shows a similar display from Wireless
NetView when it was used in Alan’s office at Indiana
University. Wireless NetView presents the same basic
information as Net Stumbler. Notice how many networks
there are that touch this one location, although the signal
strength is too weak to be used for most of them.
In these figures, you can see a mix of WLANs, both
11 Mbps and 54 Mbps. The channels we usually use for
802.11b and 802.11g are channels 1, 6, and 11. In this
figure, you’ll see a mix of channels 1 and 6, plus one chan-
nel 8 and one channel 10 WLAN. 802.11b and 802.11g
can be configured to use four channels (1, 4, 8, and 11),
although the channels overlap to some extent. So if you
run an AP on channel 1 and another on channel 4, there
will be some interference between the two APs. The best
practice recommendation that most companies follow is
to use a three-channel configuration. In Figure 6.14, you
can see that most companies are using the three-channel
configuration, but one is not; it’s using the four-channel
configuration.
If you click on an access point in the left panel, Net
Stumbler shows you a real time graph of the signal and
noise for that network. Figure 6.16 shows how the sig-
nal strength changed for one of the networks as I walked
through the building. The left edge of the graph shows
that the network started with a good signal (the green or
light colored area at the top of the bars) was much higher
than the noise (the red or dark colored area at the bot-
tom of the bars). As I walked around, the signal became
weaker; the signal was barely higher than the noise. As I
walked more, the signal dropped so that it was too weak
for me to detect it from the noise.
Deliverables
1. Capture a snapshot for the screen having all the
information related to the various network connec-
tions that you collected during your warwalking.
2. How many networks kept the original/default
SSID? Why could this be a security problem?
3. How many networks were secure?
4. What is your overall assessment of the WLAN
usage with respect to security?
CHAPTER7
BACKBONE NETWORKS
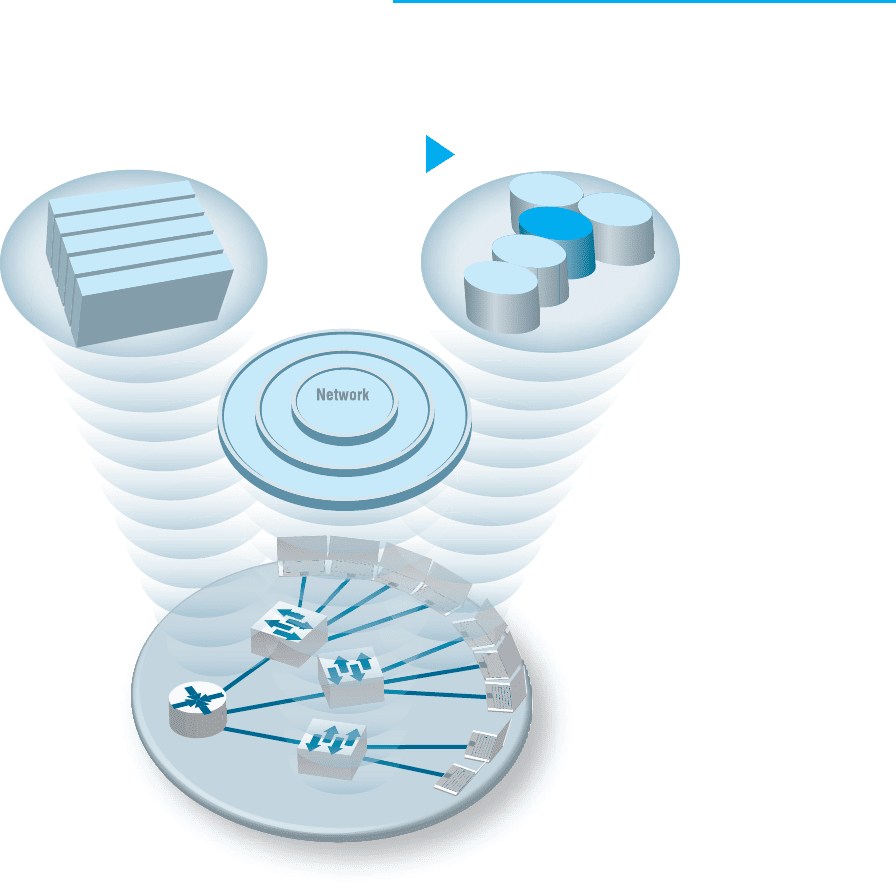
The Three Faces of Networking
The Three Faces of Networking
Fundamental Concepts Network Technologies
Backbone
Network Management
S
ecurit
y
N
e
t
w
o
r
k
D
e
s
i
g
n
N
e
t
w
o
r
k
M
a
n
a
g
e
m
e
n
t
Application layer
Network layer
Data Link layer
Physical layer
LAN
WLAN
Transport layer
Backbone
WAN
Internet

7.1 INTRODUCTION 239
THIS CHAPTER examines backbone networks (BNs) that are
used to link LANs together and to link BNs to WANs. We begin with
the various types of devices used in BNs and discuss several backbone
architectures. The chapter ends with a discussion of how to improve BN
performance and of the future of BNs.
OBJECTIVES
▲
Understand the internetworking devices used in BNs
Understand several common backbone architectures
Be familiar with gigabit Ethernet
Understand the best practice recommendations for backbone design
Be aware of ways to improve BN performance
CHAPTER OUTLINE
▲
7.1 INTRODUCTION
7.2 BACKBONE NETWORK COMPONENTS
7.2.1 Switches
7.2.2 Routers
7.2.3 Gateways
7.2.4 A Caution
7.3 BACKBONE NETWORK ARCHITECTURES
7.3.1 Backbone Architecture Layers
7.3.2 Switched Backbones
7.3.3 Routed Backbones
7.3.4 Virtual LANs
7.4 THE BEST PRACTICE BACKBONE DESIGN
7.5 IMPROVING BACKBONE PERFORMANCE
7.5.1 Improving Computer and Device
Performance
7.5.2 Improving Circuit Capacity
7.5.3 Reducing Network Demand
7.6 IMPLICATIONS FOR MANAGEMENT
7.1 INTRODUCTION
Most business organizations realize that information must be stored, retrieved, analyzed,
acted on, and shared with others at a moment’s notice. Without an enterprisewide network
or an Internet connection, moving information from one department LAN to another or
to customers is difficult.
Interconnecting the organization’s diverse networks is critical. A backbone
network (BN) is a high-speed network that connects many networks. BNs typically use
higher-speed circuits to interconnect a series of LANs and provide connections to other
BNs, MANs, WANs, and the Internet. A backbone that connects many BNs spanning
several nearby buildings for a single organization is often called a campus network.

240 CHAPTER 7 BACKBONE NETWORKS
A BN also may be called an enterprise network if it connects all networks within a
company, regardless of whether it crosses state, national, or international boundaries.
We begin this chapter by describing several commonly used devices in the BN
and then showing how those can be used to create different backbone architectures with
different performance capabilities. Backbones used to be built with special technologies,
but today most BNs use high-speed Ethernet.
7.2 BACKBONE NETWORK COMPONENTS
There are two basic components to a BN: the network cable and the hardware devices
that connect other networks to the BN. The cable is essentially the same as that used
in LANs, except that it is often fiber optic to provide higher data rates. The hardware
devices can be computers or special-purpose devices that just transfer messages from
one network to another. These include switches, routers, and gateways (Figure 7.1).
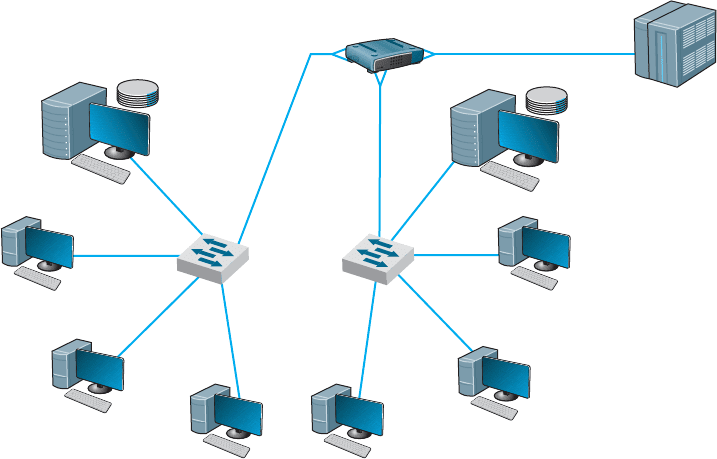
7.2.1 Switches
Most switches operate at the data link layer. They connect two or more network segments
that use the same data link and network protocol. They understand only data link layer
protocols and addresses. They may connect the same or different types of cable. These
are the same layer-2 switches discussed in Chapter 6 in that they use the data link layer
address to forward packets between network segments (Figure 7.2). They learn addresses
by reading the source and destination addresses.
7.2.2 Routers
Routers operate at the network layer. They connect two or more network segments that
use the same or different data link protocols but the same network protocol. They may
connect the same or different types of cable. Routers are the “TCP/IP gateways” that
we first introduced in Chapter 5. Routers strip off the data link layer packet, process the
network layer packet, and forward only those messages that need to go to other networks
on the basis of their network layer address (Figure 7.3).
Device
Switch
Router
Gateway
Data link layer
Network layer
Network layer
Filtered using data
link layer addresses
Routed using network
layer addresses
Routed using network
layer addresses
Same or
different
Same or
different
Same or
different
Same
Same or
different
Same or
different
Same
Same
Same or
different
Operates At Packets
Physical
Layer
Data Link
Layer
Network
Layer
FIGURE 7.1 Backbone network devices
7.2 BACKBONE NETWORK COMPONENTS 241
Switch
Switch
Server
Computer
Switch
Computer
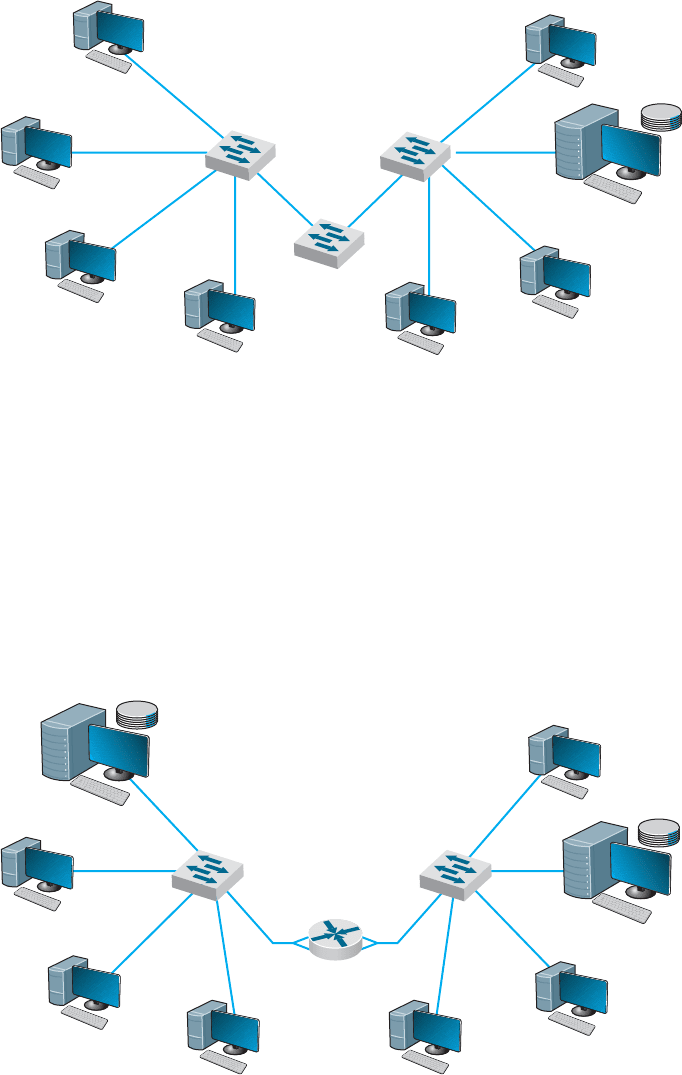
FIGURE 7.2 Use of switches to connect local area network segments
Routers may be special purpose devices or special network modules in other devices
(e.g., wireless access points for home use often include a built-in router). In general, they
perform more processing on each message than switches and therefore operate more
slowly.
One major feature of a router is that it can choose the “best” route between networks
when there are several possible routes between them. Because a router knows its own
location, as well as the packet’s final destination, it looks in a routing table to identify
thebestrouteorpath.
One other important difference between a router and a switch is that a router
processes only those messages that are specifically addressed to it. Switches process all
Switch
Router
Server
Server
Computer
Switch
Computer
FIGURE 7.3 Use of routers to connect local area networks
242 CHAPTER 7 BACKBONE NETWORKS
messages that appear on the network and forward them to the appropriate network on the
basis of their data link layer address. Switches simply forward the message unchanged to
the other network. In contrast, because routers operate at the network layer, the router’s
data link layer must first recognize that the incoming message is specifically addressed
to the router at the data link layer level before the message is passed to the network
layer for processing. The router will then process the message by building an entirely
new data link layer packet, then transmit it to the other network.
The router attempts to make no changes to the network layer packet and user data
it receives. (As noted previously, it creates a new data link layer packet.) Sometimes,
however, changes are needed, such as when the maximum data link layer packet size on
one network is different from another, which forces the router to split a message into
several smaller messages for transmission.
7.2.3 Gateways
Gateways operate at the network layer and use network layer addresses in processing
messages. Gateways are more complex than switches or routers because they are the
interface between two or more dissimilar networks. Gateways connect two or more
networks that use the same or different (usually different) data link and network protocols.
They may connect the same or different types of cable. Some gateways operate at the
application layer as well. Gateways process only those messages explicitly addressed to
them (i.e., using their data link layer address) and route those messages that need to go
to other networks (Figure 7.4).
Gateways translate one network layer protocol into another, translate data link
layer protocols, and open sessions between application programs, thus overcoming both
Server
Switch
Computer
Switch
Server
Mainframe
Gateway
Computer
FIGURE 7.4 Use of gateways to connect local area networks and a mainframe

7.3 BACKBONE NETWORK ARCHITECTURES 243
hardware and software incompatibilities. A gateway may be a stand-alone computer with
several NICs and special software or a front-end processor connected to a mainframe
computer.
Gateways used to be common, but as TCP/IP has become the dominant network
protocol, they are quickly fading from use.
7.2.4 A Caution
One warning is in order. The terminology used in the marketplace may differ substantially
from that in the preceding discussion. Many new types of switches, routers, and gateways
are being developed, so that one vendor’s “switch” may actually provide the functions
of a “router.” Layer-3 switches function in the same way as layer-2 switches discussed
previously, but they switch messages on the basis of their network layer address (usually
IP address). These switches provide the best of both switches and routers. They can be
used in place of routers but provide the benefits of traditional layer-2 switches: much
faster transmission and more simultaneously active ports than routers.
7.3 BACKBONE NETWORK ARCHITECTURES
The backbone architecture refers to the way in which the backbone interconnects the
networks attached to it and how it manages the way in which packets from one network
move through the backbone to other networks.
While there are an infinite number of ways in which network designers can build
backbone networks, there are really only three fundamental architectures that can be
combined in different ways. These architectures are routed backbones (routers that move
packets on the basis of network layer addresses), switched backbones (switches that
move packets based on data link layer addresses), and virtual LANs (switches that move
packets through LANs that are built virtually, not using physical location).
These architectures are mixed and matched to build sets of BNs. Before we discuss
these architectures, we first must discuss the way in which network designers think about
backbone designs and how to combine them; that is, the different layers of backbones
that exist in most organizations today.
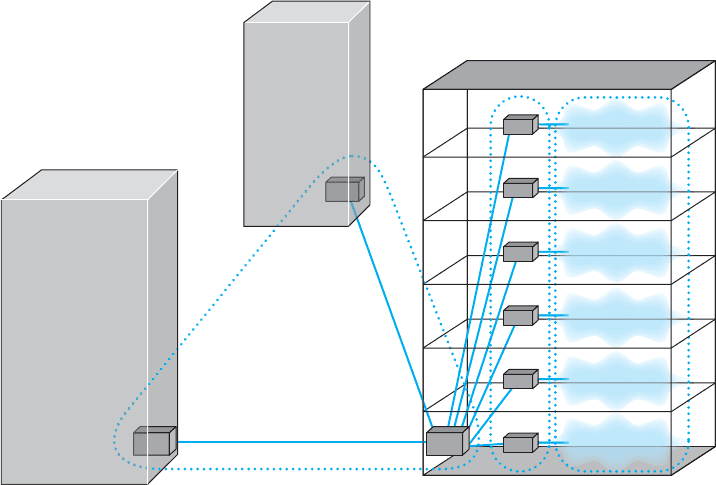
7.3.1 Backbone Architecture Layers
Network designers often think about three distinct technology layers
1
when they design
BNs. The layer closest to the users is the access layer, the technology used in the
LANs attached to the BN as described in the previous chapter (e.g., 100Base-T, wireless
Ethernet) (Figure 7.5). Although the access layer is not part of the BN, the technologies
used in the LANs (or access layer) can have major impacts on the design of the backbone.
1
Try not to confuse the five basic layers in the network model (application layer, transport layer, and so on)
with the layers of backbone technology we are describing here. They are different. We would have preferred
to use a different word than layer to describe these, but unfortunately, that is the term used in the industry.
244 CHAPTER 7 BACKBONE NETWORKS
Core Layer Distribution
Layer
Access Layer
LAN
LAN
LAN
LAN
LAN
LAN
FIGURE 7.5 Backbone network design layers. LAN = local area network
The distribution layer is the part of the backbone that connects the LANs
together. This is the part of the backbone that contains the “TCP/IP gateways” described
in Chapter 5. It usually runs throughout one building.
The core layer is the part of the backbone that connects the different BNs together,
often from building to building. The core layer is technologies used in the campus network
or the enterprise network. Some small organizations are not large enough to have a core
layer; their backbone spans only the distribution layer. Other organizations are large
enough that they have a core network at several locations that are in turn connected by
WANs.
In the sections that follow, we describe the three basic BN architectures and discuss
at which layer they are often used. We focus on TCP/IP networks when comparing
these architectures. We assume that you are comfortable with the material on TCP/IP in
Chapter 5; if you are not, you may want to go back and review the last section of the
chapter, entitled TCP/IP Example, before you continue reading.
7.3.2 Switched Backbones
Switched backbones are probably the most common type of BN used in the distribution
layer (i.e., within a building); most new building BNs designed today use switched
backbones. They also are making their way into the core layer as the campus backbone,
but routed backbones still remain common.