Kallen A. Understanding Biostatistics
Подождите немного. Документ загружается.


THE TWO-PERIOD CROSSOVER TRIAL 231
Period 1 Period 2
AP μ + τμ+ π + λ
PA μ μ + π + τ
We now compare this to a table of mean values:
Period 1 Period 2
AP a b
PA c d
We find that we have four equations and four unknowns, so we can solve for the parameters:
μ = c, τ = a − c, π = d − a, λ = b − c − d + a.
This is, however, a disappointing result. It means that when we estimate the treatment effect τ,
we only use data from the first period. That is not what we want, because it means that having
the second period was a complete waste of time. It was because we wanted to efficiently
estimate the treatment effect that we carried out the study, and in order to use the power of
the crossover study we must compare the treatment effect within each treatment sequence. In
our notation this means that we want to use a − b and d − c, and take the average of these
numbers as an estimate of τ. However,
a − b + d − c
2
= τ −
λ
2
,
so we can only use all the data to estimate τ if λ = 0. This observation has profound impli-
cations. It means that if we want to use the power of the crossover study in the analysis, we
need to make sure that there are no (differential) carry-over effects. The elimination of these
must come with the study design – if present we lose all the power of the crossover when
it comes to estimate the treatment effect, since we are forced to make the comparison as a
parallel group study instead, using first-period data only.
We therefore need to eliminate carry-over effects by design. We can, however, allow for
period effects, because we can handle them in the analysis. Or rather, we can perform the
analysis in such a way that the treatment effect is estimated independently of any period effect
(provided effects are additive). The appropriate analysis of the study is as a parallel group
study, with the two groups defined by the sequence of treatments, AP and PA. If we form the
variable Z = Y − X and compare it between the two groups, we see that for group AP the
mean value is τ + π, whereas for group PA it is τ − π. It follows that the mean difference
between the groups is 2π, so with this procedure we can estimate the size of the period effect.
A simple modification of this allows us to estimate the treatment effect: since the sum of the
two mean values is 2τ we have that, if we define a new variable as Z = Y − X for group
AP but as Z = X − Y for group PA, then the mean difference between the two groups is 2τ.
This procedure also gives us an unbiased treatment estimate in the presence of a period effect.
We can replace mean value here with any location measurement, and use the appropriate
two-group statistical method for the analysis.

232 HOW TO COMPARE THE OUTCOME IN TWO GROUPS
Example 8.6 Consider again the paired data discussed in Section 6.6, but this time assume
it is obtained in a properly randomized crossover study, in which patients with odd numbers
are randomized to the sequence AP and those with even numbers to the sequence PA. The
following table shows the mean values of the log-transformed data on the two treatments for
each sequence:
Sequence XYAverage
AP 5.12 3.15 4.13
PA 4.87 2.85 3.86
Average: 4.99 3.00 .
To get the treatment difference we compute the difference in the column averages as −1.99,
which is also the average of the differences within sequence. In other words, twice the differ-
ence is the same as the sum of the mean differences within sequence. So, forming Y − X for
the AP group and X − Y for the PA group, and statistically comparing these two groups with
a mean value test (in other words, a t-test) on the log scale, we can arrive at the estimate above
and 95% confidence limits for it. If we do that, and back-transform, we get a (geometric)
treatment mean ratio of 0.137 with 95% confidence interval (0.090, 0.209). Alternatively,
we can do a non-parametric estimation using the Hodges–Lehmann estimator for the group
difference, still on log-transformed data, to obtain a similar estimate of the treatment ratio,
namely 0.134 with 95% confidence interval (0.085, 0.215).
Note that these treatment estimates are adjusted for a possible overall period effect in
the experiment. To estimate the mean period effect we note that twice the period effect is
givenby5.12 + 2.85 −(3.15 + 4.87) =−0.05, which means that the potential period effect
is estimated to be a 2.5% increase (in geometric mean ratio).
8.8 Multivariate analysis and analysis of covariance
We now want to extend the discussion on how to compare two groups to situations where
we have more than one measurement on each subject at our disposal. Suppose there are two
measurements, X and Y , and let F (x, y) be their bivariate CDF for the first group, and G(x, y)
for the second. How do we now compare groups? There are two different questions here,
depending on the situation:
1. It may be that X and Y measure different aspects of a disease and we want to make an
effect claim by simultaneously analyzing both these variables.
2. Alternatively, it may be that X and Y measure the same outcome variable, but on
two different occasions. If X is a baseline measurement and Y is an end-of-treatment
measurement and we have a randomized study, how can we capitalize on the fact that
the population distributions of X for the two groups are the same?
Most of our discussion will be concerned with the second case, but we first need to outline
how to approach the first.
We have discussed how to extend the one-sample t-test to cover more than one variable
in Section 7.6, and the extension of this to the two-group case is done in the same way as for

MULTIVARIATE ANALYSIS AND ANALYSIS OF COVARIANCE 233
the univariate Gaussian distribution. To fix notation, assume that we have n observations of a
p-vector with a N
p
(μ
1
,
1
) distribution, and another set of m observations from an (inde-
pendent) N
p
(μ
2
,
2
) distribution. Let = μ
1
− μ
2
denote the mean difference between the
groups (which is a vector). We estimate using the difference
ˆ
in the arithmetic means of
the two distributions, for which we have that
ˆ
∈ N
p
(,
1
/n +
2
/m).
If we furthermore assume that the two groups have the same variance matrix, we can estimate
this common variance matrix with the pooled sample variance S based on f = n + m − 2
degrees of freedom. In other words,
ˆ
∈ N
p
(, (1/n + 1/m)), and the sample variance
S is an estimate of such that fS ∈
p
(f/2,/2). If we replace S with S(1/n + 1/m), it
becomes the variance estimate of
ˆ
and we have (see Appendix 7.A.2) that
f − p + 1
pf
(
ˆ
− )
t
S
−1
(
ˆ
− ) ∈ F (p, f − p + 1).
From this we can derive a confidence function for the parameter vector . The case p = 1is
the classical two-sample t-test, since F (1,f) = t
2
(f ) and the test statistic is the square of the
t-test statistic in this case.
Having disposed of this case, we now turn to the second problem above: how to use
information from a baseline measurement in the analysis of an end-point variable. For the
rest of this section we will restrict attention to the bivariate case p = 2 with one (univariate)
baseline variable X and one (univariate) end-point variable Y . This will also link into the
discussion in Section 7.3. By way of illustration we consider a data set of 21 subjects for
which a particular outcome variable was measured twice in two groups, called A and B. The
table below shows the mean values for the two groups:
Group XY
A 2.36 3.69
B 2.22 3.88
B − A 0.14 −0.19
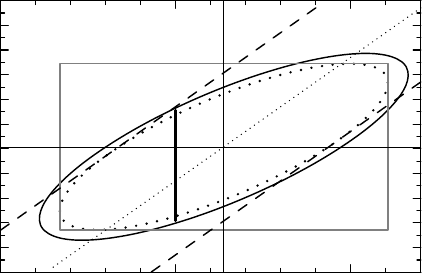
We first construct the two-dimensional confidence function above for the mean group
differences = (
1
,
2
). Its 90% contour is shown in Figure 8.8 as the solid ellipse, and
we have indicated the point estimates for the group differences as the intersection of axis-
parallel lines. The rectangle in Figure 8.8 is derived from the corresponding univariate 95%
confidence intervals, and is a confidence region for with a coverage level of at least 90%.
When we construct univariate confidence intervals we do not use this confidence function,
but the one we obtain when we replace the F(2,f − 1) distribution with the F (1,f) = t
2
(f )
distribution. Its 95% contour is shown as the dotted ellipse, and we see that it is tangential to
the rectangle close to the lower left and upper right corners.
As discussed in Section 7.3 we have a few options when we want to estimate
2
.Ifwe
only consider Y , and ignore whatever information may be stored in X, we find the estimate of
2
to be −0.192 with 95% confidence interval equal to (−0.53, 0.14). This corresponds
to the vertical side of the rectangle in Figure 8.8. The corresponding two-sided p-value
234 HOW TO COMPARE THE OUTCOME IN TWO GROUPS
−0.7
−0.6
−0.5
−0.4
−0.3
−0.2
−0.1
0
0.1
0.2
0.3
0.4
Mean difference Δ
2
of Y
−0.50.50
Mean difference Δ
1
of X
Figure 8.8 The solid curve shows the 90% simultaneous confidence region for the mean
differences of two dependent Gaussian variables. The rectangle shows the univariate 95% con-
fidence intervals and the dashed lines the univariate 95% confidence interval for the difference
2
−
1
. For the dotted curve and the vertical line segment, see the text.
for the test of equality of the means is 0.25, and is therefore not even close to being sta-
tistically significant at any conventional significance level. Another natural approach is to
make the same analysis with the change from baseline, Y − X, as outcome variable. This
means that we estimate
2
−
1
instead of
2
, but if the study is randomized, we have
1
= 0 by design, so we estimate the same parameter. This analysis gives us the estimate
−0.33 with 95% confidence interval (−0.63, −0.03). The corresponding two-sided p-value
is 0.033, within the conventional limit of 5% required to declare an effect of the drug. This
analysis is graphically illustrated in Figure 8.8 as the three oblique lines. They are given by
equations of the form
2
= θ +
1
, and their intersections with the vertical line
1
= 0
provide us with the point estimate (middle line) for the difference (θ) as well as the 95%
confidence limits (outer lines). These lines are also tangential to the dotted univariate
95% contour.
When we replace the analysis of Y with the analysis of Y − X we see that, for these
particular data, the size of the drug effect increases considerably. To understand why, note
that Y depends both on which group it was measured in and on the corresponding value
of X. A subject with a higher value at baseline is expected to have a higher value at the
end, compared to one with a lower value at baseline. The two groups differ numerically
at baseline and this mean difference in X carries over to the mean values of Y , and since
the control group had a higher mean at baseline, the mean difference of the two groups
in Y will tend toward no effect. This effect is adjusted for when we look at the increase
from baseline. But we must also take into account the effect of regression to the mean. We
made the observation in equation (7.6) that looking at the change from baseline alone may
provide a bias in the estimate of the treatment difference
2
. We know that if the average
difference at baseline is
∗
1
, then the expected mean difference, conditional on the knowledge
of the baseline data, is given by
2
− (1 −ρ)
∗
1
, where ρ is the correlation between Y
and X and we have assumed equal variance. In numbers it means that the true
2
should
be estimated from −0.33 =
2
− (1 −ρ)0.14, if we only knew ρ. A crude estimate of ρ

MULTIVARIATE ANALYSIS AND ANALYSIS OF COVARIANCE 235
from data (assuming no group difference) is around 0.70, which gives an estimate of
2
of
approximately −0.29.
In order to make this mathematically robust, return first to Figure 8.8. There is a vertical
interval indicated over
1
= 0. This is not derived from some intersection with the 90%
contour line, contrary to appearances. The interval shows the confidence interval for
2
in
a situation wherew we know that
1
= 0, and we wish to understand how it is derived. The
difference between this and the examples above is that there we considered functions of ,
but now we put a constraint on , namely that
1
= 0. Instead of being a problem with
one parameter of interest and one nuisance parameter, a constraint reduces the problem to
a one-parameter problem. In order to see how that changes the picture, recall first that the
contour lines are levels of the quadratic form
Q(
ˆ
) = (
ˆ
− )
t
S
−1
(
ˆ
− ),
but considered as a function of , with the estimate
∗
replacing the estimator
ˆ
. (Explicitly,
Q() = ( −
∗
)
t
S
−1
( −
∗
), with similar expressions for the components below.) We
can decompose Q(
ˆ
)as
Q(
ˆ
) = Q
1
(
ˆ
1
) + Q
2.1
(
ˆ
2
|
ˆ
1
),
where
Q
1
(
ˆ
1
) =
(
ˆ
1
−
1
)
2
S
11
,Q
2.1
(
ˆ
2
|
ˆ
1
) =
(
ˆ
2
−
2
−
S
12
S
11
(
ˆ
1
−
1
))
2
S
2.1
,
with S
2.1
= S
22
− S
2
12
/S
11
, a notation we also use for .
We first assume that is known, so that we can take S = above. That allows us to
highlight what is going on in a first step, before we can address some mathematical com-
plications in the general case. When is known (and we take S = ), Q(
ˆ
) has a χ
2
(2)
distribution, because it is the sum of two independent χ
2
(1)-distributed variables, Q
1
(
ˆ
1
)
and Q
2.1
(
ˆ
2
|
ˆ
1
). Since linear combinations of Gaussian variables, dependent or otherwise,
also are Gaussian, we have that
ˆ
2
−
12
11
ˆ
1
∈ N
2
−
12
11
1
,
2.1
.
The counterpart to the confidence function above would now be χ
2
(Q()). However, if we
know that
1
= 0, the term Q
1
(
1
) is only noise, and addresses a question we are not
interested in. We therefore focus exclusively on the second quadratic form and consider the
confidence function χ
1
(Q
2.1
(
2
|
1
)). When the first quadratic term is pure noise, these two
confidence functions should provide similar results, but the latter should be more efficient.
This constitutes the overall explanation of the difference between what we see in Figure 8.8
and what we actually do.
However, when is not known but estimated with S as above, there are some further
mathematical complications. These are concerned with the actual distribution of Q
2.1
(
ˆ
2
|
ˆ
1
),
which is now less straightforward. That general theory of multivariate Gaussian distributions
tells us the following two facts, both of which refer to conditional distributions given the
236 HOW TO COMPARE THE OUTCOME IN TWO GROUPS
values of
ˆ
1
and S
11
:
ˆ
2
−
S
12
S
11
ˆ
1
∈ N
2
−
12
11
1
, (1 + Q
1
(
ˆ
1
)/f )
2.1
and
S
2.1
2.1
∈ χ
2
(f − 1).
Moreover, conditionally on
ˆ
1
and S
11
, these are independent, and it follows that
f − 1
f
Q
2.1
(
ˆ
2
|
ˆ
1
)
1 + Q
1
(
ˆ
1
)/f
∈ F(1,f − 1) = t
2
(f − 1).
This corresponds to the χ
2
(1) distribution of Q
2.1
(
ˆ
2
|
ˆ
1
) above, and gives us the appropriate
confidence function for
2
. When we use this to obtain a confidence interval for
2
,we
say that we perform an unconditional test; what the corresponding conditional test is will be
described below.
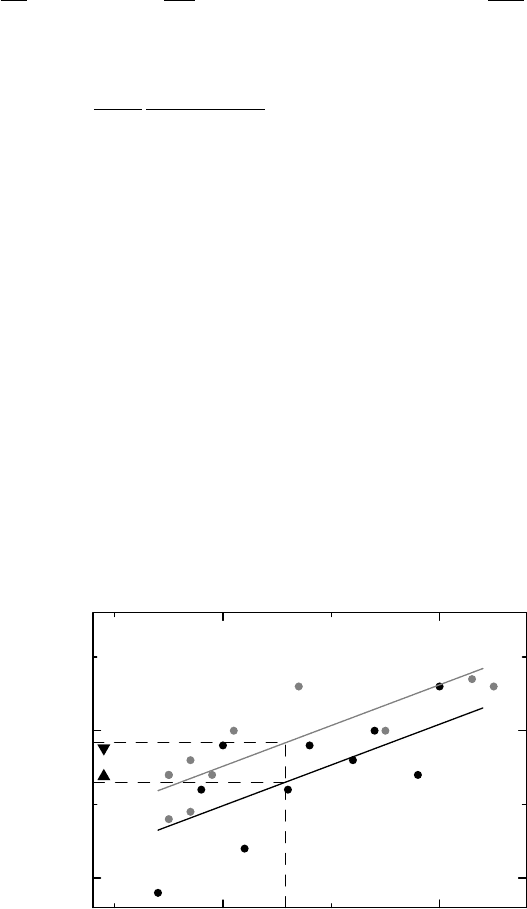
The analysis is illustrated graphically in Figure 8.9. Gray dots refer to the data in group A
and black dots to the data in group B, and there are two straight lines describing the estimate of
the conditional mean function E(Y |X = x) = ¯x + b(x − ¯x), b = S
12
/S
11
, for the two groups
separately (same grayness for points and line). Since we assumed that the covariance matrix
was the same in the two groups, these lines are parallel. It is the vertical distance between
these two lines that defines the treatment difference. The dashed lines gives the predictions
for the two means of the outcome variable, conditional on the overall baseline average. This
illustrates the difference between the result of this analysis and the analysis of the unadjusted
means for the two groups, which started this discussion. The unadjusted means are shown as
the triangles close to the y-axis, and are not quite on the dashed lines, but if we move these
triangles horizontally until they intersect the respective line, and from there go down to the
x-axis, we find the baseline means for the two groups. The difference between the triangles
and the respective dashed lines is therefore a graphical illustration of how much the mean
difference at baseline affects the crude mean difference.
3
4
Outcome variable Y
32
Baseline variable X
Figure 8.9 How an analysis of covariance works. Black and gray dots represent data from
the two groups, and the parallel lines the regression lines from the analysis for each of the
groups. The triangles are crude mean values of the outcome variable for each group and the
dashed lines show how the adjusted means for each group are obtained.

MULTIVARIATE ANALYSIS AND ANALYSIS OF COVARIANCE 237
When we look at Figure 8.9, we may view the problem in a slightly different way. We
know that the conditional distribution of Y on X is a linear function as in the graph, because the
data are Gaussian. We get an (almost) equivalent analysis if we switch our assumptions so that
we assume this linear relation to start with, and only consider the conditional distribution of
Y. In doing this we switch to a univariate probability model. Specifically, let z be an indicator
variable for group membership, which we choose to be 1 for group A and −1 for group B.
The model assumption is then that
E(Y |Z = z, X = x) = θ
1
+ θ
2
z + θ
3
x,
for unknown parameters θ = (θ
1
,θ
2
,θ
3
), together with an assumption that this conditional
distribution of Y has a Gaussian distribution with a common variance for all individuals.
To analyze this we can use least squares to estimate θ; this is described in some detail in
Example 9.1. What this theory tells us is that we get parameter estimates corresponding to
those above, in particular that θ
3
= S
12
/S
11
and 2θ
2
=
∗
2
. There is a difference, however,
because with this model we end up with a confidence function for
2
which is based on the
observation (in the notation above) that
f − 1
f
Q
2.1
(
ˆ
2
|
ˆ
1
) ∈ t
2
(f − 1).
We refer to this test as the conditional test for the mean parameter difference. It is a so-
called linear model (see Chapter 9); this particular case is called an analysis of covariance
(ANCOVA). The difference from the unconditional test above lies in which residual variation
is used in the test. Both tests takes the form
ˆ
σ
−2
ˆ
2
−
2
−
S
12
S
11
(
ˆ
1
−
1
)
2
∈ t
2
(f − 1),
where for
ˆ
σ
2
we take s
2
= f
2.1
/(f − 1) for the conditional test, but use the slightly larger
variance s
2
(1 + Q
1
(
∗
1
)/f ) for the unconditional test. The results of these two analyses of
our data are summarized in the following table:
Type
∗
2
95% CI
Conditional −0.268 (−0.491, −0.044)
Unconditional −0.268 (−0.497, −0.038)
The difference between the conditional and unconditional test above is not that great. They
are different, since they use different probability models. The unconditional test is a test on a
bivariate Gaussian distribution, though with a conditional analysis at the end. The conditional
tests is a test of a linear model with the residual assumed to have a (univariate) Gaussian
distribution. In the first case the linear predictor is a consequence of the bivariate Gaussian
distribution of the mean differences, in the second case it is the basic model assumption.
The unconditional method lends itself rather readily to an ANCOVA without the Gaussian
assumption, as long as we accept that the analysis is only approximate. The assumption of
equal variance is not necessary, since we can replace (1/n + 1/m) with the expression
1
/n +
2
/m, and estimate this using group-specific sample variances. Appealing to the
238 HOW TO COMPARE THE OUTCOME IN TWO GROUPS
CLT to justify a large-sample bivariate Gaussian distribution approximation for
ˆ
,wehavea
relatively easy road to the application of the unconditional method to non-Gaussian data. The
appropriateness of the approximation ultimately depends on sample size and how skewed
the data are. In this case the linear regression lines will be statements about the arithmetic
means only, not about the data; it is the arithmetic means we assume have a bivariate
Gaussian distribution.
We have discussed how we can employ the ANCOVA to adjust for observed baseline
differences when there is no true difference there, and obtain estimates of treatment effects
with higher precision. However, this is not the only use for ANCOVA. In fact, we could argue
that if adjustment is what we want to do, we should think of the unconditional method. The
conditional method is a modeling approach to data, something we will discuss in much more
detail in the next chapter. As an introduction to this discussion we conclude this chapter with
an illustration of an ANCOVA in which we do not want to make a group comparison for the
same value of the covariate. In fact, quite the opposite.
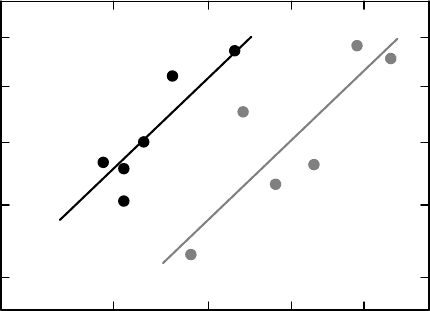
Example 8.7 The pharmacokinetics of a new drug was investigated in 6 men and 5 women.
When clearance was computed and compared head-on between the two groups, no difference
could be found. But then the graph in Figure 8.10 was produced. The straight lines are
analysis of covariance estimates for each of the sexes, in which the logarithm of clearance is
analyzed with an ANCOVA, with the logarithm of body weight taking the place of the baseline
measurement. What we see is that, as functions of body weight W, clearance differs between
sexes: on average it is 0.82W
1.26
for men and 1.11W
1.26
for women. The ratio, for the same
weight, is 1.35. But then, why should we want to compare clearance at the same weight? The
important information is that, despite a body weight dependence, men and women clear the
drug from plasma equally well. But knowing that clearance depends on body weight may also
be important when we choose the dose for a particular patient.
150
175
200
225
250
Estimated Clearance (mL/min)
1009080706050
Bod
y
Wei
g
ht (k
g
)
Figure 8.10 Example of an ANCOVA in which we do not want to adjust to equal covariate
means. Gray data represent men, black data women.
COMMENTS AND FURTHER READING 239
8.9 Comments and further reading
This chapter has discussed two-group comparisons using what are perhaps the two most often
used and best-known tests in medical statistics, Student’s t-test and Wilcoxon’s rank sum test.
The former is an extension of the one-sample t-test we discussed in the previous chapter. The
two-group test was actually introduced by R. A. Fisher who, fifteen years after its publication,
discovered William Gosset’s original publication on the one-sample case and extended it,
not only to this two-group situation, but all the way to what became known as analysis of
variance (Senn, 2008). The t-test addresses the difference in means and requires complete
data, whereas the way to obtain confidence limits for a percentile difference, discussed in
Box 8.2, can be extended to situations with censored data (Su and Wei, 1993), by using the
appropriate variance estimate.
Lehmann (1998) gives a general introduction to nonparametric tests. The Wilcoxon test
was developed as a rank test by Frank Wilcoxon in 1945 and then, later and independently, by
Mann and Whitney, using the scores that are named for them. The test is therefore often referred
to as the Wilcoxon–Mann–Whitney test, with the score version leading to the Wilcoxon
probability (Halperin et al., 1987). The Hodges–Lehmann shift estimator was introduced
later (Hodges and Lehmann, 1963) as the median of all the differences. The characterization
in Box 8.4 was given in the paper by Fine (1966), though the discussion there is in terms of
e-CDFs instead of CDFs. The relation between the t-test and the Wilcoxon test discussed in
Box 8.3 was introduced (Conover and Iman, 1981) as a pedagogical technique to use rank
transformations as a bridge between parametric and nonparametric statistics (and also as a
method to carry out nonparametric statistics in statistical software that may not include such
methods). The initial enthusiasm about the prospect of applying this philosophy (to rank
data before analysis) to more general problems soon waned, when it was realized that the
nonlinear transformation involved did not always produce sensible tests (Thompson, 1991).
The generalized odds ratio mentioned in the text was discussed by Agresti (1980), but seems
not to have gained much interest in the biostatistics community.
I have found no reference for the description of the various aspects of the nature of the
Wilcoxon test discussed in this chapter; in particular about parameter estimation in different
models using a simple estimating equation. The particular relation between the proportional
odds model and the Wilcoxon test is, however, well known and has been used to determine
the power of a study for categorical data (Whitehead, 1993).
The fact that p-values can be computed in different ways, and why the way they are
computed matters, was illustrated in (Bergmann et al., 2000), where the outcomes for a
Wilcoxon test on a particular data set were compared between 11 PC-based statistical software
programs. The p-values varied, depending on whether a large-sample approximation or an
exact permutation form of the test was used and, in the former case, whether or not a continuity
correction (see page 98) was used. The key message is that you need to understand precisely
what your particular software does, before you use it.
The discussion of crossover studies is short, and focused on the design issues and on the
analysis of a two-period crossover study as a parallel group study. Similar discussions as well
as discussion of how to analyze crossover studies with more than two periods can be found
in either Jones and Kenward (1989) or Senn (2002).
For mathematical details on the unconditional test in Section 8.8, see Rao (1967) and
references therein, as well as Marden and Perlman (1980). It should be noted that we do not
240 HOW TO COMPARE THE OUTCOME IN TWO GROUPS
discuss the test statistic Q(
ˆ
2
|
ˆ
1
) itself; this has a different distribution which is described
by Rao. For more on the nonparametric analysis of covariance, see Koch et al. (1982).
References
Agresti, A. (1980) Generalized odds ratio for ordinal data. Biometrics, 36(1), 59–67.
Bergmann, R., Ludbrook, J. and Spooren, W. (2000) Different outcomes of the Wilcoxon-Mann-Whitney
test from different statistics packages. American Statistician, 54, 72–77.
Conover, W. and Iman, RL. (1981) Rank transformations as a bridge between parametric and nonpara-
metric statistics. American Statistician 35(3), 124–133.
Fine, T. (1966) On the Hodges and Lehmann shift estimator in the two sample problem. Annals of
Mathematical Statistics, 37(6), 1814–1818.
Halperin, M., Gilbert P.R. and Lachin J.M. (1987) Distribution-free confidence intervals for Pr(X
1
<
X
2
). Biometrics, 43, 71–80.
Hodges, J.L. and Lehmann, E.L. (1963) Estimates of location based on rank tests. Annals of Mathematical
Statistics, 34, 598–611.
Jones, B. and Kenward, M.G. (1989) Design and Analysis of Cross-Over Trials number 34 in Mono-
graphs on Statistics and Applied Probability. London:Chapman & Hall.
Koch, G.G., Mara, I.A., Davis, G.W. and Gillings, D.B. (1982) A review of some statistical methods for
covariance analysis of categorical data. Biometrics 38(3), 563–595.
Kowalski, J. and Tu, X.M. (2008) Modern Applied U-Statistics. Hoboken, NJ: John Wiley & Sons, Inc.
Lehmann, E.L. (1998) Nonparametrics: Statistical Methods Based on Ranks revised 1st edn. Upper
Saddle River,NJ: Prentice Hall.
Marden, J. and Perlman, M.D. (1980) Invariant tests for means with covariates. Annals of Statistics,
8(1), 25–63.
Rao, C.R. (1967) Proceedings of the Fifth Berkeley Symposium on Mathematical Statistics and Proba-
bility vol. 1 Berkeley: University of California Press chapter Least squares theory using an estimated
dispersion matrix and its application to measurement of signals, pp. 355–372.
Senn, S. (2002) Cross-over Trials in Clinical Research Statistics in Practice second edn. Chichester:
John Wiley & Sons, Ltd.
Senn, S. (2008) A century of t-tests. Significance, 5(1), 37–39.
Su, J.Q. and Wei, L.J. (1993) Nonparametric estimation for the difference or ratio of median failure
times. Biometrics, 49(2), 603–607.
Thompson, G. (1991) A note on the rank transform for interactions. Biometrika, 78(3), 697–701.
Whitehead, J. (1993) Sample size calculations for ordered categorical data. Statistics in Medicine, 12,
2257–2271.