Marder M.P. Condensed Matter Physics
Подождите немного. Документ загружается.

Optical Modes
in
Ionic Crystals
673
The interaction
of the
electron with
the
phonons lowers
the
energy
of
the
in-
teracting system.
For
low momenta Hq,
the
change
in
energy
is
—apHio^.
As the
electron energy rises toward
the
phonon energy,
the
energy gain increases.
For
small
q
one finds that
h
2
q
2
A£
(2)
-a
p
h~Lü
L
On
12m*
(22.52)
Even
in the
absence
of
interaction with polarized ions,
the
electron already
has an
effective mass m*
due to
interaction with the periodic crystal potential. Interaction
with
the
polarization cloud raises the effective mass
to a
new value, m*
ol
.
When
one
adds
Eq.
(22.52)
on to the
original kinetic energy
of the
electron,
h
2
q
2
/2m*,
to
lowest order
in a
p
the
effective mass
of
the electron
is
changed
by
the interaction with the phonons
and
equals
m,
pol
nr
1
«n
(22.53)
This result
is
sensible, because
the
electron
has to
drag phonons around with
it
as
it
moves,
and
therefore becomes heavier.
The
stronger
the
coupling with
the
phonons,
the
heavier
it
becomes.
When
the
electron kinetic energy
is
larger than
HUJ^,
then rather than simply
being surrounded
by a
cloud
of
phonons,
the
electron emits them
in a
shower.
According
to
Eq. (22.51), the change
in
electron energy becomes imaginary
and is
A£
(
-a
v
\Jm*H(jJ
L
q
7r/2 + i cosh
-l
2 „2
h
l
q
2m*tïujL
(22.54)
The meaning
of
an imaginary energy
is
that the probability
of
finding
the
electron
in state
q
decays exponentially
in
time. The electron wave function behaves
in
time
as
i
exp
h
(£<
0)
+ A£
(2)
>
so that the probability
of
finding
the
electron
in its
initial state decays
as
r2.
exp
Lfi
Im(A£
(2)\
The decay rate
is
I
T\/2
2a
p
\/
m*hcü(
j
——
cosh
2„2
¥q
2m*
hu^
(22.55)
(22.56)
(22.57)
The same computation can
be
carried out using time-dependent perturbation theory
(Problem 3),
and it
gives
the
same answer, because time-dependent
and
stationary
perturbation theory
are
really just different views
of
the same calculation.
674
Chapter 22. Optical Properties of Insulators
22.3.3 Experimental Observations of Polarons
Polaron theory has been checked rather carefully, although the experiments are
dif-
ficult and not exceptionally accurate. A serious check requires independent mea-
surement of all the parameters in Eq. (22.43). One of the parameters in Eq. (22.43)
is the electron effective mass
m*
in the absence of polaron effects, so experimental
techniques must be devised that can turn off polaron physics to find m*, then turn
it back on to measure
m*
, and compare with (22.53).
Information on how this task may be accomplished is contained in Eq. (22.57).
When the electron kinetic energy is larger than
Hco^,
its effective mass is no longer
altered by polaron physics, and furthermore its interaction with polar ions de-
creases as q becomes larger. Equivalently, if the electrons are excited by an ex-
perimental probe at frequencies well above
ÜJL,
the electrons will display an effec-
tive mass m*, while at frequencies below
O;L
they display an effective mass m*
o]
.
Faraday
rotation,
discussed in Problem 2, is a probe of electron effective masses at
infrared frequencies, around 10
14
Hz, while cyclotron resonance, discussed in Sec-
tion 21.2, operates in the microwave regime at around 10
10
Hz, so the two effective
masses can be measured independently.
An additional experimental problem lies in the fact that it is difficult to coerce
an electron into the conduction band of an insulator. In some cases, such as ZnO,
the problem can be solved by doping with suitable impurities. In other cases, the
solution is to blast the crystal with light of such a frequency as to excite electrons
from valence to conduction band. Cyclotron resonance can be performed in either
case,
but Faraday rotation measurements have been restricted to the doped crystals,
so the number of cases where a complete check of the polaron theory is available is
limited. However, as can be seen from the final columns of Table 22.2, agreement
between theory and experiment is quite good. Where the coupling constant a
p
is
larger than one, lowest-order perturbation becomes questionable, and in fact the
measured polaron effective mass is roughly double the prediction of Eq. (22.53),
but for those compounds where a
p
<
1
the agreement is excellent. Feynman (1972)
discusses on pp. 234-241 how to improve the theory so as to handle larger values
of
ccp.
The strong-coupling limit, a
p
—»
oo, has also been reviewed by Peeters and
Devreese(1984).
A related area of study considers charged localized excitations in polymers
such as polyacetylene, and it has been reviewed by Heeger et al. (1988).
22.4 Point Defects and Color Centers
The coloration of ionic crystals provided a subject of intense interest for decades.
The transverse and longitudinal frequencies listed in Table 22.2 all lie below the
frequency of visible light. Figure 22.5 shows that visible light should pass almost
unchanged through the ionic crystals. Yet they frequently have distinct colors. For
example, sodium chloride can have either a bluish or a yellowish tint. The blue tint
is naturally present in salt, and it is due to the presence of small aggregates of excess
sodium. Röntgen (1921) showed that that the yellow color could be produced either
Point Defects and Color Centers 675
by heating a salt crystal in sodium vapor or by irradiation by X-rays, and he also
showed that the photoelectric effect was greatly enhanced by radiation. The yellow
coloration had earlier been ascribed to the precipitation of small metal particles
within the crystal, but Röntgen showed that it was most intense in cases where no
traces of precipitates were to be found. The defect responsible for discoloration
was too small to detect with any microscope.
The center of research into these phenomena in the 1920s and 1930s was in
Göttingen, directed by R. W. Pohl. The nature of the localized color centers re-
sponsible for optical absorption and emission peaks was slowly teased out of a
variety of experiments, involving irradiation, electrical conductivity, and mechan-
ical stresses. Mollwo (1933), for example, showed that the density of a crystal
decreased in direct proportion to the strength of its absorption peak. A decrease
in density can be explained by observing that each metal ion entering the crystal
wants to divest itself of an outer electron and deliver it to a corresponding halo-
gen ion. In the absence of the halogen, it is thermodynamically favorable for an
empty site to diffuse into the crystal and absorb the extra electron. Mott and Gur-
ney
( 1940)
made the connection between the theoretical idea of the vacancy and
the color centers observed by Pohl.
The significance of research into color centers goes beyond explaining the yel-
low tint of salt. Understanding the role of defects in determining optical properties
of ionic crystals provided the background for explaining the physics of photog-
raphy and the physics behind photocopying. The same body of knowledge also
played an important role in finding materials suitable for creating the laser. The
alkali halide crystals themselves have few practical applications as optical materi-
als,
but they provided the testing ground where optical effects of defects could be
explained in detail.
22.4.1 Vacancies
The simplest defect in a crystal is a vacancy, which is simply a lattice site from
which an atom is missing. The energy cost of introducing a vacancy into a crystal is
related to the cohesive energy. As shown in Table
22.3,
these two energies are of the
same order of magnitude, but never identical. The reason for the difference is that
atoms in the vicinity of a vacancy relax, lowering the energy below what it would
be after the atom had instantaneously been plucked out of the solid. Because the
energy cost of a vacancy is finite, every equilibrium crystal contains a finite density,
given by Eq. (5.21), that increases exponentially with temperature. In the ionic
crystals, the density of vacancies can be increased enormously by introduction of
alkali metals, rising to as high as one part in a thousand. Visible coloration is
produced by vacancy densities on the order of one part in ten thousand.
Frenkel and Schottky Pairs. In ionic solids there are common defects more
elaborate than a vacancy. Because the ions carry charges, defects must form in
such a way as to maintain charge neutrality. An ion that abandons a site (leaving
a vacancy) and climbs into an interstitial location is called a Frenkel pair. The
676 Chapter 22. Optical Properties of Insulators
Table 22.3. Cohesive energy versus vacancy en-
ergy for selected elements
Crystal Cohesive Energy 8./N Vacancy Energy
(eV) (eV)
0.42
0.97
0.76
1.4
0.020
0.077
2.0
Na
Au
Al
Pt
Ne
Kr
Ge
1.16
3.8
3.4
5.3
0.021
0.11
3.9
Source: Flynn (1972),
p.
7.
vacancy and interstitial are bound together because of the Coulomb attraction be-
tween them, and they occupy neighboring sites. A Schottky
pair,
by contrast, oc-
curs when nearby vacancies develop, one where a cation should be, and the other
where an anion should be.
22.4.2 F Centers
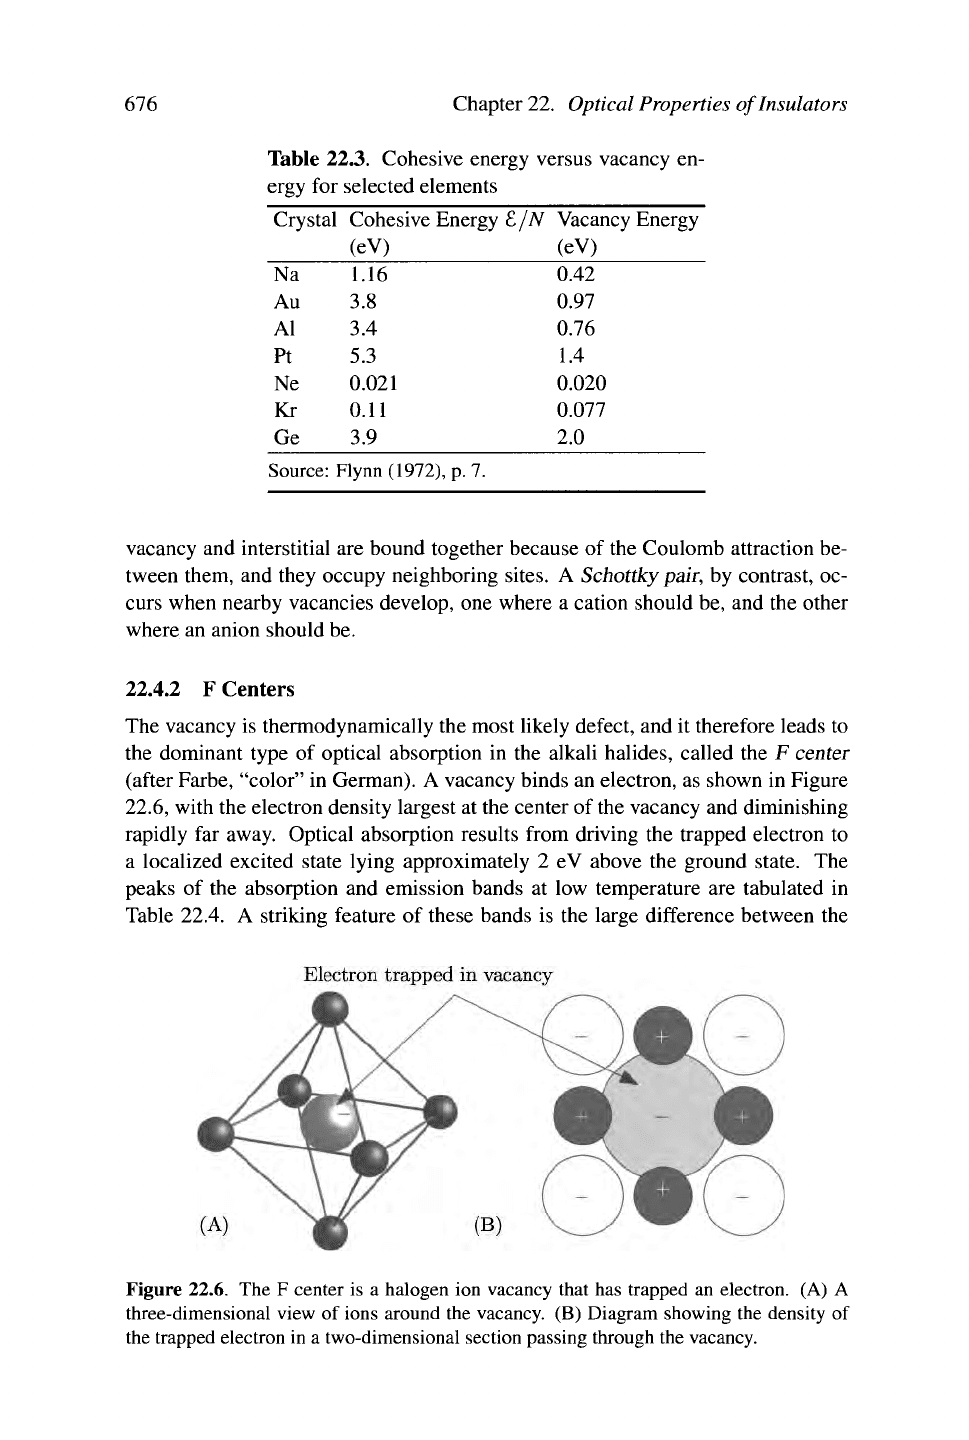
The vacancy is thermodynamically the most likely defect, and it therefore leads to
the dominant type of optical absorption in the alkali halides, called the F center
(after Farbe, "color" in German). A vacancy binds an electron, as shown in Figure
22.6,
with the electron density largest at the center of the vacancy and diminishing
rapidly far away. Optical absorption results from driving the trapped electron to
a localized excited state lying approximately 2 eV above the ground state. The
peaks of the absorption and emission bands at low temperature are tabulated in
Table 22.4. A striking feature of these bands is the large difference between the
Figure 22.6. The F center is a halogen ion vacancy that has trapped an electron. (A) A
three-dimensional view of ions around the vacancy. (B) Diagram showing the density of
the trapped electron in a two-dimensional section passing through the vacancy.
Point Defects and Color Centers 677
Table 22.4. Absorption and emission peaks from F centers in alkali halide
crystals at low temperatures
Compound £
a
b
s
(eV) £
em
(eV) Compound
£
a
t,
s
(eV) £
em
(eV)
RbCl
RbBr
Rbl
CsF
CsCl
CsBr
Csl
2.05
1.86
1.71
1.89
2.17
1.96
1.68
1.09
0.87
0.81
1.42
1.26
0.91
0.74
NaF
NaCl
KF
KC1
KBr
KI
RbF
3.72
2.77
2.85
2.31
2.06
1.87
2.43
1.67
0.98
1.66
1.22
0.92
0.83
1.33
Notice that the energy of absorption £
a
bs and emission £
em
are substantially
dif-
ferent. Source: Pick (1972), p. 659, and Fowler (1968), p. 627.
frequencies of absorption and emission, called the Stokes shift. The phenomenon
is called the Franck-Condon effect, and will be discussed in the next section.
22.4.3 Electron Spin Resonance and Electron Nuclear Double Resonance
The final controversies over the structure of color centers were laid to rest by spin
resonance experiments. In electron spin resonance (ESR), a static magnetic field
HQ
is applied to the sample, producing an induction ßo =
HQ.
The two spin levels
of the trapped electron are split in energy by an amount 2fißBo, where u,ß is the
Bohr magneton. This energy splitting can be measured by applying an additional
oscillating magnetic field at frequencies u) of order 10
10
Hz and then detecting
resonant absorption whenever
HUJ
= 2/J,BBQ. The technique gives information about
2.5 3.0 3.5 4.0
Magnetic field H
0
along [110] (kG)
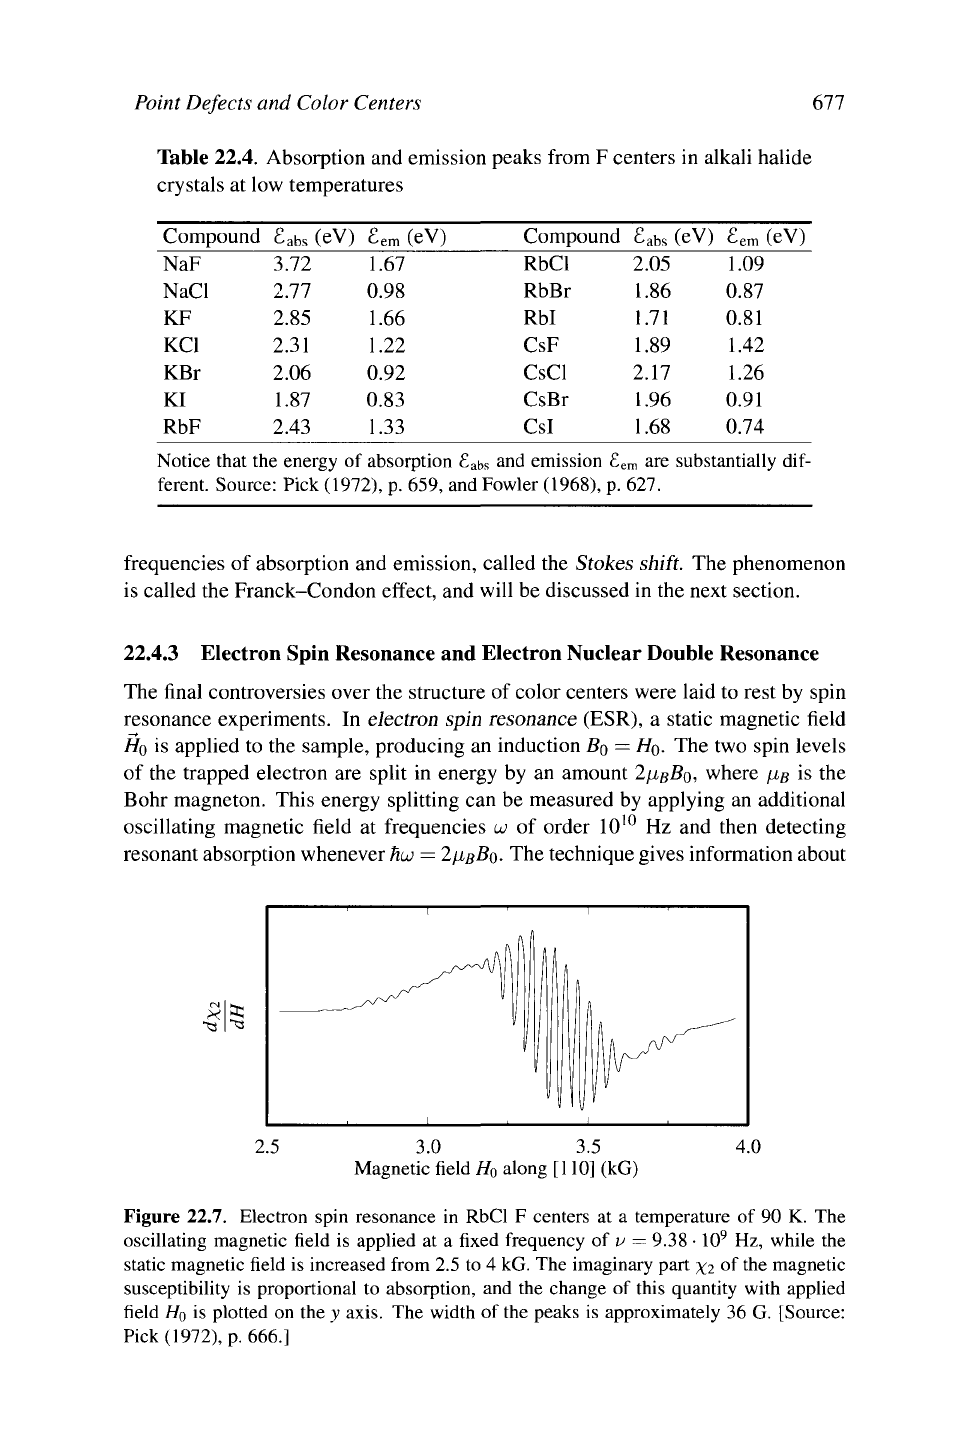
Figure 22.7. Electron spin resonance in RbCl F centers at a temperature of 90 K. The
oscillating magnetic field is applied at a fixed frequency of v = 9.38
•
10
9
Hz, while the
static magnetic field is increased from 2.5 to 4 kG. The imaginary part xi °f the magnetic
susceptibility is proportional to absorption, and the change of this quantity with applied
field
HQ
is plotted on the y axis. The width of the peaks is approximately 36 G. [Source:
Pick (1972), p. 666.]
r^
1
s.
678 Chapter 22. Optical Properties of Insulators
color centers because the absorption resonance can be split into multiple peaks by
the hyperfine interaction of the trapped electron with the nuclei of the surrounding
ions.
A simple way to model this interaction is to observe that the static magnetic
field experienced by a trapped electron is the sum of two pieces,
B = B
0
+
J2Bh (22.58)
/
where B[ is the magnetic field due to the nuclei of the nearby ions. In the case
of RbCl, the positive ions are
85
Rb, which has magnetic moment 1.35 /xyy (/i# =
eh/2m
n
c is the nuclear magneton) and nuclear spin / = 5/2. Nuclear spins do not
equilibrate quickly with the applied field Bo, so nuclei of
the
six near neighbors of a
trapped electron can be in any of their quantum eigenstates, and the total spin with
which the electron interacts ranges from
— 15/i
to 15/i. Thus the hyperfine inter-
action with near neighbors should split the electron spin resonance into 31 levels:
The most likely level corresponds to total nuclear spin 0, and other levels appear
with diminishing probability. Measurements are not in precise accord with the pre-
diction, as shown in Figure 22.7, because next-nearest and other neighbors cannot
be neglected, and the resonance lines are accordingly broadened. The measure-
ments are made more precise by proceeding to electron nuclear double resonance
(ENDOR), invented by Feher (1959), where at the same time the electron oscillates
between spin levels a second oscillating field in the range of
1
MHz is applied to
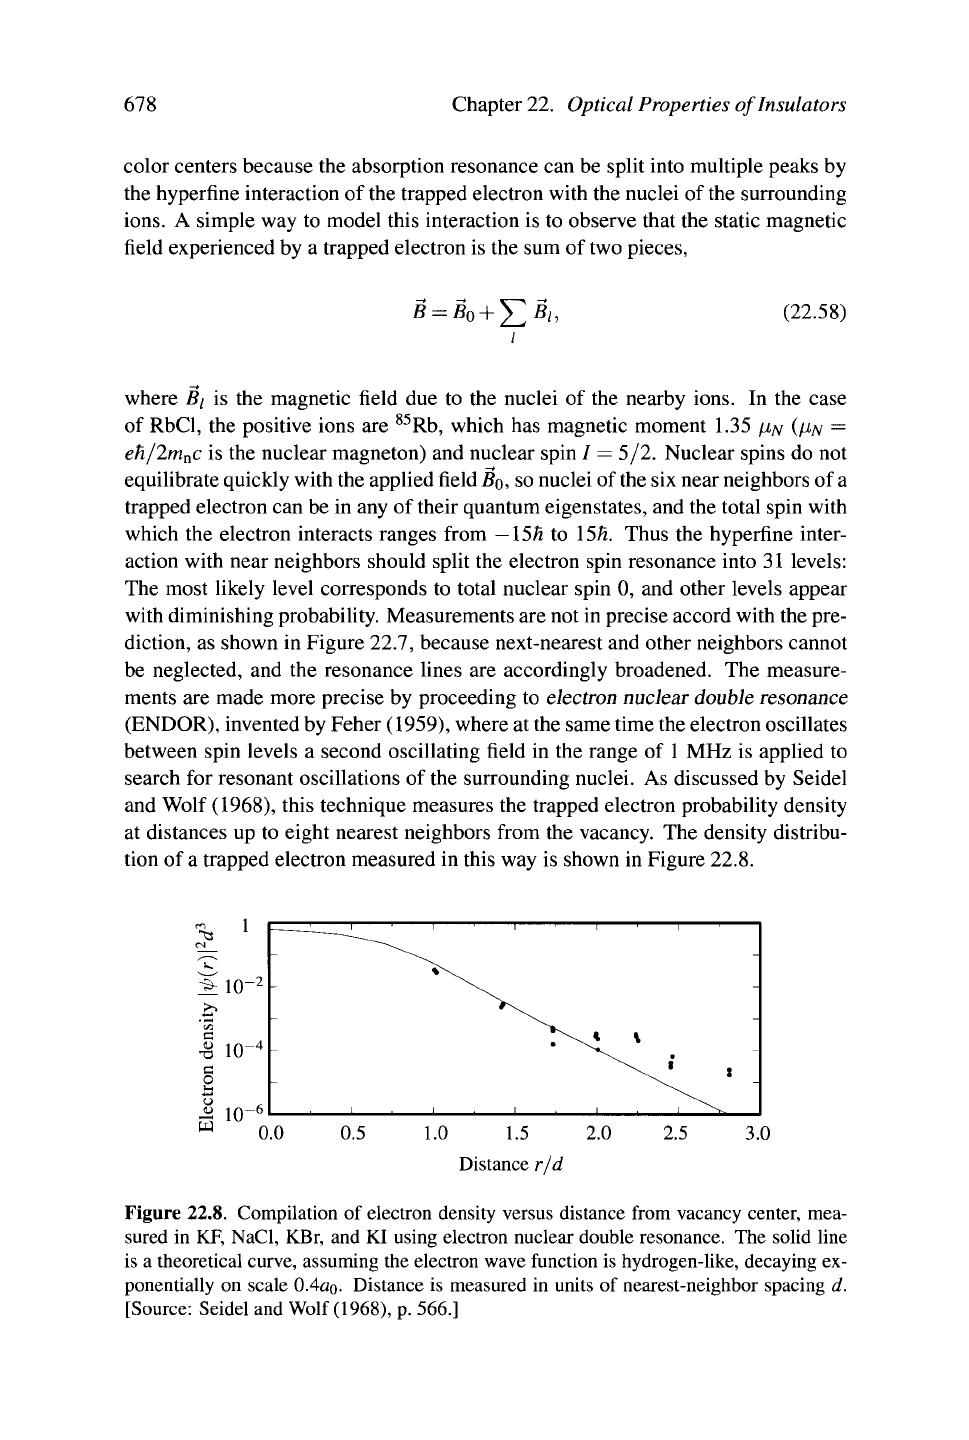
search for resonant oscillations of the surrounding nuclei. As discussed by Seidel
and Wolf (1968), this technique measures the trapped electron probability density
at distances up to eight nearest neighbors from the vacancy. The density distribu-
tion of a trapped electron measured in this way is shown in Figure 22.8.
JMO"
2
>>
I
io-
4
c
o
M 1(T
6
w
0.0 0.5 1.0 1.5 2.0 2.5 3.0
Distance r/d
Figure 22.8. Compilation of electron density versus distance from vacancy center, mea-
sured in KF, NaCl, KBr, and KI using electron nuclear double resonance. The solid line
is a theoretical curve, assuming the electron wave function is hydrogen-like, decaying ex-
ponentially on scale 0.4a
0
- Distance is measured in units of nearest-neighbor spacing d.
[Source: Seidel and Wolf
(1968),
p. 566.]
Point Defects and Color Centers 679
22.4.4 Other Centers
Exposing ionic crystals to alkali vapor produces almost nothing but F centers.
Bombarding the crystals with X-rays produces F centers as well, but also a host
of other color centers. A variety of composite color centers can also be produced
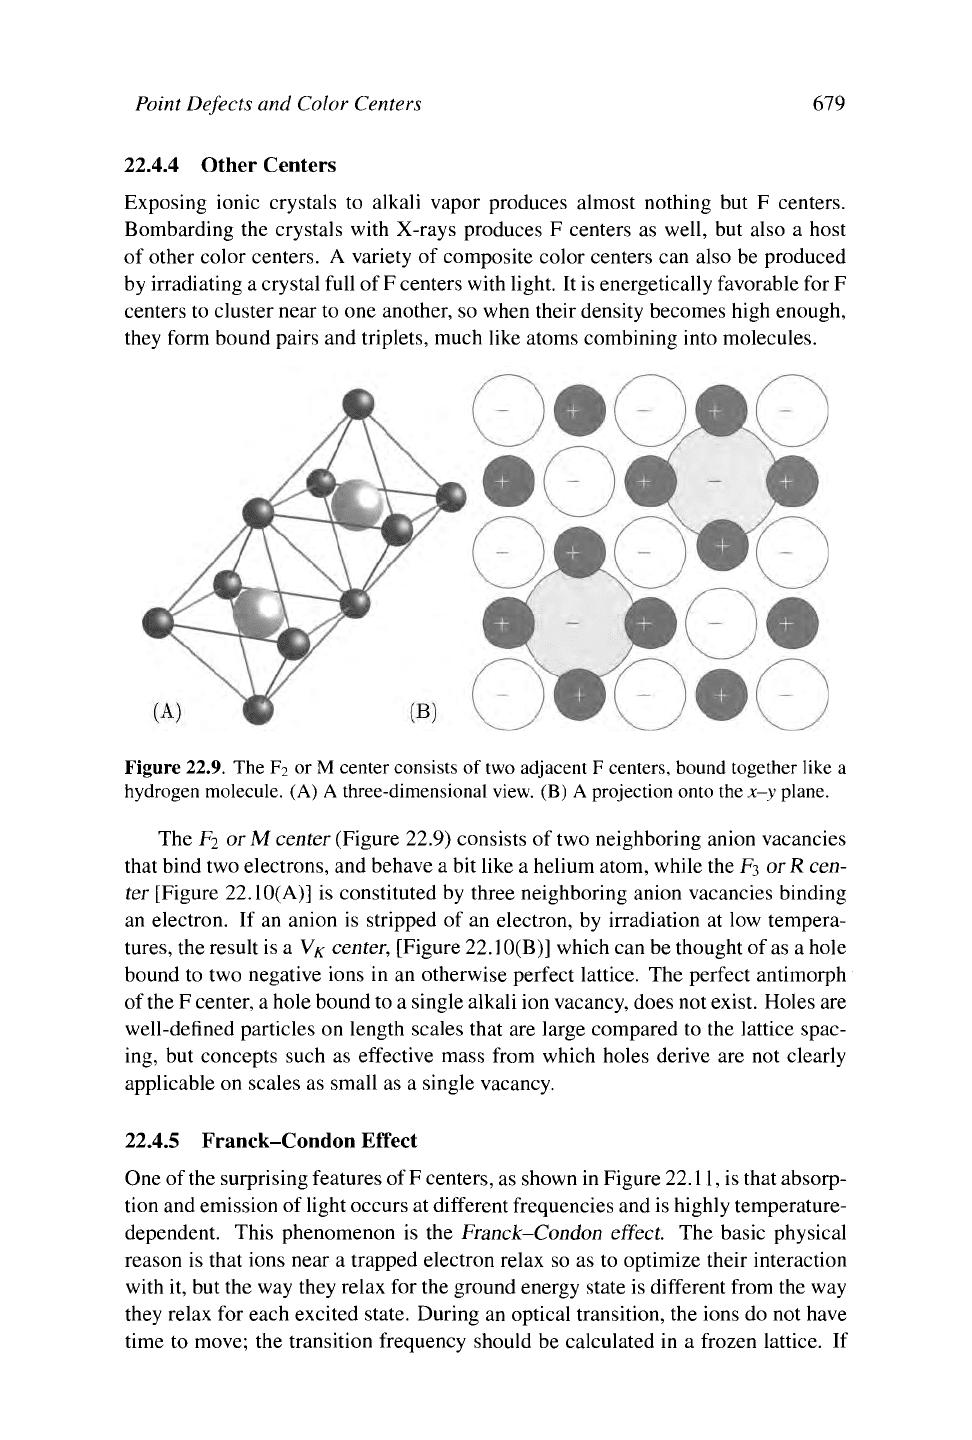
by irradiating a crystal full of F centers with light. It is energetically favorable for F
centers to cluster near to one another, so when their density becomes high enough,
they form bound pairs and triplets, much like atoms combining into molecules.
Figure
22.9.
The F
2
or
M
center consists of two adjacent F centers, bound together like a
hydrogen molecule. (A)
A
three-dimensional view. (B) A projection onto
the
x-y plane.
The F2 or M center (Figure 22.9) consists of two neighboring anion vacancies
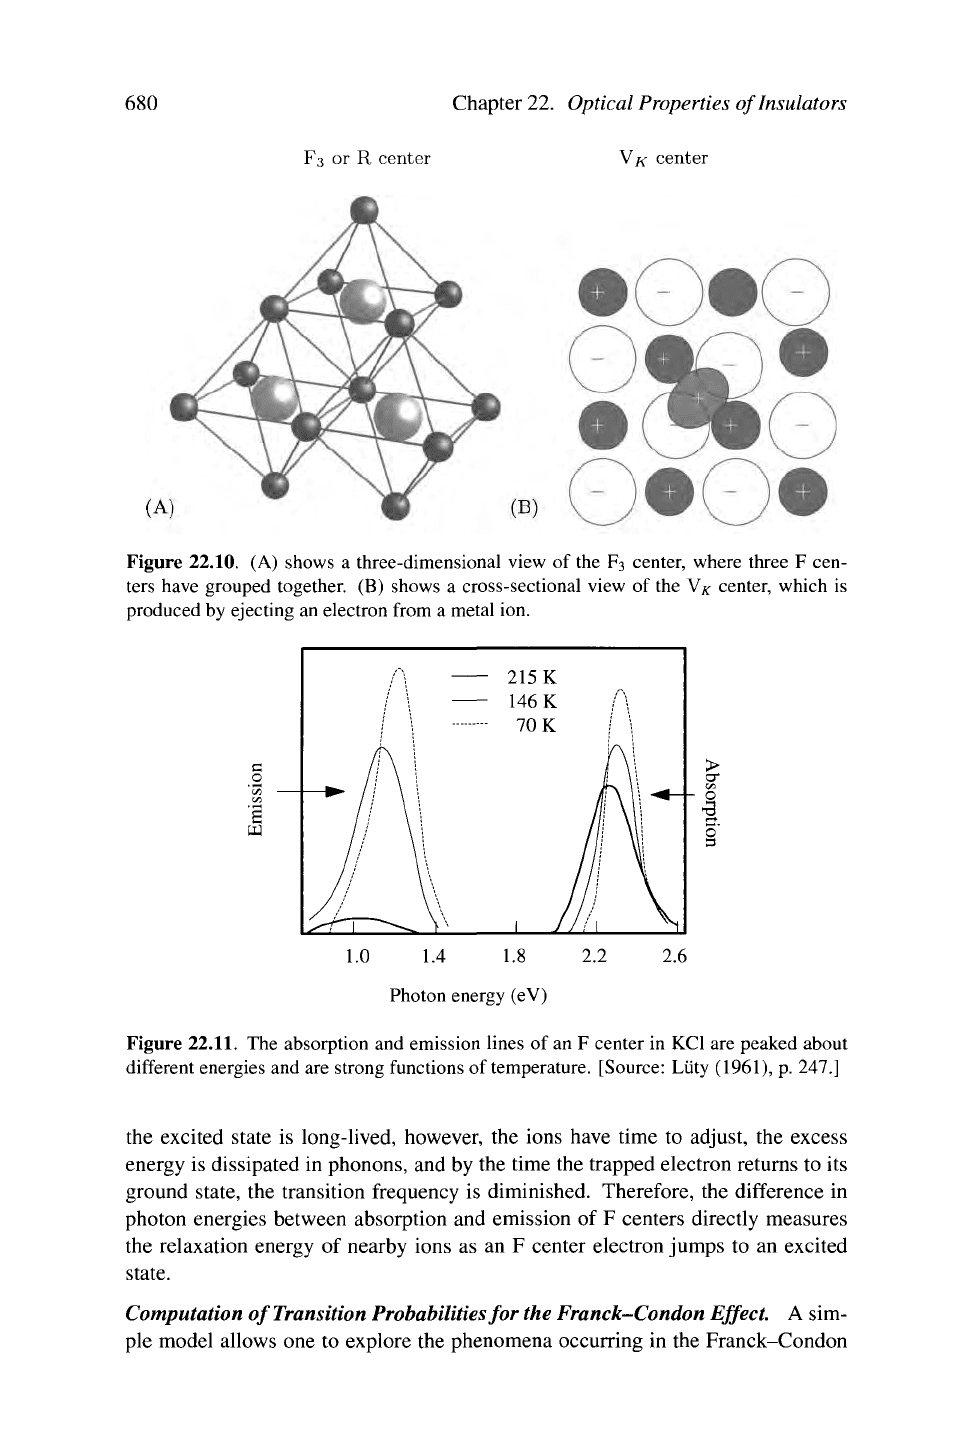
that bind two electrons, and behave a bit like a helium atom, while the
F3
or R cen-
ter [Figure 22.10(A)] is constituted by three neighboring anion vacancies binding
an electron. If an anion is stripped of an electron, by irradiation at low tempera-
tures,
the result is a VK center, [Figure 22.10(B)] which can be thought of as a hole
bound to two negative ions in an otherwise perfect lattice. The perfect antimorph
of
the
F center, a hole bound to a single alkali ion vacancy, does not exist. Holes are
well-defined particles on length scales that are large compared to the lattice spac-
ing, but concepts such as effective mass from which holes derive are not clearly
applicable on scales as small as a single vacancy.
22.4.5 Franck-Condon Effect
One of
the
surprising features of
F
centers, as shown in Figure
22.11,
is that absorp-
tion and emission of light occurs at different frequencies and is highly temperature-
dependent. This phenomenon is the Franck-Condon effect. The basic physical
reason is that ions near a trapped electron relax so as to optimize their interaction
with it, but the way they relax for the ground energy state is different from the way
they relax for each excited state. During an optical transition, the ions do not have
time to move; the transition frequency should be calculated in a frozen lattice. If
680 Chapter 22. Optical Properties of Insulators
F3 or R center YK center
Figure 22.10. (A) shows a three-dimensional view of the F3 center, where three F cen-
ters have grouped together. (B) shows a cross-sectional view of the V# center, which is
produced by ejecting an electron from a metal ion.
c
o
UJ
1.0 1.4 1.8 2.2
Photon energy (eV)
>
O
►a
o"
3
2.6
Figure
22.11.
The absorption and emission lines of an F center in KCl are peaked about
different energies and are strong functions of temperature. [Source: Liity (1961), p. 247.]
the excited state is long-lived, however, the ions have time to adjust, the excess
energy is dissipated in phonons, and by the time the trapped electron returns to its
ground state, the transition frequency is diminished. Therefore, the difference in
photon energies between absorption and emission of F centers directly measures
the relaxation energy of nearby ions as an F center electron jumps to an excited
state.
Computation of Transition Probabilities for the Franck-Condon Effect. A sim-
ple model allows one to explore the phenomena occurring in the Franck-Condon
Point Defects and Color Centers 681
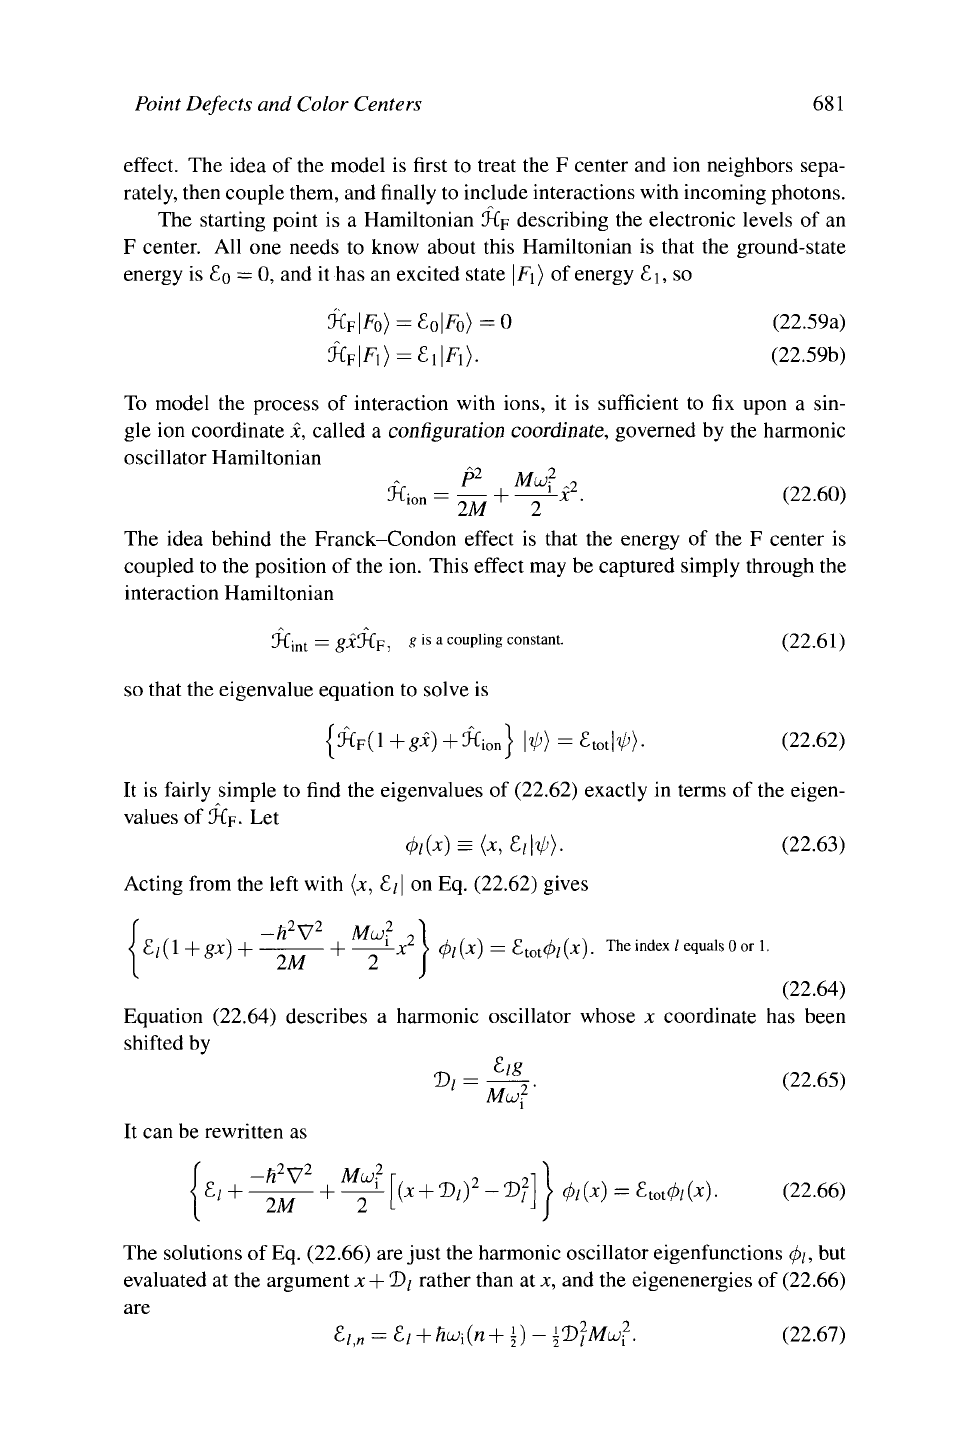
effect. The idea of the model is first to treat the F center and ion neighbors sepa-
rately, then couple them, and finally to include interactions with incoming photons.
The starting point is a Hamiltonian ÄF describing the electronic levels of an
F center. All one needs to know about this Hamiltonian is that the ground-state
energy is
£Q
= 0, and it has an excited state \F\) of energy £1, so
U
F
\F
0
)
= £.
0
\Fo)=0
Ä
F
|F,) = £i|F
1
).
(22.59a)
(22.59b)
To model the process of interaction with ions, it is sufficient to fix upon a sin-
gle ion coordinate x, called a configuration coordinate, governed by the harmonic
oscillator Hamiltonian
pi Muß'
Ä
ion
= —- + —^x
2
. (22.60)
The idea behind the Franck-Condon effect is that the energy of the F center is
coupled to the position of the ion. This effect may be captured simply through the
interaction Hamiltonian
CK
int
= gi3-C
F
, g is a coupling constant.
so that the eigenvalue equation to solve is
{Ä
F
(1 +gx) +Ä
ion
} |V) = fitotlV')-
(22.61)
(22.62)
It is fairly simple to find the eigenvalues of (22.62) exactly in terms of the eigen-
values of Äp. Let
&(*) = <*,£/1 V>>- (22.63)
Acting from the left with (x, £;
|
on Eq. (22.62) gives
£/(i+g*) +
-h
2
S/
2
MUJ}
-\——-x
>
4>i
(x)
=
£.
t
ot4>i
(x)
■
The index
'
equals
°
or
l
■
2M 2
(22.64)
Equation (22.64) describes a harmonic oscillator whose x coordinate has been
shifted by
D,
Muf
It can be rewritten as
2vy2
£/ +
►
2M
+
Mut
(x
+ D,)
2
-^
(x)
=
8.
tot
(f>i(x).
(22.65)
(22.66)
The solutions of
Eq.
(22.66) are just the harmonic oscillator eigenfunctions
</>/,
but
evaluated at the argument x + D/ rather than at x, and the eigenenergies of (22.66)
are
'l.n
£/ + ^(n+i)-iî)
2
Ma;
2
. (22.67)
682 Chapter 22. Optical Properties of Insulators
&
e
pq
+-
x
Configuration coordinate
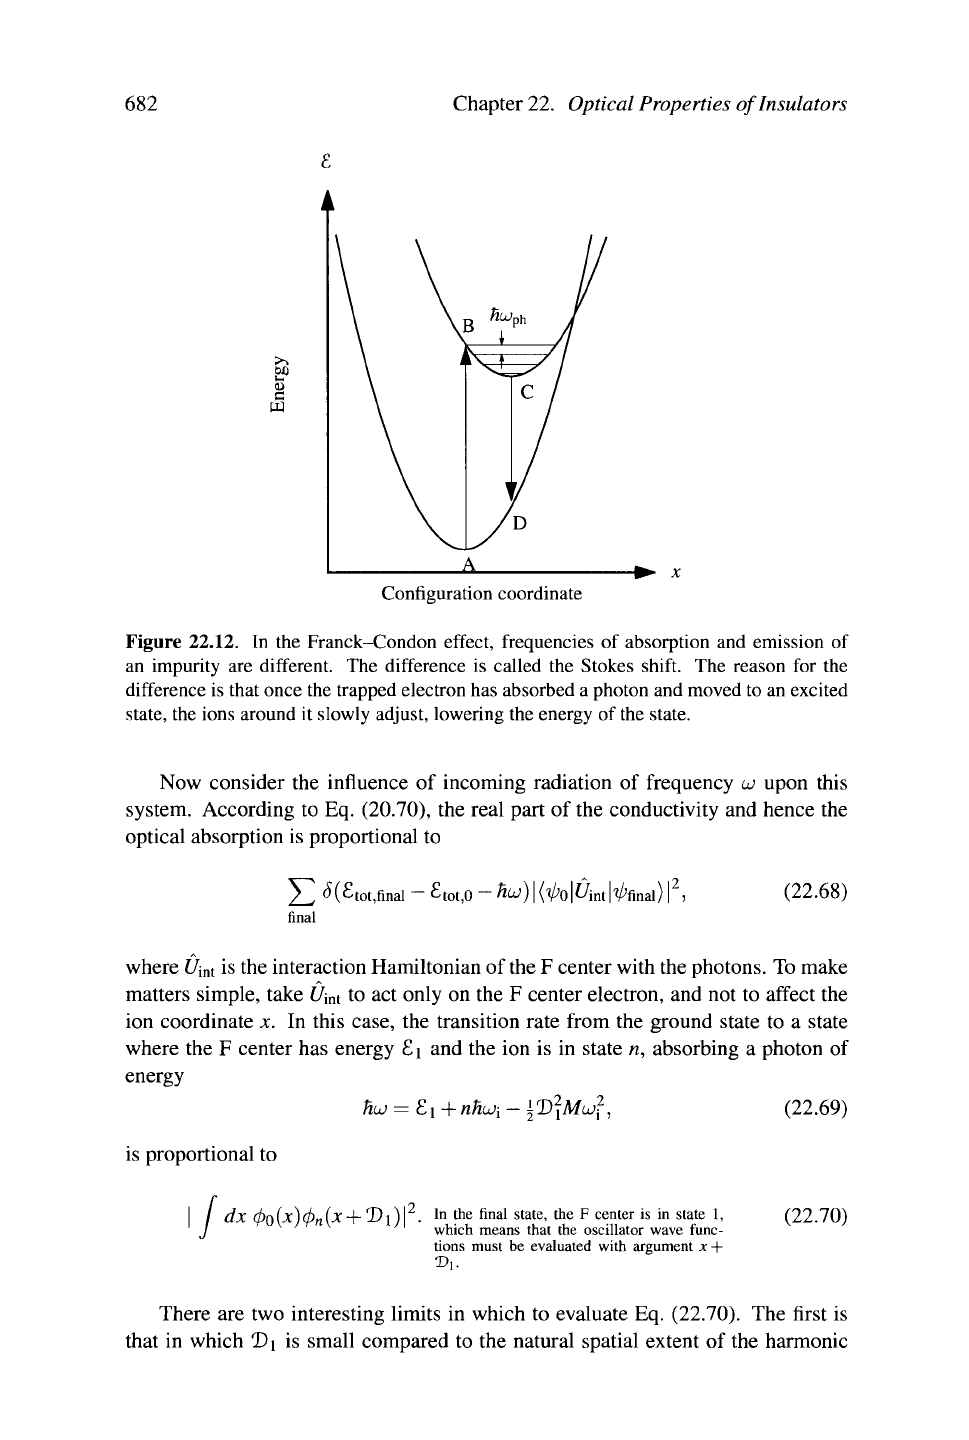
Figure 22.12.
In the
Franck-Condon effect, frequencies
of
absorption and emission
of
an impurity
are
different. The difference
is
called the Stokes shift. The reason
for the
difference is that once the trapped electron has absorbed a photon and moved to an excited
state,
the ions around
it
slowly adjust, lowering the energy of
the
state.
Now consider
the
influence
of
incoming radiation
of
frequency to upon this
system. According
to
Eq. (20.70), the real part
of
the conductivity and hence
the
optical absorption
is
proportional
to
/
, #(£tot,final
final
■
£tot,0 -fo^K^ul^intl^final)
(22.68)
where J7i
nt
is the interaction Hamiltonian of
the
F
center with the photons. To make
matters simple, take U\
nt
to act
only
on
the
F
center electron, and not
to
affect
the
ion coordinate
x. In
this case,
the
transition rate from
the
ground state
to a
state
where
the F
center has energy
£ i
and the
ion is in
state
n,
absorbing
a
photon
of
energy
Hu
= £i
+nhtOi —
^V^Mcjj
,
is proportional
to
/
dx(f)Q{x)4>
n
{x
+
T>\
In
the
final state,
the F
center
is in
state
1,
which means that
the
oscillator wave func-
tions must
be
evaluated with argument
x +
(22.69)
(22.70)
There
are
two interesting limits
in
which
to
evaluate Eq. (22.70).
The
first
is
that
in
which
T>\
is
small compared
to the
natural spatial extent
of
the harmonic