Mavko G., Mukerji T., Dvorkin J. The Rock Physics Handbook
Подождите немного. Документ загружается.

In the quasi-static limit the effective homogeneous poroelastic medium is itself
transversely anisotropic with effective constants given by (Gelinsky and Shapiro, 1997a):
B ¼ b
d
f
2
d
c
1
d
þ f
2
d
c
1
d
2
c
1
d
1
þ
P
2
R
C ¼ c
1
d
1
þ
Q
2
R
F ¼ c
1
d
1
f
d
c
1
d
þ
PQ
R
D ¼ d
1
d
1
M ¼ m
d
hi
P ¼ R
p
r
DE
q
r
f
d
c
1
d
DE
þ
q
r
c
1
d
DE
c
1
d
1
f
d
c
1
d
Q ¼ R
q
r
c
1
d
DE
c
1
d
1
R ¼ r
1
þ
q
2
r
2
c
1
d
q
r
c
1
d
DE
2
c
1
d
1
1
The symbol
hi
indicates volumetric averages of the enclosed properties. When the
individual thin layers are transversely isotropic with a horizontal symmetry axis (x
1
),
the effective medium has orthorhombic symmetry and is described by the stiffness
tensor A
ij
with nine independent constants and four additional Biot parameters,
P
1
, P
2
, P
3
, and R. The layers themselves are characterized by the transversely
isotropic coefficients, b
d
, c
d
, f
d
, d
d
, and m
d
, (and a
d
¼2m
d
þb
d
), and three additional
poroelastic constants, p, q, and r, with x
1
as the symmetry axis instead of x
3
. The
effective constants are given by (Gelinsky and Shapiro, 1997a):
A
11
¼ c
d
hi
þ
f
d
a
d
2
a
1
d
1
f
2
d
a
d
þ
P
2
1
R
A
22
¼ a
d
hi
þ
b
d
a
d
2
a
1
d
1
b
2
d
a
d
þ
P
2
2
R
A
33
¼ a
1
d
1
þ
P
2
3
R
A
12
¼ f
d
hi
þ
f
d
a
d
b
d
a
d
a
1
d
1
f
d
b
d
a
d
þ
P
1
P
2
R
A
13
¼
f
d
a
d
a
1
d
1
þ
P
1
P
3
R
A
23
¼
b
d
a
d
a
1
d
1
þ
P
2
P
3
R
A
44
¼
1
m
d
1
A
55
¼
1
d
d
1
217 4.15 Poroelastic Backus average
A
66
¼hd
d
i
P
1
¼ R
q
r
DE
pf
d
ra
d
þ
p
ra
d
f
d
a
d
a
1
d
1
P
2
¼ R
p
r
DE
pb
d
ra
d
þ
p
ra
d
b
d
a
d
a
1
d
1
P
3
¼ R
p
ra
d
a
1
d
1
R ¼
1
r
þ
p
2
r
2
a
d
p
ra
d
2
a
1
d
1
!
1
When the individual thin layers are isotropic, the effective constants for the equiva-
lent transversely isotropic homogeneous poroelastic medium can be expressed in
terms of averages of the Lame
´
constants l
d
and m
d
of the dry frame of the layers. For
isotropic layers, a
1
¼ a
2
¼ a ¼ 1 K
d
=K
0
. In the quasi-static limit the effective
poroelastic constants are:
B ¼ 2
l
d
m
d
l
d
þ 2m
d
þ
l
d
l
d
þ 2m
d
2
1
l
d
þ 2m
d
1
þ
P
2
R
C ¼
1
l
d
þ 2m
d
1
þ
Q
2
R
F ¼
1
l
d
þ 2m
d
1
l
d
l
d
þ 2m
d
þ
PQ
R
D ¼ m
1
d
1
M ¼ m
d
hi
P ¼R 2
am
d
l
d
þ 2m
d
þ
a
l
d
þ 2m
d
l
d
l
d
þ 2m
d
1
l
d
þ 2m
d
1
!
Q ¼R
a
l
d
þ 2m
d
1
l
d
þ 2m
d
1
R ¼ r
1
þ
a
2
l
d
þ 2m
d
a
l
d
þ 2m
d
2
1
l
d
þ 2m
d
1
"#
1
Uses
These equations can be used to model a finely stratified heterogeneous poroelastic
medium as an effective homogeneous anisotropic poroelastic medium.
Assumptions and limitations
All materials are linear and poroelastic.
Layer thicknesses are much smaller than the seismic wavelength. A rule of thumb is
that the wavelength must be at least ten times the layer thickness.
218 Effective elastic media: bounds and mixing laws
4.16 Seismic response to fractures
Synopsis
One approach to modeling the effects of fractures on the elastic properties of rocks is
to represent them as thin layers for which the elastic moduli are smaller (softer) than
those of the unfractured background rock. The soft fracture layer modulus represents
the extra compliance of the fracture relative to the background rock. When the
seismic wavelength is long compared with the layer thickness and fracture spacing,
then the overall elastic response of a parallel array of such fracture layers can be
estimated using the Backus (1962) average (Section 4.13) (Hudson et al., 1996;
Schoenberg, 1980; Schoenberg and Douma, 1988; Hudson and Liu, 1999).
If the thickness of the weak fracture layer is h, and the fracture layer P-wave
modulus and shear modulus are M
f
and m
f
, respectively, then the total normal and
shear displacements across the thin layer under normal and shear stresses, s
n
and s
t
,are
d
n
¼
n
h=M
f
d
t
¼
t
h= 2m
f
ðÞ:
The fracture normal and shear compliances, Z
n
and Z
t
, can be defined as
1
Z
n
¼
@
n
@d
n
¼
M
f
h
;
1
Z
t
¼
@
t
@d
t
¼
2m
f
h
where Z
n
and Z
t
have units of (stress/length)
1
. By defining these fracture com-
pliances, then at long wavelengths the fracture layer can be thought of as a plane of
weakness, across which displacement discontinuities, d
n
and d
t
, occur when stress is
applied. Hence, these are often referred to as displacement discontinuity models.
Quasi-static fracture compliance
Both empirical and model-based methods have been applied to estimating values of
fracture compliance (and its reciprocal the fracture stiffness). Jaeger et al. (2007) give
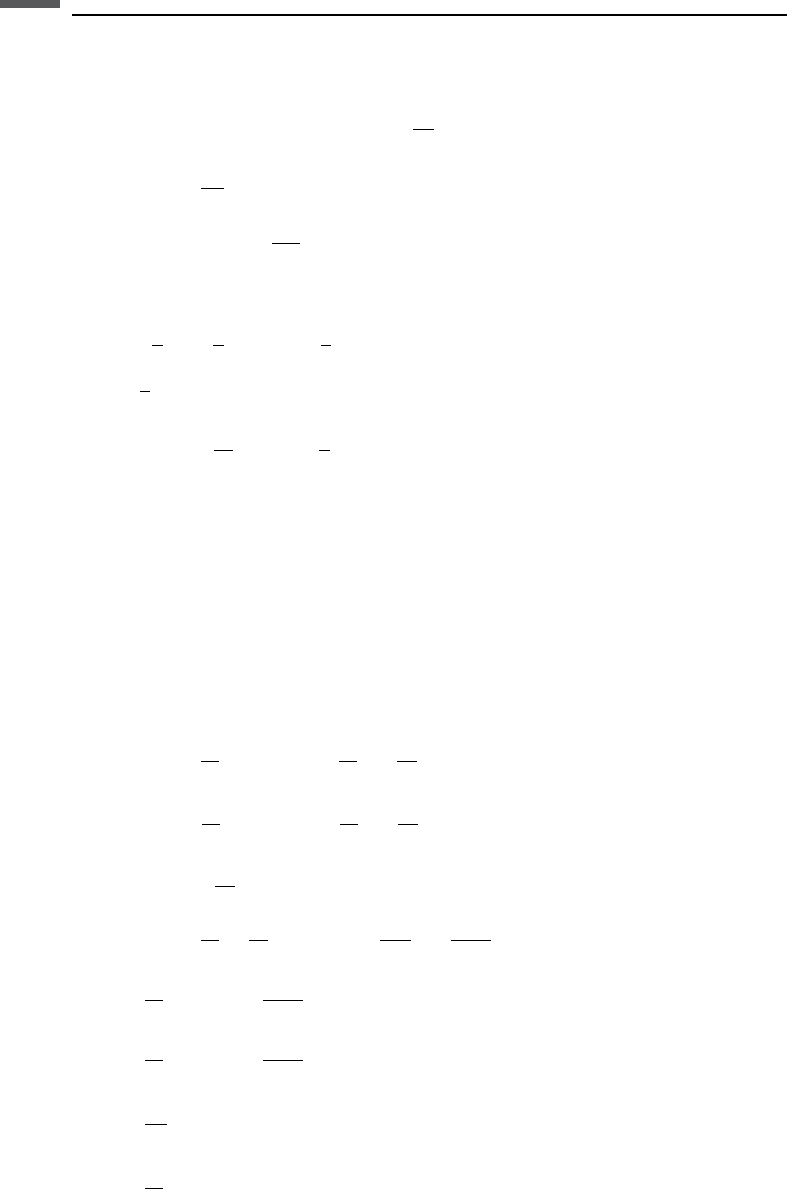
an excellent summary. Myer (2000) represented joint deformation using the solution
for the deformation of coplanar two-dimensional elliptical cavities (Figure 4.16.1)
from Sneddon and Lowengrub (1969):
Z
n
¼
dd
n
d
n
¼
41 nðÞa
pm 1 rðÞ
ln sec
p
2
1 rðÞ
hi
where m is the rock shear modulus, n is the Poisson ratio, r is the fractional area of
contact of the crack faces, a is the crack length, and b ¼a/(1 r) is the center-to-
center crack spacing. With this model, crack closure under stress can be modeled
using a distribution of crack aspect ratios, a, with a corresponding distribution of
closing stresses (Section 2.9 )
close
p
21 nðÞ
am
0
219 4.16 Seismic response to fractures
Hence, as normal compressive stress increases, a fraction of the cracks close, the
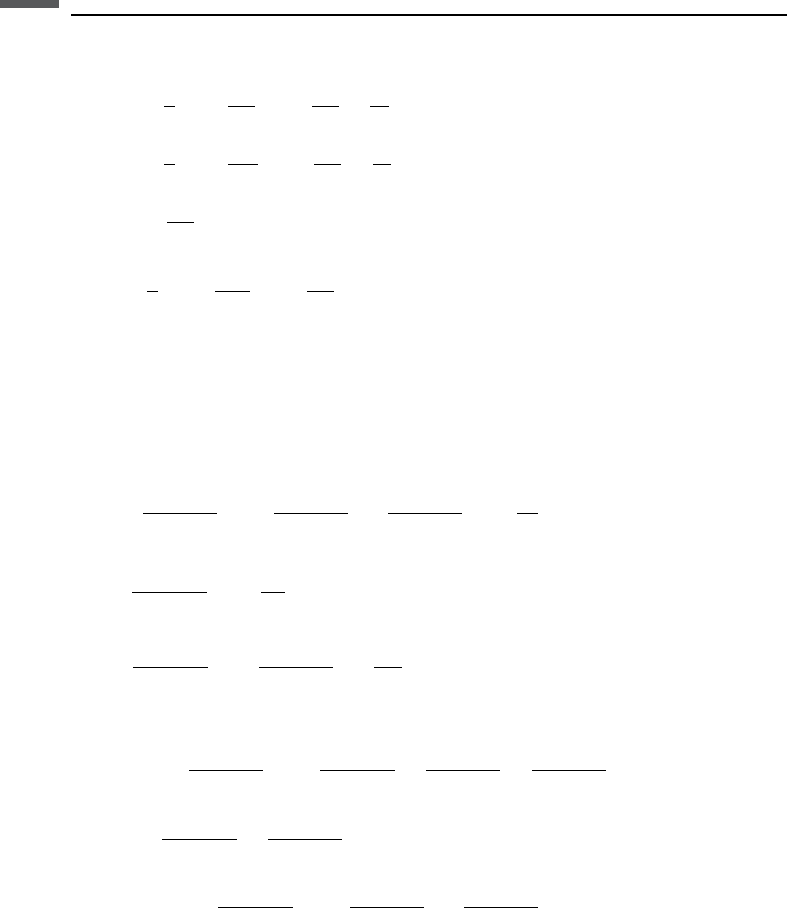
contact area grows, and the fracture stiffens. Delameter et al. (1974) solved the
related problem of the deformation of a doubly periodic array of cracks (Figure
4.16.2), which represents an extension of the Myer model to a set of parallel fractures.
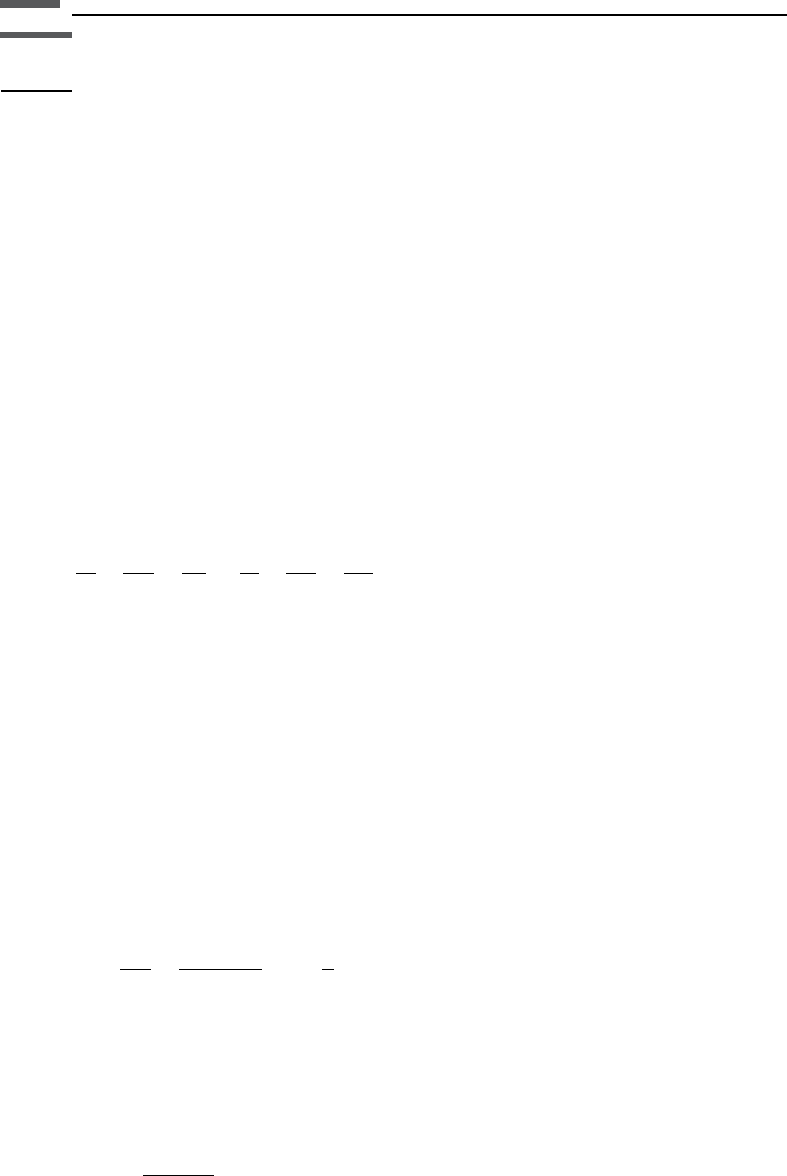
Mavko and Nur (1978) modeled the deformation of two-dimensional nonelliptical
cracks (Figure 4.16.3). They showed that the deformation under infinitesimal incre-
ments of stress is identical to the deformation of an elliptical crack of the same length;
hence, the crack stiffness of the models in Figures 4.16.1 and 4.16.3 will be the same.
An important difference of the nonelliptical cracks is that under finite compressive
stress, the cracks shorten, leading to increased contact area and fracture stiffening.
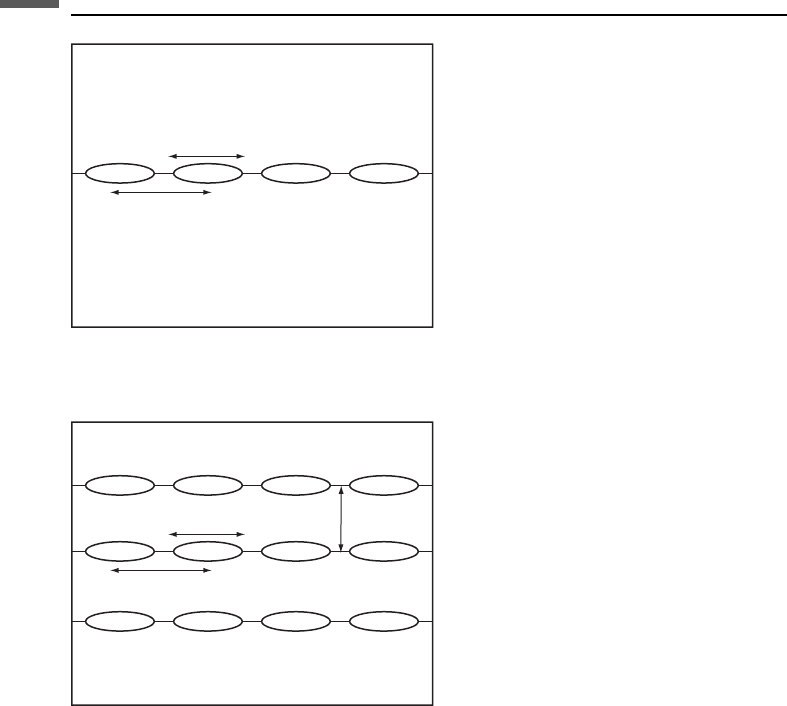
Mavko and Nur also gave the solution for a nonelliptical crack that makes contact at a
midpoint (Figure 4.16.4) before closing.
Another set of theoretical models represents the fracture as a distribution of Hertzian
contacts (Section 5.4) of random heights (Greenwood and Williamson, 1966;White,
1983; Brown and Scholz, 1986; Jaeger et al., 2007).
a
b
Figure 4.16.1 Representation of a partially open fracture with coplanar two-dimensional
elliptical cracks.
a
b
c
Figure 4.16.2 Representation of parallel partially open fractures with a doubly periodic
array of two-dimensional elliptical cracks.
220 Effective elastic media: bounds and mixing laws
Based on laboratory measurements of joint closure, Goodman (1976) proposed an
empirical stress–displacement function
n
¼
0
1 þ
d
n
d
m
d
n
t
; 0 d
n
< d
m
where s
0
is an initial reference stress at d
n
¼0, d
m
is the maximum possible closure,
and t is an empirical exponent. Bandis et al. (1983) proposed a simpler form
n
¼
1
Z
0
d
m
d
n
d
m
d
n
leading to the fracture compliance
1
Z
n
¼
d
n
dd
n
¼
1
Z
0
1 þ
Z
0
n
d
m
2
where Z
0
is the compliance at zero stress.
Figure 4.16.4 Representation of a partially open fracture with nonelliptical two-dimensional
cracks that make multiple contacts under normal compression.
a
b
Figure 4.16.3 Representation of a partially open fracture with nonelliptical two-dimensional
cracks with tapered ends.
221 4.16 Seismic response to fractures

As discussed in Section 4.10, Hudson and Liu (1999) estimated the compliance of
rough joint faces in contact using two models. In one model they represent the
fracture as a planar distribution of small circular cracks with first-order normal and
shear compliances equal to
Z
n
¼
g
S
a
3
m
U
3
¼
ra
pm
U
3
Z
¼
g
S
a
3
m
U
1
¼
ra
pm
U
1
where g
S
is the number of cracks per unit area of the fracture plane, a is the crack
radius, r is the fraction of the fracture plane that is not in contact, and m is the
unfractured rock shear modulus. For dry cracks
U
1
¼
16 l þ 2mðÞ
33l þ 4mðÞ
U
3
¼
4 l þ 2mðÞ
3 l þ mðÞ
Hence for dry fractures,
Z
n
Z
dry
¼ 1
n
2
where n is the Poisson ratio of the unfractured rock, or Z
n-dry
Z
-dry
. For “weak”
inclusions (i.e., when ma=½K
0
þ
4
3
m
0
is of the order of 1 and is not small enough to be
neglected)
U
1
¼
16ðl þ2mÞ
3ð3l þ4mÞ
1
ð1 þ MÞ
U
3
¼
4ðl þ 2mÞ
3ðl þ mÞ
1
ð1 þ k Þ
where
M ¼
4m
0
pam
ðl þ 2mÞ
ð3l þ 4mÞ
k ¼
½K
0
þ
4
3
m
0
ðl þ 2mÞ
pamðl þ m Þ
and K
0
and m
0
are the bulk and shear modulus of the inclusion material. Hence, for
fluid-filled fractures (m
0
¼0)
Z
Z
n
wet
¼
Z
Z
n
dry
1 þ k
1 þ M
In general, shear fracture compliance models depend very much on the amount
of shear displacement. Large shear displacement is thought to involve interference of
222 Effective elastic media: bounds and mixing laws

asperities on opposite fracture faces (Jaeger et al., 2007). At small normal stresses,
asperities might slide over one another, causing dilatancy in the fracture zone. At
larger normal stresses, asperities need to fail in either brittle or plastic fashion to
accommodate slip.
Infinitesimal shear deformation in the fault zone can be modeled analogously to the
normal deformation discussed above. Open cracks undergo shear deformation, while
welded or frictional contacts have zero slip. The two-dimensional models for normal
fracture deformation illustrated in Figures 4.16.1–4.16.4 can be scaled for shear
deformation. For example, using dislocation analysis (Section 2.9), both normal
and in-plane shear of two-dimensional cracks can be represented using edge disloca-
tions, and hence the normal and shear fracture stiffnesses are equal for dry fractures.
In general, a reasonable estimate of the infinitesimal shear compliance can be obtained
from the infinitesimal normal compliance using the Hudson and Liu expressions
for Z
/ Z
n.
Dynamic response
The displacement discontinuity model has been applied to derive the dynamic
response of waves impinging on the fracture plane (Kendall and Tabor, 1971;
Schoenberg, 1980; Angel and Achenbach, 1985;Pyrak-Nolteet al., 1990). Schoenberg
(1980) gives expressions for the frequency-dependent P-wave reflection R(o) and
transmission T(o) coefficients for normal incidence:
RðoÞ¼
i$
1 i $
TðoÞ¼
1
1 i $
$ ¼
oZ
n
V
P
2
where $ is a dimensionless frequency, o is the angular frequency, r is the density,
V
P
is the P-wave velocity, and Z
n
is the infinitesimal fracture normal compliance.
R(o) and T(o) are frequency-dependent and complex. An excellent review is given
by Jaeger et al. (2007).
Use
The models presented here can be used to predict the effects of joints and fractures on
the static and dynamic elastic properties of rocks.
Assumptions and limitations
The models presented here assume that the unfractured rock mass is isotropic, linear,
and elastic. The joints and fractures are assumed to be planar.
223 4.16 Seismic response to fractures

4.17 Bound-filling models
Synopsis
The Voigt–Reuss (Section 4.2) and Hashin–Shtrikman–Walpole (see Section 4.1)
bounds yield precise limits on the maximum and minimum possible values for the
effective bulk and shear moduli of an isotropic, linear, elastic composite. Specifically,
for a mixture of two components, the Hashin–Shtrikman–Walpole bounds can be
written as
K
HS
¼ K
1
þ
f
2
ðK
2
K
1
Þ
1
þ f
1
ðK
1
þ
4
3
m
m
Þ
1
ð4:17:1Þ
m
HS
¼ m
1
þ
f
2
ðm
2
m
1
Þ
1
þ f
1
m
1
þ
1
6
m
m
9K
m
þ8m
m
K
m
þ2m
m
hi
1
ð4:17:2Þ
where subscripts 1 and 2 refer to properties of the two components, having bulk
moduli, K
1
, K
2
, shear moduli, m
1
, m
2
, and volume fractions f
1
and f
2
. Most commonly,
these bounds are applied to describe mixtures of mineral and pore fluid, as illustrated
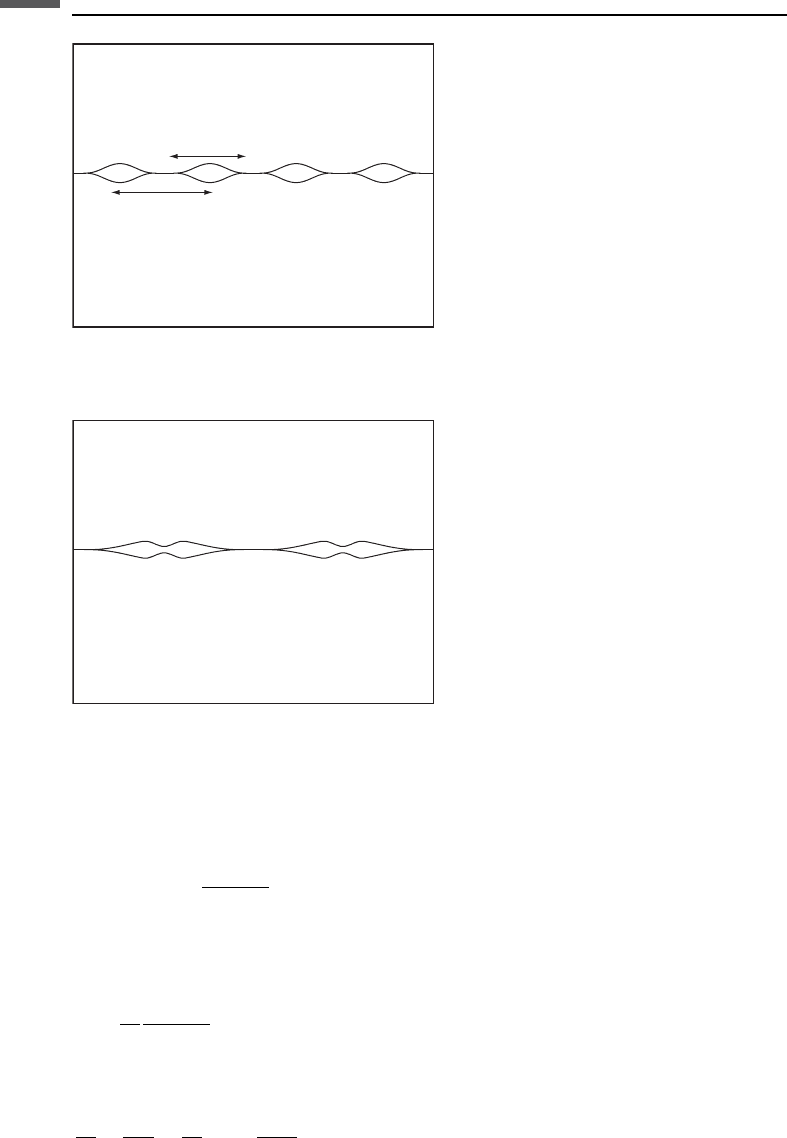
in Figure 4.17.1. Equations (4.17.1) and (4.17.2) yield the upper bounds when K
m
and
m
m
are the maximum bulk and shear moduli of the individual constituents, and
the lower bounds when K
m
and m
m
are the minimum bulk and shear moduli of the
constituents, respectively. The maximum (minimum) shear modulus might come from
a different constituent from the maximum (minimum) bulk modulus. For example, this
would be the case for a mixture of calcite K ¼ 71 GPa; m ¼ 30 GPaðÞand quartz
K ¼ 37 GPa; m ¼ 45 GPaðÞ.
Note
Equations (4.17.1) and (4.17.2) simplify to the Hashin–Shtrikman bounds (Section
4.1) when one constituent has both the maximum bulk and shear moduli, while the
other constituent has the minimum bulk and shear moduli.
The modified Hashin–Shtrikman bounds use exactly the same equations shown
above. However, with modified bounds the constituent end members are selected
differently, such as a mineral mixed with a fluid–solid suspension (Figure 4.17.1)ora
stiffly packed sediment mixed with a fluid–solid suspension. The critical-porosity
model (Nur et al., 1991, 1995), described in Section 7.1, identifies a critical porosity,
c
, that separates load-bearing sediments at porosities <
c
and suspensions at
porosities >
c
. Modified Hashin–Shtrikman equations (or modified Voigt–Reuss
equations) can be constructed to describe mixtures of mineral with the unconsolidated
fluid–solid suspension at critical porosity. The modified upper Hashin–Shtrikman
curve has been observed empirically to be a useful trend line describing, for example,
224 Effective elastic media: bounds and mixing laws
how the elastic moduli of clean sandstones evolve from deposition through compaction
and cementation. The modified upper Hashin–Shtrikman curve, constructed as such,
is not a rigorous bound on the elastic properties of clean sand, although sandstone
moduli are almost always observed to lie on or below it.
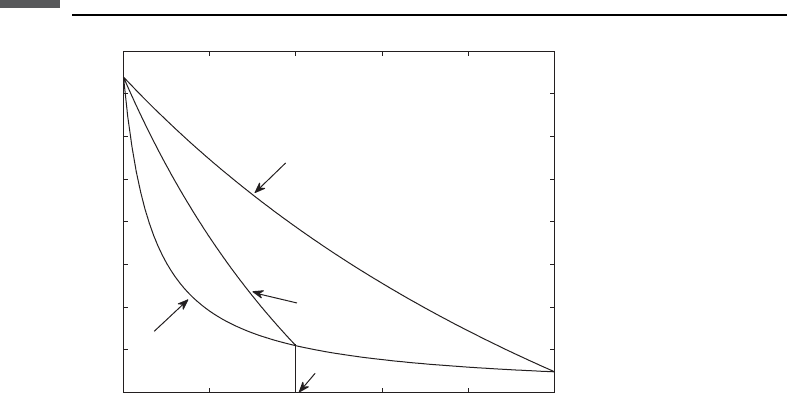
The Voigt–Reuss–Hill average (Section 4.4) is an estimate of elastic modulus
defined to lie exactly half-way between the Voigt upper and Reuss lower bounds
(Figure 4.17.2). A similar estimate can be constructed to lie half-way between the
upper and lower Hashin–Shtrikman bounds (Figure 4.17.2). These two estimates have
little practical value, except in the case where the constituent end-members are
elastically similar, as with a mixture of minerals without pore space. In this latter
case, an average of upper and lower bounds yields a useful estimate of the average
mineral moduli.
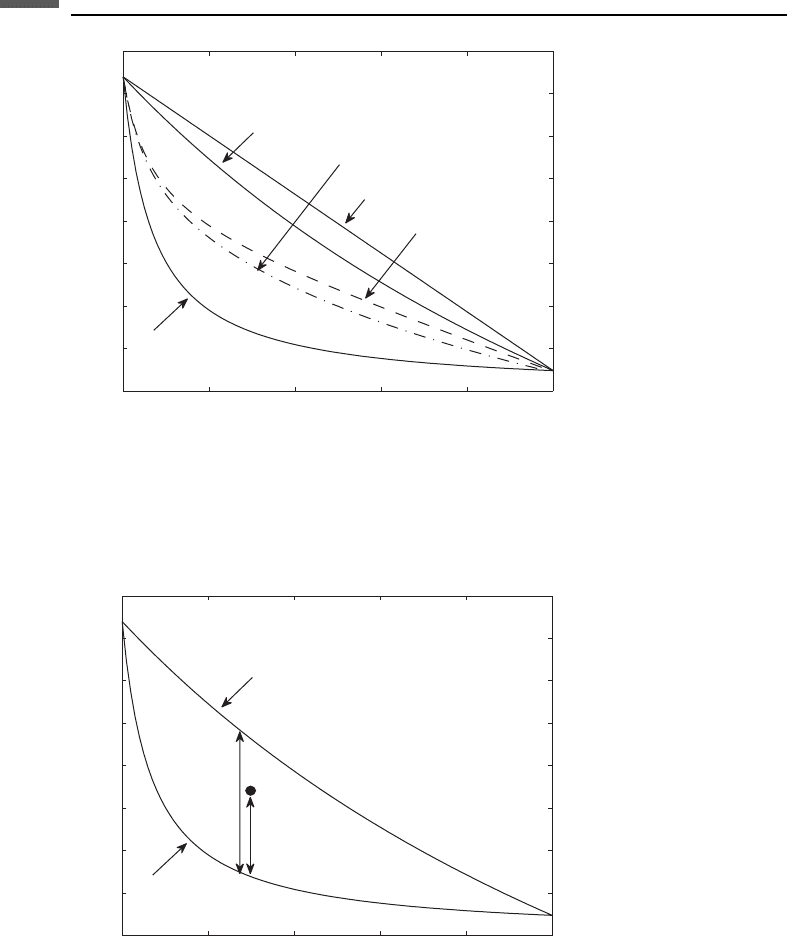
Marion’s (1990) bounding average method (BAM) of fluid substitution (Section
6.9) uses the position of porosity–modulus data between the bounds as an indication
of rock stiffness. In Figure 4.17.3, the Hashin–Shtrikman upper and lower bounds are
displayed for mixtures of mineral and water. The data point A lies a distance d above
the lower bound, while D is the spacing between the bounds at the same porosity.
In the bounding average method, it is assumed that the ratio d/D remains constant if
the pore fluid in the rock is changed, without changing the pore geometry or the
stiffness of the dry frame. Though not theoretically justified, the BAM method
sometimes gives a reasonable estimate of high-frequency fluid-substitution behavior.
Fabricius (2003) introduced the isoframe model to describe behavior between the
modified upper and lower Hashin–Shtrikman bounds. In this model, the modified
upper Hashin–Shtrikman curve is assumed to describe the trend of sediments that
0 0.2 0.4 0.6 0.8 1
0
5
10
15
20
25
30
35
40
Porosit
y
Bulk modulus (GPa)
Hashin–Shtrikman
upper bound
Hashin–Shtrikman
lower bound
Modified upper
Hashin–Shtrikman
bound
Critical porosity
Figure 4.17.1 Hashin–Shtrikman and modified Hashin–Shtrikman bounds for bulk modulus
in a quartz–water system.
225 4.17 Bound-filling models
become progressively more compacted and cemented as they trend away from the
lower Reuss average ( Figure 4.17.4) – an empirical result. It is assumed that these
rocks contain only grains that are load-bearing with good grain-to-grain contacts.
Sediments that fall below the modified upper bound are assumed to contain inclu-
sions of grain–fluid suspensions, in which the grains are not load-bearing. A family of
0 0.2 0.4 0.6 0.8 1
0
5
10
15
20
25
30
35
40
Porosity
Bulk modulus (GPa)
Hashin-Shtrikman
lower bound
Hashin–Shtrikman
upper bound
d
D
A
Figure 4.17.3 The bounding average method. It is assumed that the position of a data
point A, described as d/D relative to bounds, is a measure of the pore stiffness.
0 0.2 0.4 0.6 0.8 1
0
5
10
15
20
25
30
35
40
Porosity
Bulk modulus (GPa)
Hashin–Shtrikman
lower bound
Voigt
Voigt–Reuss–Hill
Hashin–Shtrikman
upper bound
Hashin–Shtrikman average
Figure 4.17.2 Hashin–Shtrikman and Voigt–Reuss bounds for bulk modulus in a quartz–
water system. The Voigt–Reuss–Hill curve is an average of the Voigt upper and Reuss lower
bounds. The Hashin–Shtrikman average curve is an average of the Hashin–Shtrikman upper and
lower bounds.
226 Effective elastic media: bounds and mixing laws