Molina-Par?s C., Lythe G. (editors) Mathematical Models and Immune Cell Biology
Подождите немного. Документ загружается.

6 Modelling Intravital Two-Photon Data 123
Imaging Lymphocyte Migration and Interaction
Intravital Microscopy
Optical multi-photon microscopy is today’s method of choice for in vivo imaging
of single-cell dynamics and cellular interactions within intact tissue. Conventional
methods employing fluorescence techniques, such as wide-field and confocal mi-
croscopy, are based on light excitations of fluorophores by single photons. A flu-
orophore is a functional molecule which absorbs and re-emits light at different
wavelengths. The single-photon excitation typically requires photon wavelengths in
the order of 400 nm corresponding to photon energies that give rise to phototoxicity
and strong scattering in biological tissue.
Multi-photon microscopy is based on the virtually simultaneous light excitation
by two or more photons. For example, in two-photon microscopy the fluorophore is
excited by two photons, each of which contributes one half of the energy required to
induce fluorescence. The required photon density at the focal spot of the microscope
objective is generated by a pulsed laser, which is adjusted such that the density is
sufficiently high but yet not so high as to damage the biological sample. The main
advantage of this method is that using low-energetic photons with long wavelengths
in the order of 800 nm strongly decreases the absorption and scattering of light in
biological tissue. Moreover, since the impact of phototoxicity and photobleaching is
negligible for infrared photons, imaging up to millimeter-depths into the biological
tissue can be realized without inducing significant damage to the biological sample.
As with conventional microscopes, image sequences can be built up by scanning
the focal spot across the sample. Since the requirement on the photon density for the
induction of multi-photon fluorescence is only met within the confined volume of
the focal spot, the resulting images are free of out-of-focus fluorescence and there-
fore have higher image contrast as compared to single-photon techniques. With the
help of advanced tracking software, individual cells can be identified and followed
in the three-dimensional stacks of image sequences. This makes laser scanning
multi-photon microscopy the state-of-the-art technique for intravital cell imaging
in biological tissue with high spatial and temporal resolution.
Exploring Dynamic Cell Properties
At each time point, multi-photon imaging yields data on the position and on the
geometric shape of every cell within the three-dimensional focal spot. For an image
sequence consisting of N C 1 measurements that are recorded with the time step
t, the position of the ith cell, .x
i
.n/; y
i
.n/; z
i
.n//, is determined at the time points
t
n
D nt with n D 0;1;2;:::;N. Similarly, the geometric shape of the ith cell

124 M.T. Figge and M. Meyer-Hermann
may be quantified by a shape index s
i
.n/ characterizing the time-dependent cell
geometry. The data on the cell track and cell shape can be combined into the lists
T
i
0
@
x
i
.0/ x
i
.1/ x
i
.2/ ::: x
i
.N /
y
i
.0/ y
i
.1/ y
i
.2/ ::: y
i
.N /
z
i
.0/ z
i
.1/ z
i
.2/ ::: z
i
.N /
1
A
and S
i
s
i
.0/ s
i
.1/ s
i
.2/ ::: s
i
.N /
(6.1)
for each cell i D 1;2;:::;I, respectively.
Various definitions of the shape index may be envisaged. For example, repre-
senting the cell geometry by an ellipsoid with equatorial radii a, b,andc that is
approximated by an oblate (a D b>c) or a prolate (a D b<c) spheroid, the
shape index may be defined as the ratio of the long to the short axis. This gives rise
to values s
i
.n/ 1,wheres
i
.n/ D 1 for a spherical and s
i
.n/ > 1 for an elongated
cell shape.
The cell migration is characterized by quantities that can be computed from the
cell track lists T
i
. These lists may be viewed as 3 N matrices, where the nth
column contains the position vector of the ith cell at time t
n
:
R
i
.n/
0
@
x
i
.n/
y
i
.n/
z
i
.n/
1
A
: (6.2)
Observables of interest are often averaged over all monitored cells. This is done by
summation of the corresponding quantity for each cell i and division by their total
number I. In passing we note that for practical reasons the number of cells may be
a function of time, I D I.n/, since cells may exit the focal spot at longer times
and cannot be imaged anymore. The fewer remaining cells give rise to standard
deviations of the averaged quantities that are increasing with the measurement time.
The time-dependent displacement vector of a cell relative to its starting point is
given by
r
i
.n/ R
i
.n/ R
i
.0/ (6.3)
and is used in the calculation of the mean cell velocity
hv
i;m
.n/i
hr
i
.n/ihr
i
.n m/i
mt
(6.4)
at times t
n
D nt with n m. Here, the brackets h:::i denote the average over
all monitored cells. Note that v
i;m
.n/ depends on the choice of the time interval
mt and the interpretation of a cell’s speed, v
i;m
.n/ Djv
i;m
.n/j, may actually
lead to wrong conclusions. For small time intervals mt the cell speed may be
overestimated due to the jitter motion of otherwise stationary cells. On the other
hand, if the cells perform random walk migration, the actual cell speed may be
underestimated for long time intervals.
Random walk migration refers to cells that do not move unidirectional but ran-
domly change their migration direction. These random changes may either occur
at each time step of the measurement, or only after a number of time steps have

6 Modelling Intravital Two-Photon Data 125
elapsed. In the latter case, a directional persistence time exists corresponding to the
time interval t
p
during which cells migrate in the same direction before randomly
turning into another direction.
Unidirectional migration and random walk migration can be distinguished by
analyzing the time-dependence of the mean displacement hjr
i
.n/ji. For cells per-
forming unidirectional migration, e.g. by following chemokine gradients, the mean
cell velocity is a constant, such that
hjr
i
.n/ji D hjv
i;n
.n/ji t
n
: (6.5)
In other words, hjr
i
.n/ji equals exactly the mean path length hl
i
.n/i, which is de-
fined by:
hl
i
.n/i
1
n
n
X
n
0
D1
hjr
i
.n
0
/ r
i
.n
0
1/ji: (6.6)
In contrast, for cells performing random walk migration the mean path length be-
comes significantly larger than the mean displacement, hl
i
.n/ihjr
i
.n/ji for
times t
n
t, since cells randomly change their migration direction and even-
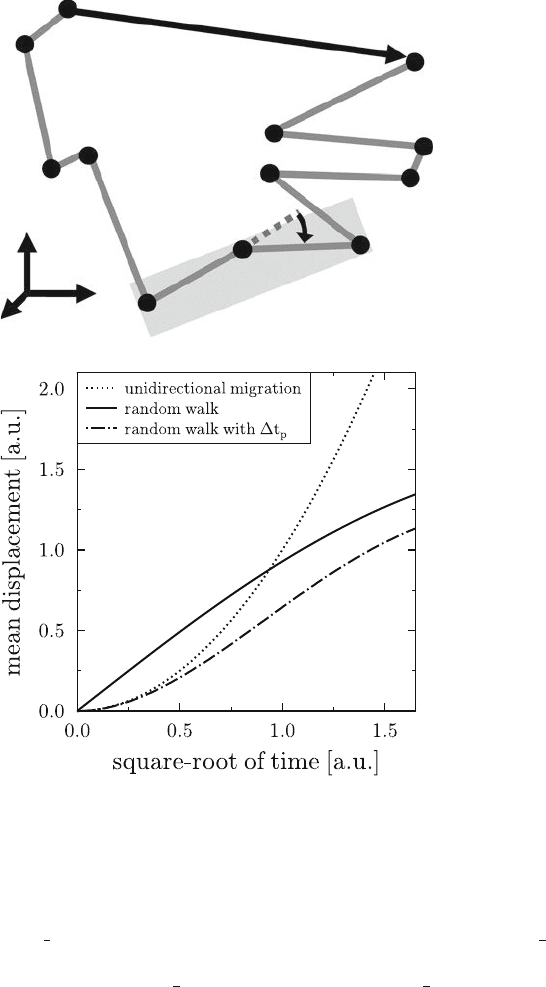
tually re-approach their starting point. This is schematically shown in Fig. 6.1a. The
corresponding mean displacement does not scale linearly with time, but only with
the square-root of time,
hjr
i
.n/ji D
p
2DM
p
t
n
; (6.7)
where the proportionality constant depends on the system’s spatial dimension D and
the motility coefficient M . Note that random walk migration with a directional per-
sistence time is a combination of unidirectional migration on small time scales and
random walk migration on large time scales. The time scale is set by the directional
persistence time: at times t
n
<t
p
, hjr
i
.n/ji scales linear with time but assumes
scaling with the square-root of time for t
n
>t
p
. The time-dependence of the mean
displacement is shown in Fig. 6.1b for the three different migration behaviours.
Taken together, multi-photon imaging provides a firm data basis to characterize
the migration behaviour and the shape dynamics of cells in intact biological tissue.
Statistical Cell Track Models
Statistical cell track models aim at re-constructing experimentally observed cell
tracks in order to identify underlying migration mechanisms. In this modelling
approach cells are treated as independently migrating point particles that are char-
acterized by their speed and polarity. The re-construction of cell tracks is achieved
by calculating the position vector r
i
.nC1/ of the ith cell at time t
nC1
D .nC1/t
from its position r
i
.n/ and its velocity v
i
.n/ at time t
n
:
r
i
.n C 1/ D r
i
.n/ C tv
i
.n/ : (6.8)
126 M.T. Figge and M. Meyer-Hermann
y
x
a
b
z
1
0
11
9
8
6
5
7
10
4
3
2
l
i
(1)
l
i
(2)
l
i
(3)
l
i
(10)
r
i
(11)
α
i
(5)
l
i
(7)
l
i
(5)
l
i
(4)
l
i
(6)
l
i
(8)
l
i
(9)
l
i
(11)
Fig. 6.1 Schematic representation of a cell track and the cellular migration behaviour in terms
of the mean displacement. (a): The first 11 time steps of a three-dimensional cell track are shown.
The cell performs random walk migration, where the length of the displacement vector r
i
.11/
is much smaller than the path length l
i
.11/. Three cell positions at times t
n1
to t
nC1
span a
plane that defines the turning angle ˛
i
.n/ between the displacement vectors r
i
.n/ r
i
.n 1/
and r
i
.n C1/ r
i
.n/, as indicated for n D 5.(b): The cellular migration behaviour in terms of
the mean displacement as a function of the square-root of time. Cells performing unidirectional
migration scale like
p
t
2
(dotted line), whereas random walk migration scales linear with
p
t
(solid line). Random walk migration with a directional persistence time t
p
(dashed-dotted line)
is characterized by a scaling behaviour
p
t
2
at times smaller than t
p
and
p
t for larger times.
If the migration is constrained to a finite volume, the mean displacement curves level off after
sufficiently long times. This is depicted for the two curves showing random walk migration
6 Modelling Intravital Two-Photon Data 127
Thus, at each time step t of the measurement, the new cell position is calculated
by updating the velocity,
v
i
.n/ D v
i
.n/e
i
.n/ ; (6.9)
in terms of the cell speed v
i
.n/ and the cell polarity vector e
i
.n/. In spherical coor-
dinates the unit vector e
i
.n/ is given by
e
i
.n/ D
0
B
@
sin.#
n
/ cos.'
n
/
sin.#
n
/ sin.'
n
/
cos.#
n
/
1
C
A
; (6.10)
where #
n
2 Œ0; Œ and '
n
2 Œ0; 2Œ denote the spherical angles.
So far we did not specify the procedure according to which (6.8) is updated.
In fact, depending on the available data basis, different procedures may be applied
in different situations. In what follows we review two procedures that have been
applied to re-construct cell tracks for T cells in lymphoid tissue and for B cells in
germinal centres.
T Cell Migration in Lymphoid Tissue
Imaging individual T cells within lymphoid organs has been the subject of vari-
ous studies in recent years [1,10–12]. The experimental results on T cell migration
have been presented in terms of the mean displacement curve as a function of the
square-root of time. In general, these curves show the characteristics of random walk
migration with a directional persistence time.
Using the statistical cell track model approach, a mathematical analysis was
performed with the goal to estimate values of parameters underlying T cell mi-
gration [2]. In this analysis, the three-dimensional T cell tracks were projected on a
two-dimensional plane by neglecting the z-component of the polarity vector (6.10).
The new polarity vector, which does not have the property of being a unit vector,
reads
e
i
.n/ D
0
B
@
sin.#
n
/ cos.'
n
/
sin.#
n
/ sin.'
n
/
0
1
C
A
: (6.11)
The re-construction of cell tracks was then performed according to (6.8)and(6.9),
where the cell speed was set to a constant value,
v
i
.n/ D v ; (6.12)
for all cells. Furthermore, the time step t was decomposed into the persistence
time t
p
during which cells migrate with constant speed and the re-polarization
time t
r
during which cells do not move but are thought to reposition their
128 M.T. Figge and M. Meyer-Hermann
lamellipods and uropod. After having paused, T cells randomly pick a new direction
of migration, which was realized by choosing new angles #
n
and '
n
from uniform
distributions.
For each parameter set fv;t
p
;t
r
g, a number of 10
6
individual cell tracks
was generated in a randomized fashion. The parameters were explored in the range
v D Œ5; 50 m/min, t
p
D Œ0:5; 20 min, and t
r
D Œ0; 3:5 min and the optimal
values were determined from a fitting procedure to the experimental data.
Combining the T cell tracks of different experimental data sets [1, 10–12]
yielded the optimal values of the parameter set to be fv D 18:8 m/min;t
p
D
2 min;t
r
D 0:5 ming. Thus, T cells perform random walk migration with a per-
sistence time of 2 min and the time for re-polarization is 30 s. Interestingly, under
the constraint that the re-polarization time is neglected, t
r
D 0 min, the optimal
values changed into fv D 16:6 m/min;t
p
D 2 ming. Thus, while the T cell speed
attains a somewhat smaller value, the persistence time does not change. A general
conclusion of this analysis was that the re-polarization time does not play a central
role in improving the agreement with the experimental data. The cell re-polarization
is further discussed below and in Section “Cell Shape Dynamics of Migrating T and
B Cells” within a modelling approach that resolves the shape of migrating cells.
B Cell Trans-Zone Migration in Germinal Centres
The migration of B cells between the light and dark zone in germinal centres was
investigated by several experimental groups using two-photon microscopy [13–15].
All three experimental groups agree that during measurements of 1 h, 5–10%ofthe
observed B cells will have migrated from one zone to the other. Furthermore, the
three experimental groups agree on the interpretation that B cell motility follows
random walk migration with a directional persistence time of about 1 min.
Based on the measured turning angle and speed distributions [13], a statistical
cell track model was applied to check whether the persistent random walk hypoth-
esis can be reconciled with the measured trans-zone migration frequency of B cells
in germinal centres [7]. The persistent random walk hypothesis was incorporated in
the velocity (6.9) by choosing the speed and turning angle independently. In prac-
tice, this was realized by a Monte Carlo acceptance-rejection method that generates
random cell speeds v
i
.n/ and random turning angles ˛
i
.n/ from the respective ex-
perimental distributions [7,13].
It should be noted, however, that the turning angle (see Fig.6.1a) provides infor-
mation on the angle between polarity vectors e
i
.n/ and e
i
.n C 1/ within the same
plane:
˛
i
.n/ D arccos .e
i
.n/ e
i
.n C 1// : (6.13)
Thus, in three spatial dimensions, e
i
.nC1/ is not uniquely determined by (6.13)but
may refer to any point on a cone with axis e
i
.n/ and radius r
˛
i
.n/
Djsin.˛
i
.n//j.
In the spirit of the persistent random walk hypothesis, the point on this circle was
chosen at random from a uniform distribution.
6 Modelling Intravital Two-Photon Data 129
The turning angle and the speed are permanently changing after characteristic
time steps t
p
and t
v
, respectively. A new speed value was randomly drawn from
the corresponding distribution at every time step t D t
v
D 20 s, corresponding
to the time interval between two consecutive speed measurements [13]. The time
step t
p
was determined such that the measured curve of the mean displacement
versus the square-root of time is reproduced. It is important to note that even though
the directional persistence time t
p
is not known a priori, turning angles can never-
theless be drawn from the experimental distribution that was evaluated with a time
resolution of 20 s. It has been shown that the turning angle distribution is extremely
robust and represents a reasonable approximation for different values of t
p
rang-
ing from 20 supto160 s[7].
Re-constructing 10
5
B cell tracks and fitting t
p
under the constraint that the
experimentally observed mean displacement curve is recovered, yields the reason-
able value t
p
D 1:24 min for B cells in wildtype mice. Using this value, it was
confirmed that the persistent random walk hypothesis can be reconciled with the
trans-zone migration frequency for B cells migrating between the light and dark
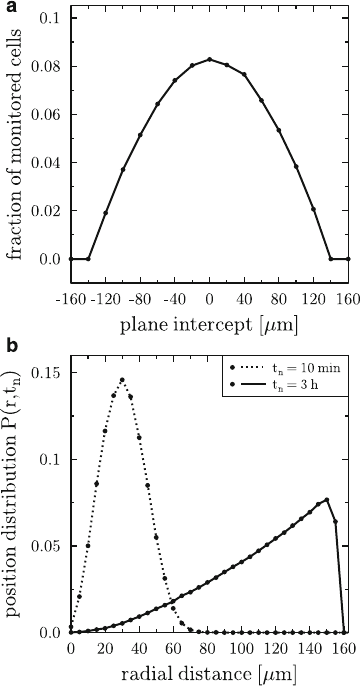
zone in germinal centres. This can be seen in Fig. 6.2a, where we plot the frac-
tion of 10
5
monitored cells that migrate during a one-hour measurement across
the zone boundary of 40 m thickness within a spherical germinal centre of radius
R D 160 m.
The position distribution P.r;t
n
/ was calculated from the re-constructed cell
tracks and represents the probability to find a cell after time t
n
at a radial distance r
from its initial position. The result is plotted in Fig. 6.2batt
n
D10 min and t
n
D 3 h
for a spherical germinal centre of radius R D 160 m and cellular starting posi-
tions at the centre of the sphere. Interestingly, for B cells that perform random walk
migration with a directional persistence time, it was found that within 3 h B cells
will be equally distributed over the whole germinal centre. This result is in con-
flict with the observation of a zonal structure in germinal centres, where more B
cells are found in the dark zone than in the light zone. In other words, these results
suggest that additional mechanisms must be present that prohibit the quick intermix-
ture of the germinal centre by the B cells. A natural candidate for this mechanism is
chemotaxis and its implications on the germinal centre morphology will be further
discussed below.
Agent-Based Models of Interacting Cell Systems
Cellular systems exhibit complex phenomena that require a modelling approach
where different types of cells are represented as discrete objects with specific prop-
erties and characteristic functions. This is realized in agent-based models where
each cell is an agent that can migrate and interact with other agents in space and
time. It is convenient to impose a lattice of space points that mimics the spatial
environment of the cells, where the distance between neighboring lattice points de-
termines the spatial resolution. The advantage of the spatial discretization by the
130 M.T. Figge and M. Meyer-Hermann
Fig. 6.2 Trans-zone
migration and probability
distribution of B cells in a
spherical germinal centre of
radius R D 160 m.
(a): The fraction of 10
5
monitored cells that migrate
across the zone boundary of
40 m thickness during a
one-hour measurement. The
position of the intercepting
plane at the centre of the zone
boundary is changed between
R and CR across the whole
germinal centre. Over a large
regime of plane intercepts the
trans-zone migration
frequency is found to be
within the experimentally
expected range of 5–10%per
1h.(b): Position distribution
P.r;t
n
/ as a function of the
radial distance r at times
t
n
D 10 min and t
n
D 3 h.
After 3 h, the quadratic
dependence of P.r;t
n
/ on r
indicates the homogeneous
distribution of B cells
throughout the whole
germinal centre. (This figure
was modified after [7].)
lattice representation is that the neighborhood topology is kept fixed during the sim-
ulation, whereas lattice-free agent-based models with continuous space coordinates
require additional measures to identify the neighbors of a cell in each time step of
the simulation [16].
The procedure according to which the system evolves in time depends on the type
of implemented agent-based model. In the next section, we consider a Potts-model
approach, where the system dynamics is governed by minimizing a pre-defined en-
ergy functional. In contrast, we will also consider a model that is based on rules for
stochastic events that determine the time-evolution on the basis of rates associated
with the occurrence of these events.
6 Modelling Intravital Two-Photon Data 131
T Cell Migration and Interaction with Dendritic Cells
On the basis of two-photon imaging data from lymph nodes of mice, the migration
of T cells and their interaction with dendritic cells was studied using a Potts model
[17, 18]. In this model, cells are represented by several connected points in a three-
dimensional lattice. The cell types taken into account are T cells, dendritic cells
and static fibroblastic reticular cells forming the reticular network in lymph nodes.
Surface and volume energies are assigned to cells that are in contact with other cells
and changes in the cellular configuration are determined by minimizing an energy
functional.
The energy functional is given in terms of the Hamiltonian
H D
X
ij k
X
i
0
j
0
j
0
J
.
ij k
/; .
i
0
j
0
j
0
/
1 ı
ij k
;
i
0
j
0
j
0
C
X
v
.v
V
/
2
C
p
.p
P
/
2
: (6.14)
The first term represents the surface energy J depending on the interacting cell types
. / with the identification number of the cells on the lattice. The summation
runs over all lattice points fij k g and neighboring lattice points fi
0
j
0
j
0
g with the
Kronecker delta excluding self-terms of the surface energy. The volume energy is
determined by
v
and is a measure for the cell inelasticity driving the actual cell
volume v
to a pre-defined target cell volume V
. For dendritic cells the large surface
to volume area is imposed by the
p
-term in the Hamiltonian with actual dendritic
cell surface p
and target surface P
.
The system is advanced in time by random changes in the cellular configura-
tion that give rise to the energy difference H between the two configurations. In
addition, for motile T cells the direction of migration is measured by the angle ˛
relative to a pre-defined target direction. This gives rise to an additional contribu-
tion H
T
D cos.˛/ for T cells, such that the total energy difference is given
by H
t
D H C H
T
. A Metropolis Monte Carlo algorithm is used to decide
whether or not the new cellular configuration is accepted. The details of this proce-
dure together with the chosen model parameters can be found in [17].
In the model, T cells perform random walk migration with a directional per-
sistence time in the order of 2 min that was fitted to reproduce the experimental
data [11]. This agreement was obtained without the requirement that T cells reg-
ularly pause and subsequently choose a new random direction. Instead, the model
suggests that this migration behaviour is a consequence of T cells having a preferred
direction of motion that is adjusted by the reticular network and dendritic cells in
the nearby environment. According to the simulations, T cells migrate preferentially
along the fibers of the reticular network unless they see obstacles on their migration
path. It was proposed that this behaviour gives rise to small, dynamic streams of T
cells through the lymph node.
132 M.T. Figge and M. Meyer-Hermann
The model has also been used to estimate the scanning rates of dendritic cells by
T cells. The simulations revealed that T cells are able to scan 100 different dendritic
cells per hour. This implies that, during negative selection in the thymic medulla,
maturing T cells scan about 3:4 10
4
different dendritic cells in 14 days. This
number involves many brief contacts lasting less than 1 min and the simultaneous
interaction between a T cell and multiple dendritic cells. The average contact dura-
tion was between 1 and 2 min according to the simulations, with rare interactions
that took up to 10min. It should be noted, however, that the contact duration and the
scanning estimate depend on the imposed densities of the different cell types.
The cellular Potts model has also been applied to investigate the three dis-
tinct phases of T cell stimulation that have been observed in two-photon ex-
periments [18]. In the first phase, T cells rapidly migrate trough lymph nodes
experiencing only brief encounters with dendritic cells. Several hours after T cells
are first exposed to their cognate antigen, they enter into the second phase, which is
characterized by T cells being clustered around dendritic cells for more than 30 min.
It is likely that immunological synapses form during this phase that ultimately re-
sults into the stimulation of T cells. The third phase is characterized by T cells that
are again rapidly migrating and proliferating in response to antigen stimulation.
Simulations suggest that, in order to enter the second phase of T cell stimulation,
the assumption of adhesion between specific T cells and antigen-bearing dendritic
cells alone is not sufficient. Rather, it was concluded from the simulations that stop
signals have to be provided by dendritic cells that are integrated by the T cells during
the first phase and enable the transition to the second phase. It was speculated that
stop signals may be provided during the first and second phase of T cell priming,
but are absent or ignored with the onset of the third phase, in which T cells resume
rapid migration behaviour.
Transient Chemotaxis of B Cells in Germinal Centres
During the last decade, the germinal centre reaction has been simulated by var-
ious implementations of agent-based models that describe cell migration and in-
teraction as the result of stochastic events occurring with characteristic reaction
rates [8,19–22]. Recent two-photon imaging of in vivo B cell migration in ger-
minal centres [13–15] has re-initiated the functional analysis of the germinal centre
reaction for different assumptions on the B cell migration behaviour [7].
We have discussed that the statistical cell track model, based on the hypothesis
of B cells performing persistent random walk migration, reveals a conflict. On the
one hand, this hypothesis is sufficient to explain the experimentally observed fre-
quency of B cell trans-zone migration in germinal centres, on the other hand the
high motility of B cells results in a quick intermixture of the germinal centre that
cannot be reconciled with the observed zonal structure in germinal centres. How-
ever, performing a functional analysis within an agent-based modelling approach,
this conflict can be resolved under the additional assumption that persistent random
walk migration of B cells is subject to transient chemotaxis [7].