Navarra Antonio, Simoncini Valeria. A Guide to Empirical Orthogonal Functions for Climate Data Analysis
Подождите немного. Документ загружается.


7.2 The Modes 109
and noticing that U
Z
U and V
U
S
are orthonormal matrices, reveals that the singular
values in † are the cosines of the canonical angles between the spaces spanned by
Z and S; see, e.g., Meyer (2000). The smaller the singular values, the farther away
the two spaces. Note that the decomposition above yields the same matrices U, †,
V as that in (7.1). With these tools, we can easily derive the coefficient matrices A
and B as follows:
A D Z
.Z
Z/
1
2
U D
b
V
Z
U
Z
U; B D
b
V
S
U
S
V:
It readily follows that A and B have orthonormal columns, and that A
B D †,as
explicitly shown earlier.
The procedure outlined in the previous paragraph performs a correlation analysis
(by means of an SVD) with the orthogonal bases of the spaces spanned by Z and S,
allowing to eliminate spurious small correlation singular values which might be due
to almost linear dependence among the columns of each of the two matrices Z and
S, and not to a true lack of correlation between the two fields. We will explore this
fact more in detail in Sect. 7.3.
The reconstruction of the data sets after a correlation analysis is carried out, is
trickier than in previous cases. We recall that Z and S have full row rank, from
which it follows that the two matrices W
Z
and W
S
defined in (7.2) are square and
nonsingular, and it holds .W
Z
/
D .ZZ
/
1
2
U, .W
S
/
D .SS
/
1
2
V. Therefore,
from (7.3) it follows
Z D .W
Z
/
A
DW P
Z
A
; S D .W
S
/
B
DW P
S
B
:
We can see that we can reconstruct the data matrix as a combination of the col-
umn of the matrix P
Z
and the coefficients of the matrix A. The rows of A provide the
contribution of each column of P
Z
to a specific column, that is to say to a specific
time, of the data set Z.ThecolumnsofA are the time evolution of the coefficients
for a specific column of P
Z
through the time evolution of the matrix Z.Thecolumns
of the matrix P
Z
are called the “patterns”.
The price we are paying to maximize the covariance in the time evolution, is
given by this complication of “weight vectors” and “patterns” that coincide in the
SVD case, realizing a true basis in the data space. Weight vectors and patterns are
not orthogonal. This issue creates problems for the interpretation of the explained
variance. We can still reconstruct the data based on the result from the analysis,
but in this case the data are a linear combination of the patterns according to the
projection of the data on the weight vectors.
7.2 The Modes
Before addressing this interpretation problem, let us have a look at the CCA modes
themselves, as they are represented by the patterns P
Z
, P
S
.
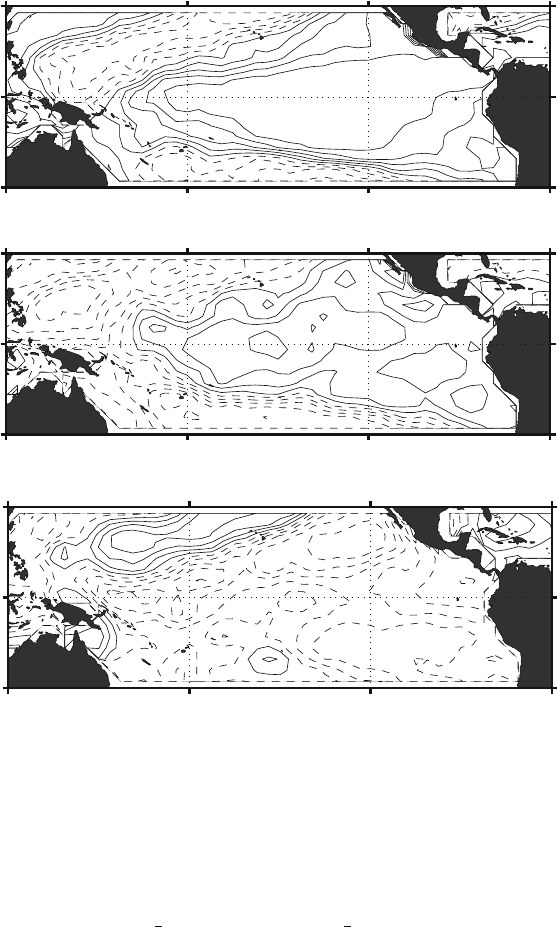
The first CCA mode of the height field in Fig. 7.1 is reminiscent of the SVD
modes found earlier (Fig. 6.1), but there are significant differences. In the case of
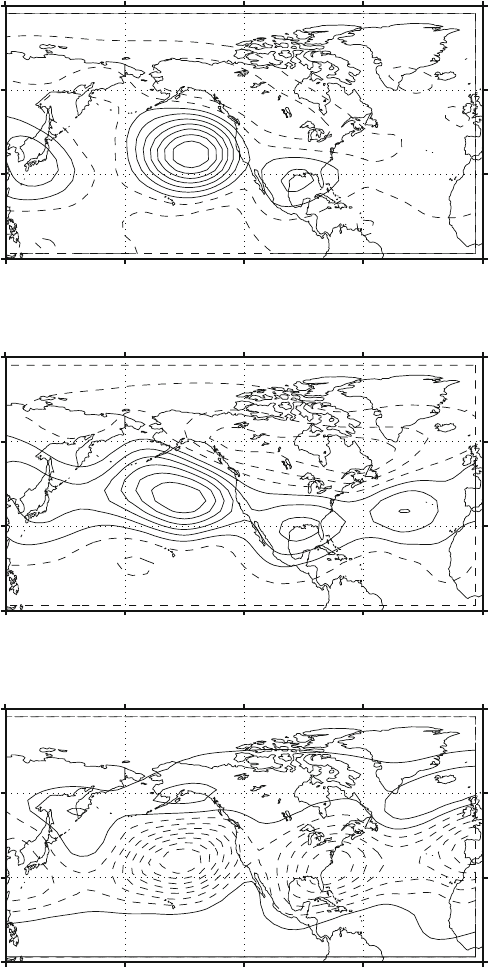
110 7 The Canonical Correlation Analysis
-10.0111
-10.0111
8.33106
CCA Z Component Expl TC 8% Correlation 100%
-13.4774
-13.4774
4.31636
4.31636
4.31636
4.31636
CCA Z Component Expl TC 9% Correlation 100%
-22.3863-22.3863
-7.26706
-7.26706-7.26706
-7.26706
-7.26706
CCA Z Component Expl TC 7% Correlation 100%
90°N
60°N
30°N
0°
90°N
60°N
30°N
0°
90°N
60°N
30°N
0°
120°E
180°W 120°W
60°W
0°
120°E
180°W 120°W
60°W
0°
120°E
180°W 120°W
60°W
0°
Fig. 7.1 The first three classical CCA modes for the Height-SST data set. Here is shown the Z
component in descending order of explained total combined variance
7.2 The Modes 111
the first mode there is a large similarity in shape between the two methods. Both
patterns exhibit several lobes over the Central Pacific, the Southern United States
and the central Atlantic, whereas a contrasting center of action is over Canada. The
intensity contrast is however greater in the case of the CCA and the contrasts be-
tween negative and positive centers appear to be smaller in the case of the SVD
mode.
There are more differences for the second mode in Fig. 7.1. The SVD mode is
somewhat incoherent and it is difficult to assign a particular interpretation.
The second CCA mode shows well defined centers of action over the Central
Pacific and the Atlantic ocean, that can be organized in dipoles over the main ocean
basin. The dipole can be interpreted as expression of variability associated with jet
stream shifting, identified by the strong gradients in the height fields, in a meridional
direction. The two dipoles identify the location of two such areas over the main
ocean basins.
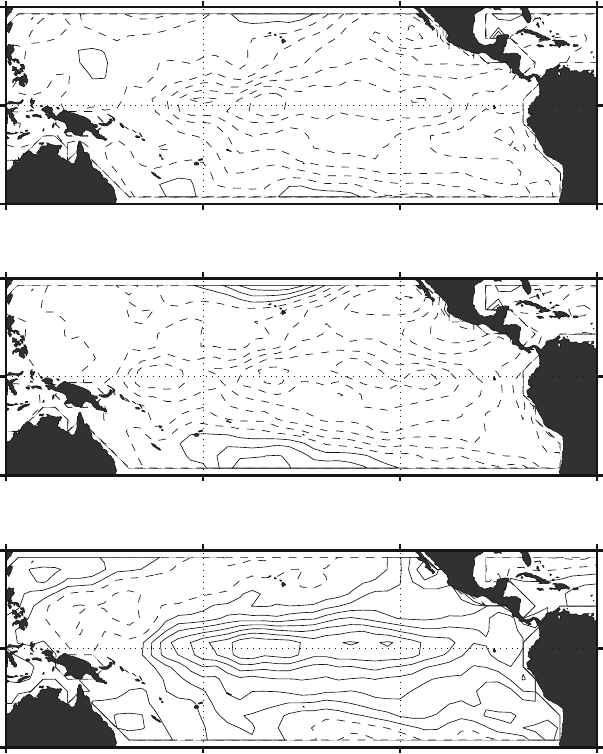
The SST modes in Figs. 7.2 and 6.2 give a similar interesting picture. The first
CCA mode is also similar to the first SVD mode, as in the previous case. The pattern
is broad over the Pacific, with the characteristic wedge shape of the variability of the
SST in the area. The differences increase in the second mode. The SVD mode tries
to capture the main contrast between the east and west portions of the basin, whereas
the second CCA mode is concentrated in the equatorial region of the Central Pacific.
The CCA mode appears to have a “simpler” structure than the SVD mode and there
is no sign of the east–west contrast apparent in the SVD mode.
The third mode is even more striking as the CCA mode attempts to capture
the variability of the wedge area margins, as it can be seen by the strong inten-
sification of the mode amplitude at the area border. The SVD mode is a rather
complicated creature, trying to focus on some detail of the variability in the West
Pacific. Therefore, CCA and SVD “capture different animals in the savana” of the
climate variability; how can we argue in favor of one individual or another?
The differences arise mainly from relaxing the orthogonality requirement in the
CCA case. A careful observer can visually realize that the CCA modes are not spa-
tially orthogonal. The center of action in the Pacific for the first height CCA mode,
for instance, is almost in the same location of the center of action with the same
sign in the second mode. The first and second CCA SST modes have also strong
overlaps of the same sign in the Central Equatorial Pacific. Clearly those modes are
not orthogonal. The CCA method, without the nuisance of generating mutually or-
thogonal patterns, can find more complicated patterns, as long as they maximize the
correlation between the respective time series.
Deciding which mode is more important becomes tricky. The SVD provides a
natural ranking of the modes because the orthogonality allows a clean separation
of the variance among all the modes. In the CCA case this is no longer possible.
We can still have a clue by computing the portion of variance explained by each
CCA mode after the data are reconstructed with just that mode, but the overlap
between the modes will result in a sum of explained variances that is not equal
to the total variance. Indeed, each CCA mode contains a little bit of the others,
since the projection of each mode on the other is not zero; this is another way of
112 7 The Canonical Correlation Analysis
-0.49756
-0.49756
-0.49756
-0.49756
-0.49756
-0.1126
-0.1126
-0.1126
-0.1126
-0.1126
-0.1126
-0.49756
S Component Expl TC 14% Correlation 100%CCA
-0.41362
-0.41362
-0.41362
-0.41362
-0.41362
-0.087916
-0.087916
-0.087916
-0.087916
-0.087916
-0.087916
-0.087916
-0.087916
-0.087916
-0.41362
S Component Expl TC 11% Correlation 100%CCA
-0.20468
-0.20468
-0.20468
-0.20468
-0.20468
0.14458
0.14458
0.14458
0.14458
-0.20468
S Component Expl TC 10% Correlation 100%CCA
180°W
120°E
60°W120°W
180°W
120°E
60°W120°W
180°W
120°E
60°W120°W
30°N
30°S
0°
30°N
30°S
0°
30°N
30°S
0°
Fig. 7.2 The first three CCA modes for the Height-SST data set. Here is shown the SST compo-
nent in descending order of explained total combined variance
interpreting their non-orthogonality. One can use the computed explained variance
to rank the modes in order of decreasing explained variance, like in the EOF or SVD
case. The total variance explained in Figs. 7.1 and 7.2 is computed in such a way.
We can see that the result is still acceptable; in practice the explained variances are
not completely off the wall because the amount of overlap between modes is often
small, but it is clear that the idea of explained variance in the CCA case must be
taken with great care.
7.2 The Modes 113
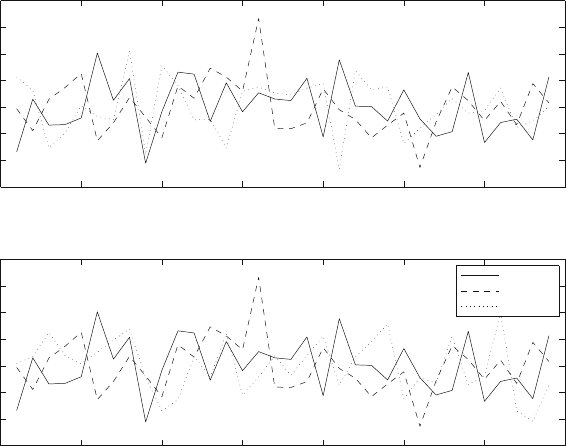
0 5 10 15 20 25 30 35
–3
–2
–1
0
1
2
3
4
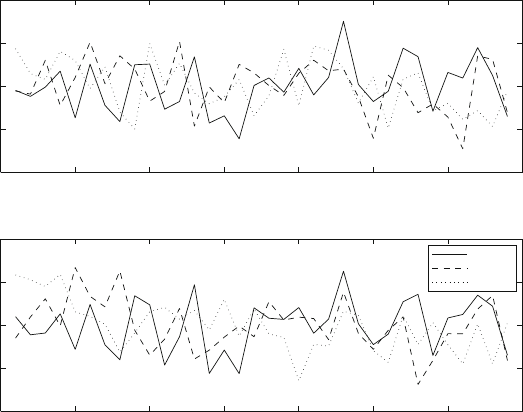
Time series of the first three CCA modes -- Z component
0 5 10 15 20 25 30 35
–3
–2
–1
0
1
2
3
4
Time series of the first three CCA modes -- S component
Mode 1
Mode 2
Mode 24
Fig. 7.3 Time series coefficients for the first three CCA modes for the Height-SST data set
The CCA was designed to maximize correlation between time coefficients.
Figure 7.3 shows the time series of the time coefficient corresponding to the first
twomodesinFigs.7.1 and 7.2. It is possible to see that the time series are strongly
correlated. The dotted line, corresponding to mode 24, is less correlated.
This result shows that CCA faces an increasingly difficult task as the modes
are found, since the modes must be maximally correlated between height and SST
components, but they must be uncorrelated in time with the modes already found.
In principle one could use the time correlation to rank the modes, ordering them
in decreasing correlation magnitude, but in practice it is easy to find several modes
with high values of correlation with a practical degeneracy. In that case we have to
go back to the ranking based on the amount of variance explained.
Exercises and Problems
1. Given the two matrices
Z D
0
@
1111 11
1012 00
011121
1
A
; S D
0
@
1 11111
111200
202400
1
A
;

114 7 The Canonical Correlation Analysis
find the singular values of the scaled cross-covariance in (7.1) and check that if
one of the singular values is equal to one then the corresponding time coefficients
are equal.
The nonzero singular values are † D diag.1; 0:56363; 0:53860/. Explicit com-
putation shows that
A D
0
B
B
B
B
B
B
B
@
4:0825e 01 4:0131e 01 4:2683e 01
5:2830e 16 1:5132e 01 5:1883e 01
4:0825e 01 1:4079e 01 2:9290e 01
8:1650e 01 1:3026e 01 6:6968e 02
8:3039e 17 8:6969e 01 4:3494e 01
5:2830e 16 1:5132e 01 5:1883e 01
1
C
C
C
C
C
C
C
A
;
B D
0
B
B
B
B
B
B
B
@
4:0825e 01 3:0850e 01 8:5980e 02
1:2630e 15 2:6847e
01 9:6329e 01
4:0825e 01 6:1700e 01 1:7196e 01
8:1650e 01 1:5425e 01 4:2990e 02
1:1948e 16 4:6275e 01 1:2897e 01
1:1948e 16 4:6275e 01 1:2897e 01
1
C
C
C
C
C
C
C
A
;
confirming that the first column is indeed the same, up to machine precision.
2. Each CCA mode for height and SST can be considered a vector in the data space.
Compute the angles between the CCA modes for height and SST.
7.3 The Barnett–Preisendorfer Canonical Correlation Analysis
As already mentioned, the explicit computation of .ZZ
/
1
2
;.SS
/
1
2
in the clas-
sical CCA is prone to instability problems, in case the matrices ZZ
and SS
are
singular or almost so, that is, in case Z and S are not numerically full (row) rank
matrices. Mathematically speaking, if the smallest eigenvalue of ZZ
is different
from zero by tiny, say 10
15
, it is enough to declare the matrix invertible; how-
ever, this is not sufficient from a numerical standpoint. The inverse matrix will be
dominated by the smallest eigenvalue (see Sect. 2.9) that will contribute predomi-
nantly to the structure of the inverse. We could neglect that, were it not for the fact
that the smallest eigenvalues are the most sensitive to perturbations of the original
matrix, i.e. the covariance matrix. Such perturbations can be variations in the num-
ber of columns that represent a change in the number of time levels represented
in the data, namely a change in the time sampling. Variations in the rows, implying
changes in the spatial domain or in the space sampling, can be just as damaging. The
inverse square root function is very sensitive to small changes in the composition of
the data matrix, introduced for instance by random errors in the data. The effect
can show up in various ways, for instance as spurious large correlations. We have
7.3 The Barnett–Preisendorfer Canonical Correlation Analysis 115
already encountered this problem in Chap. 4 and we have seen that the EOF can be
very effective in filtering out the noise present in the data. Barnett and Preisendor-
fer in 1987 proposed to use EOF to filter the data before applying CCA in order to
minimize the unduly relevance of the random errors in the calculation of the scal-
ing matrices; see Barnett et al. (1987). More generally, this strategy may be used
to eliminate spurious (or noisy) information from the original data matrices. In the
following we report the procedure to obtain the modes as described by Barnett and
Preisendorfer (Fig. 7.4–7.5). It should be clear to the reader that the whole process
may be derived by first truncating the SVD of the two matrices Z, S in (7.6)tothe
first dominant singular values.
The approach follows the lines of the classical CCA analysis, but the original
covariance matrices are now expanded preliminarily on the respective EOF,
ZZ
D E
Z
†
Z
E
Z
; SS
D E
S
†
S
E
S
; (7.7)
where the E represent the EOF for Z and S respectively and † is the diagonal matrix
of the variances. The data is then projected onto the respective EOF basis to obtain
primed quantities
Z
0
D E
Z
Z; S
0
D E
S
S: (7.8)
The covariance matrix expressed in terms of the primed quantities, the EOF coeffi-
cients, is particularly simple
Z
0
Z
0
D E
Z
ZZ
E
Z
D E
Z
E
Z
†
Z
E
Z
E
Z
D †
Z
; (7.9)
with a similar expression for the covariance matrix for S
0
. In the Barnett–
Preisendorfer (BP) approach, the EOF coefficients are normalized and then a
certain number of them is discarded, retaining only a smaller number. This opera-
tion corresponds to removing the higher order EOF that, as we have seen, are the
most affected by noise and sampling errors. In practice this operation is performed
by removing selected rows in the matrices Z and S, to obtain reduced matrices of
EOF coefficients, indicated by the tilde sign,
X D
2
6
6
6
6
6
4
x
1
.1/ x
1
.2/ ::: x
1
.n/
x
2
.1/ x
2
.2/ ::: x
2
.n/
x
3
.1/ x
3
.2/ ::: x
3
.n/
::: ::: ::: :::
x
m
.1/ x
m
.2/ ::: x
m
.n/
3
7
7
7
7
7
5
!
Reduce
!
x
1
.1/ ::: x
1
.n/
x
2
.1/ ::: x
2
.n/
D
Q
Z:
The number of retained modes may be different for the left and right fields, because
the BP-CCA method requires performing an SVD of the cross-covariance matrix of
the normalized reduced coefficients matrix (tilde) quantities:
e
Z
e
S
D U†V
: (7.10)
116 7 The Canonical Correlation Analysis
−18.0623−18.0623
0.960236
0.960236
0.960236
0.960236
0.960236
0.960236
CCA−BP Z Component Expl TC 12% Correlation 96%
−8.2206−8.2206
−2.0705
−2.0705
−2.0705
−2.0705
−2.0705
−2.0705
−2.0705
−2.0705
CCA−BP Z Component Expl TC 1% Correlation 63%
−6.3423−6.3423
−1.4903
−1.4903
−1.4903
−1.4903
−1.4903
−1.4903
−1.4903
CCA−BP Z Component Expl TC 1% Correlation 42%
120°E
180°W
120°W
60°W
0°
120°E
180°W
120°W
60°W
0°
120°E
180°W
120°W
60°W
0°
90°N
60°N
30°N
0°
90°N
60°N
30°N
0°
90°N
60°N
30°N
0°
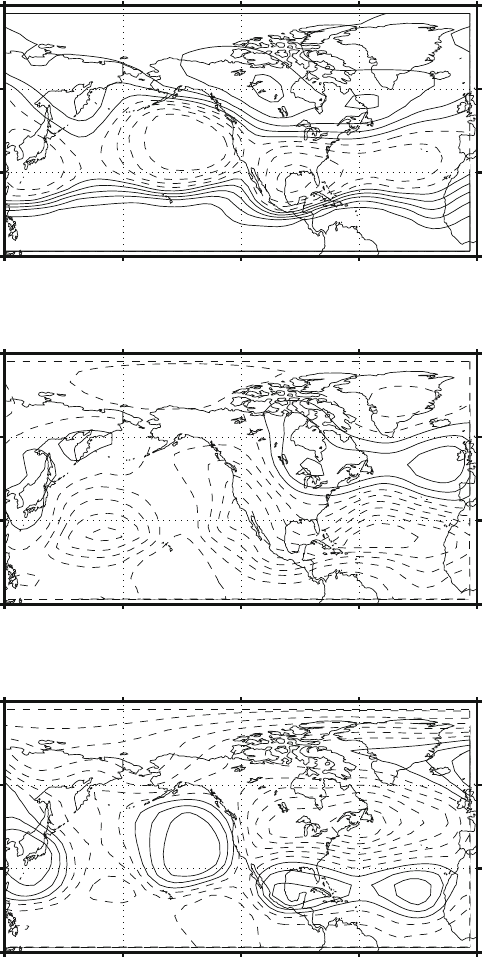
Fig. 7.4 The first three Barnett–Preisendorfer CCA modes for the Height-SST data set. Here is
shown the Z component in descending order of canonical correlations
7.3 The Barnett–Preisendorfer Canonical Correlation Analysis 117
−9.88724
−9.88724
42788.9−42788.9−
1.95733
1.95733
1.95733
1.95733
1.95733
1.95733
−9.88724
CCA−BP S Component Expl TC 18% Correlation 96%
−6.7434
−6.7434
−6.7434
−6.7434
−6.7434
−1.0908
−1.0908
−1.0908
−1.0908
−1.0908
−6.7434
−1.0908
S Component Expl TC 2% Correlation 63%CCA−BP
−5.2252
−5.2252
−5.2252
−5.2252
−5.2252
−0.40748
−0.40748
−0.40748
−0.40748
−0.40748
−0.40748
−0.40748
−5.2252
−0.40748
S Component Expl TC 1% Correlation 42%CCA−BP
30°N
30°S
0°
30°N
30°S
0°
180°W
120°E
60°W120°W
180°W
120°E
60°W120°W
30°N
30°S
0°
180°W
120°E
60°W120°W
Fig. 7.5 The first three CCA Barnett–Preisendorfer modes for the Height-SST data set. Here is
shown the SST component in descending canonical correlation order
This only requires that the number of time levels (the number of columns) be the
same for the left and right fields. The “weight vectors”
b
u;
b
v are then calculated as
before, exploiting the simplified version of the covariance in (7.9). The data can then
be reconstructed using the coefficients computed with the weight vectors,
.†
Z
/
1
2
U D W
Z
;.†
S
/
1
2
V D W
S
; (7.11)
and A D
Q
Z
W
Z
, B D
Q
S
W
S
, where, as before, the matrices A and B hold the
coefficients required to reconstruct the data.
The first modes are not too different from the classical CCA and we can see that
we can recover the familiar distribution of the centers of action in the height field
118 7 The Canonical Correlation Analysis
(Fig. 7.5) and the wedge shape that is typical of the SST distribution (Fig. 7.5). The
first mode is dominated by the Pacific North American pattern as it is represented
in the model, whereas the second mode is highly localized in the Atlantic, pointing
to a variability in the position of the Atlantic jet stream. Interpretation of the result
is always difficult, especially since these modes express correlations between the
height fields and the tropical Pacific SST. A straightforward interpretation has to
consider the height modes as those patterns that are most correlated with the corre-
sponding SST pattern. It is probably easy to come to terms with the first Z mode,
indicating an effect of the tropical SST on the immediate neighboring areas of the
north Pacific and North America. Some more sophisticated dynamics are involved
to explain the effect of the tropical SST on the Atlantic region where the second Z
mode is mostly concentrated. Remote effects of SST are well known, but the evi-
dence from this CCA analysis is usually not enough to guarantee such a conclusion.
The time series reflects the fact that the correlations are less saturated than in the
classical CCA case. The canonical correlations, i.e. the singular values of the cross-
covariance matrix, are not clustered around unity and so we can see a drop in the
correlation values from the first to the third mode (Fig. 7.6). The time series of the
coefficients can be quite different from the classical CCA case, even if the patterns
themselves may not seem very different.
There are no rules to recommend the number of EOF to retain in the BP-CCA
approach. The spirit here is to retain only the portion of the variance in the original
field that is less affected by errors, in this sense any of the comments described in
0 5 10 15 20 25 30 35
−0.1
−0.05
0
0.05
0.1
Time series of the first three CCA−BP modes −− Z component
0 5 10 15 20 25 30 35
−0.1
−0.05
0
0.05
0.1
Time series of the first three CCA−BP modes −− S component
Mode 1
Mode 2
Mode 3
Fig. 7.6 The time series coefficients for the first three CCA Barnett–Preisendorfer modes for the
Height-SST data set