Patrick F. Dunn, Measurement, Data Analysis, and Sensor Fundamentals for Engineering and Science, 2nd Edition
Подождите немного. Документ загружается.

116 Measurement and Data Analysis for Engineering and Science
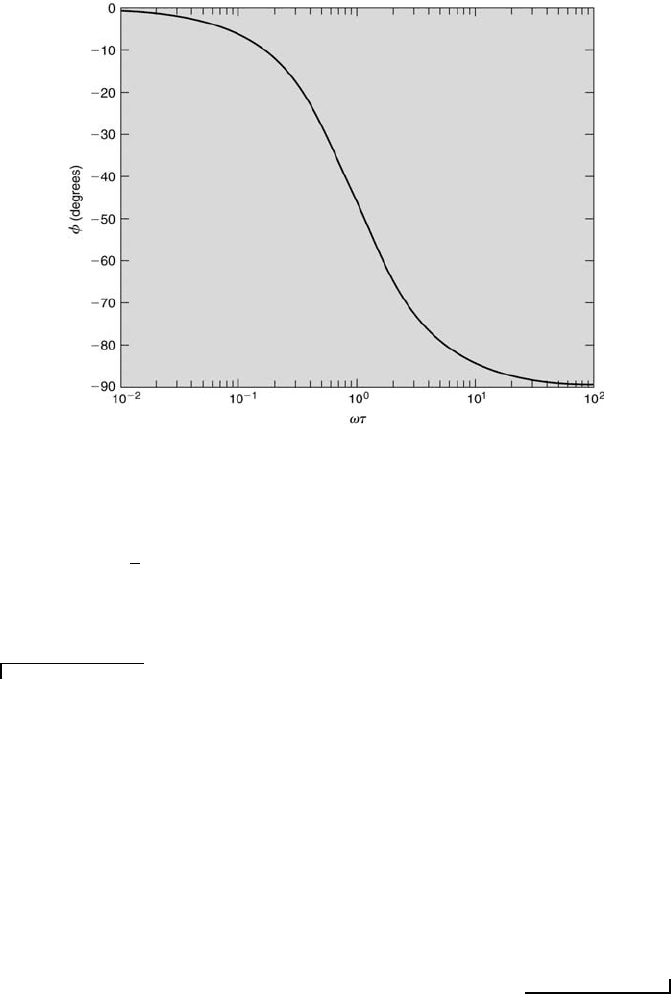
FIGURE 4.4
The phase shift of a first-order system responding to sinusoidal-input forcing.
The point M(ω) = 0.707, which is a decrease in the system’s amplitude by
a factor of 1/
√
2, corresponds to an attenuation of the system’s input by −3
dB. Sometimes, this is called the droplets half-power point because, at this
point, the power is one-half the original power.
Example Problem 4.2
Statement: Convert the sound intensity level of 30 dB to log
e
M(ω).
Solution: The relationship between logarithms of bases a and b is
log
b
x = log
a
x/ log
a
b.
For this problem the bases are e and 10. So,
log
e
M(ω) = log
10
M(ω)/ log
10
e.
Now, log
10
e = 0.434 294. Also, log
e
10 = 2.302 585 and e = 2.718 282. Using Equation
4.43, log
10
M(ω) at 30 dB equals 1.500. Thus
log
e
M(ω) = 1.500/0.434 = 3.456.
The relationship between logarithms of two bases is used often when converting back
and forth between base 10 and base e systems.
Systems often are characterized by their bandwidth and center frequency.
Bandwidth is the range of frequencies over which the output amplitude
of a system remains above 70.7 % of its input amplitude. Over this range,
Calibration and Response 117
Mω) ≥ 0.707 or −3 dB. The lower frequency at which Mω) < 0.707 is
called the low cut-off frequency. The higher frequency at which Mω) <
0.707 is called the high cut-off frequency. The center frequency is the
frequency equal to one-half the sum of the low and high cut-off frequencies.
Thus, the bandwidth is the difference between the high and low cut-off
frequencies. Sometimes bandwidth is defined as the range of frequencies
that contain most of the system’s energy or over which the system’s gain
is almost constant. However, the above quantitative definition is preferred
and used most frequently.
Example Problem 4.3
Statement: Determine the low and high cut-off frequencies, center frequency, and
the bandwidth in units of hertz of a first-order system having a time constant of 0.1 s
that is subjected to sinusoidal-input forcing.
Solution: For a first-order system, M(ω) ≥ 0.707 from ωτ = 0 to ωτ = 1. Thus, the
low cut-off frequency is 0 Hz and the high cut-off frequency is (1 rad/s s)/[(0.1 s)(2π
rad/cycle)] = 5/π Hz. The bandwidth equals 5/π Hz − 0 Hz = 5/π Hz. The center
frequency is 5/2π.
The following example illustrates how the time constant of a thermocou-
ple affects its output.
Example Problem 4.4
Statement: Consider an experiment in which a thermocouple that is immersed in
a fluid and connected to a reference junction/linearizer/amplifier micro-chip with a
static sensitivity of 5 mv/
◦
C. Its output is E(t) in millivolts. The fluid temperature
varies sinusoidally in degrees Celsius as 115 + 12 sin(2t). The time constant τ of the
thermocouple is 0.15 s. Determine E(t), the dynamic error δ(ω) and the time delay
β(ω) for ω = 2. Assume that this system behaves as a first-order system.
Solution: It is known that
τ
˙
E + E = KF (t).
Substitution of the given values yields
0.15
˙
E + E = 5[115 + 12 sin 2t] (4.44)
with the initial condition of E(0) = (5 mv/
◦
C)(115
◦
C) = 575 mV.
To solve this linear, first-order differential equation with constant coefficients, a
solution of the form E(t) = E
h
+ E
p
is assumed, where E
h
= C
0
e
−t/τ
and E
p
=
c
1
+ c
2
sin 2t + c
3
cos 2t. Substitution of this expression for E(t) into the left side and
grouping like terms gives
c
1
= 575, c
2
= 55.1, and c
3
= −16.5.
Equation 4.44 then can be rewritten as
E(t) = k
0
e
−t/0.15
+ 575 + 55.1 sin 2t − 16.5 cos 2t.
Using the initial condition,
c
0
= 16.5.

118 Measurement and Data Analysis for Engineering and Science
Thus, the final solution for E(t) is
E(t) = 575 + 16.5e
−t/0.15
+ 55.1 sin 2t − 16.5 cos 2t
or, in units of
◦
C temperature
T (t) = 115 + 3.3e
−t/0.15
+ 11.0 sin 2t − 3.3 cos 2t.
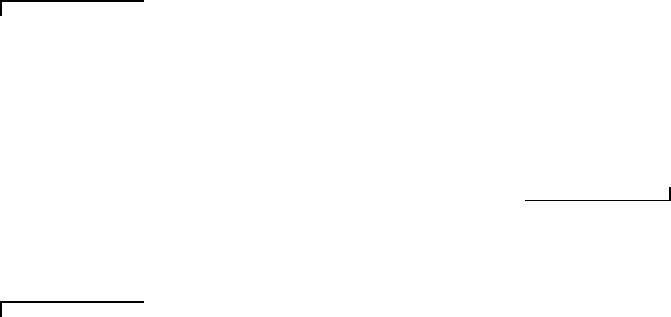
The output (measured) temperature is plotted in Figure 4.5 along with the input (ac-
tual) temperature. A careful comparison of the two signals reveals that the output
lags the input in time and has a slightly attenuated amplitude. At t = 2 s, the actual
temperature is ∼106
◦
C, which is less than the measured temperature of ∼109
◦
C.
Whereas, at t = 3 s, the actual temperature is ∼112
◦
C, which is greater than the
measured temperature of ∼109
◦
C. So, for this type of forcing, the measured temper-
ature can be greater or less than the actual temperature, depending upon the time at
which the measurement is made.
The time lag and the percent reduction in magnitude can be found as follows. The
dynamic error is
δ(ω = 2) = 1 − M (ω = 2) = 1 −
1
[1 + (2 × 0.15)
2
]
1/2
= 0.04,
which is a 4 % reduction in magnitude. The time lag is
β(ω = 2) =
φ(ω = 2)
ω
=
−tan
−1
ωτ
ω
=
(−16.7
◦
)(π rad/180
◦
)
2 rad/s
= −0.15 s,
which implies that the output signal lags the input signal by 0.15 s. The last two terms
in the temperature expression can be combined using a trigonometric identity (see
Chapter 9), as
11.0sin2t − 3.3cos2t = 11.48sin(2t − 0.29), (4.45)
where 0.29 rad = 16.7
◦
is the phase lag found before.
4.6 Second-Order System Dynamic Response
The response behavior of second-order systems is more complex than first-
order systems. Their behavior is governed by the equation
1
ω
n
2
¨y +
2ζ
ω
n
˙y + y = KF (t), (4.46)
where ω
n
=
p
a
0
/a
2
denotes the natural frequency and ζ = a
1
/2
√
a
0
a
2
damping ratio of the system. Note that when 2ζ >> 1/ω
n
, the second
derivative term in Equation 4.46 becomes negligible with respect to the other
terms, and the system behavior approaches that of a first-order system with
a system time constant equal to 2ζ/ω
n
.
Calibration and Response 119
FIGURE 4.5
The time history of the thermocouple system.
Equation 4.46 could represent, among other things, a mechanical spring-
mass-damper system or an electrical capacitor-inductor-resistor circuit, both
with forcing. The solution to this type of equation is rather lengthy and is
described in detail in many applied mathematics texts (see [24]). Now exam-
ine where such an equation would come from by considering the following
example.
A familiar situation occurs when a bump in the road is encountered by
a car. If the car has a good suspension system it will absorb the effect of the
bump. The bump hardly will be felt. On the other hand, if the suspension
system is old, an up-and-down motion is present that may take several
seconds to attenuate. This is the response of a linear, second-order system
(the car with its suspension system) to an input forcing (the bump).
The car with its suspension system can be modeled as a mass (the body
of the car and its passengers) supported by a spring (the suspension coil)
and a damper (the shock absorber) in parallel (usually there are four sets of
spring-dampers, one for each wheel). Newton’s second law can be applied,
which states that the mass times the acceleration of a system is equal to the
sum of the forces acting on the system. This becomes
m
d
2
y
dt
2
=
X
i
F
i
= F
g
+ F
s
(t) + F
d
(t) + F (t), (4.47)
in which y is the vertical displacement, F
g
is the gravitational force (= mg),

120 Measurement and Data Analysis for Engineering and Science
F
s
(t) is the spring force (= −k[L
∗
+ y]), where k is the spring constant and
L
∗
the initial compressed length of the spring, F
d
(t) is the damping force
(= −γdy/dt), where γ is the damping coefficient, and F (t) is the forcing
function. Note that the spring and damping forces are negative because
they are opposite to the direction of motion. The height of the bump as a
function of time as dictated by the speed of the car would determine the
exact shape of F (t). Now when there is no vertical displacement, which is
the case just before the bump is encountered, the system is in equilibrium
and y does not change in time. Equation 4.47 reduces to
0 = mg − kL
∗
. (4.48)
This equation can be used to replace L
∗
in Equation 4.47 to arrive at
m
k
d
2
y
dt
2
+
γ
k
dy
dt
+ y =
1
k
F (t). (4.49)
Comparing this equation to Equation 4.46 yields ω
n
=
p
k/m, ζ = γ/
√
4km,
and K = 1/k.
Another example of a second-order system is an electrical circuit com-
prised of a resistor, R, a capacitor, C, and an inductor, L, in series with
a voltage source with voltage, E
i
(t), that completes a closed circuit. The
voltage differences, ∆V , across each component in the circuit are ∆V = RI
for the resistor, ∆V = LdI/dt for the inductor, and ∆V = Q/C for the
capacitor, where the current, I, is related to the charge, Q, by I = dQ/dt.
Application of Kirchhoff’s voltage law to the circuit’s closed loop gives
LC
d
2
I
dt
2
+ RC
dI
dt
+ I = C
dE
i
(t)
dt
. (4.50)
Comparing this equation to Equation 4.46 gives ω
n
=
p
1/LC, ζ =
R/
p
4L/C, and K = C.
The approach to solving a nonhomogeneous, linear, second-order, ordi-
nary differential equation with constant coefficients of the form of Equa-
tion 4.46 involves finding the homogeneous, y
h
(t), and particular, y
p
(t),
solutions and then linearly superimposing them to form the complete solu-
tion, y(t) = y
h
(t)+y
p
(t). The values of the arbitrary coefficients in the y
h
(t)
solution are determined by applying the specified initial conditions, which
are of the form y(0) = y
o
and ˙y(0) = ˙y
o
. The values of the arbitrary coef-
ficients in the y
p
(t) solution are found through substitution of the general
form of the y
p
(t) solution into the differential equation and then equating
like terms.
The form of the homogeneous solution to Equation 4.46 depends upon
roots of its corresponding characteristic equation
1
ω
n
2
r
2
+
2ζ
ω
n
r + 1 = 0, (4.51)

Calibration and Response 121
which are
r
1,2
= −ζω
n
± ω
n
p
ζ
2
− 1. (4.52)
Depending upon the value of the discriminant
p
ζ
2
− 1, there are three
possible families of solutions (see the text web site for the step-by-step so-
lutions):
• ζ
2
− 1 > 0: the roots are real, negative, and distinct. The general form
of the solution is
y
h
(t) = c
1
e
r
1
t
+ c
2
e
r
2
t
. (4.53)
• ζ
2
− 1 = 0: the roots are real, negative, and equal to −ω
n
. The general
form of the solution is
y
h
(t) = c
1
e
rt
+ c
2
te
rt
. (4.54)
• ζ
2
− 1 < 0: the roots are complex and distinct. The general form of the
solution is
y
h
(t) = c
1
e
r
1
t
+ c
2
e
r
2
t
= e
λt
(c
1
cos µt + c
2
sin µt), (4.55)
using Euler’s formula e
it
= cos t + i sin t and noting that
r
1,2
= λ ± iµ, (4.56)
with λ = −ζω
n
and µ = ω
n
p
1 − ζ
2
.
All three general forms of solutions have exponential terms that decay
in time. Thus, as time increases, all homogeneous solutions tend toward a
value of zero. Such solutions often are termed transient solutions. When
0 < ζ < 1 (when
p
ζ
2
− 1 < 0) the system is called under-damped; when
ζ = 1 (when
p
ζ
2
− 1 = 0) it is called critically damped; when ζ > 1
(when
p
ζ
2
− 1 > 0) it is called over-damped. The reasons for these names
will be obvious later. Now examine how a second-order system responds to
step and sinusoidal inputs.
4.6.1 Response to Step-Input Forcing
The responses of a second-order system to a step input having F (t) = A for
t > 0 with the initial conditions y(0) = 0 and ˙y(0) = 0 are as follows:

122 Measurement and Data Analysis for Engineering and Science
• For the under-damped case (0 < ζ < 1)
y(t) = KA
(
1 − e
−ζω
n
t
"
1
p
1 − ζ
2
sin(ω
n
t
p
1 − ζ
2
+ φ)
#)
(4.57)
where
φ = sin
−1
(
p
1 − ζ
2
). (4.58)
As shown by Equation 4.57, the output initially overshoots the input,
lags it in time, and is oscillatory. As time continues, the oscillations
damp out and the output approaches, and eventually reaches, the input
value. A special situation arises for the no-damping case when ζ = 0.
For this situation the output lags the input and repeatedly overshoots
and undershoots it forever.
• For the critically damped case (ζ = 1),
y(t) = KA
1 − e
−ω
n
t
(1 + ω
n
t)
. (4.59)
No oscillation is present in the output. Rather, the output slowly and
monotonically approaches the input, eventually reaching it.
• For the over-damped case (ζ > 1),
y(t) = KA ·
{1 − e
−ζω
n
t
[cosh(ω
n
t
p
ζ
2
− 1) +
ζ
p
ζ
2
− 1
sinh(ω
n
t
p
ζ
2
− 1)]}. (4.60)
The behavior is similar to the ζ = 1 case. Here the larger the value of ζ,
the longer it takes for the output to reach the value of the input signal.
Note that in the equations of all three cases the quantity ζω
n
in the
exponential terms multiplies the time. Hence, the quantity 1/ζω
n
represents
the time constant of the system. The larger the value of the time constant,
the longer it takes the response to approach steady state. Further, because
the magnitude of the step-input forcing equals KA, the magnitude ratio,
M(t), for all three cases is obtained simply by dividing the right sides of
Equations 4.57, 4.59, and 4.60 by KA.
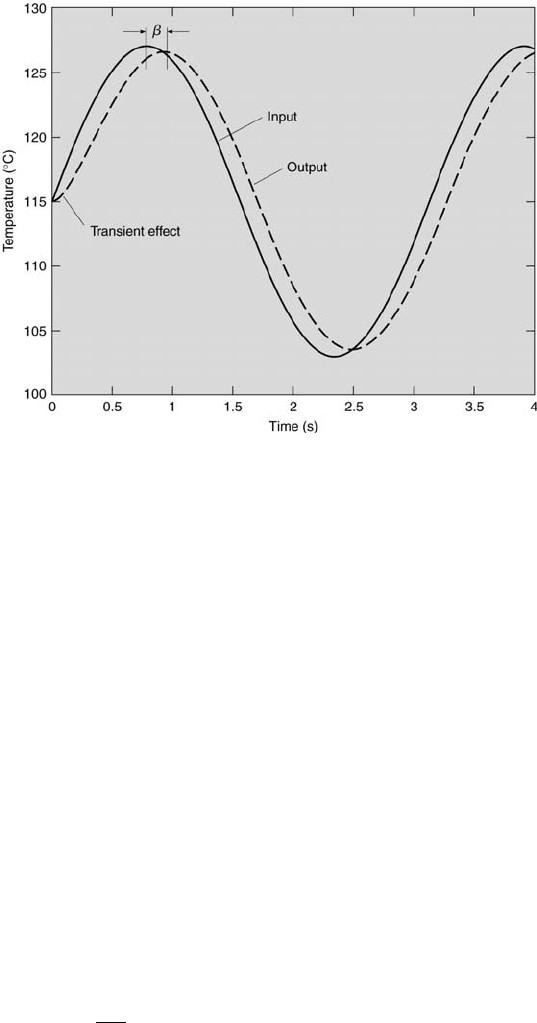
Equations 4.57 through 4.60 appear rather intimidating. It is helpful
to plot these equations rewritten in terms of their magnitude ratios and
examine their form. The system response to step-input forcing is shown in
Figure 4.6 for various values of ζ. The quickest response to steady state is
when ζ = 0 (that is when the time constant 1/ζω
n
is minimum). However,
such a value of ζ clearly is not optimum for a measurement system because
the amplitude ratio overshoots, then undershoots, and continues to oscillate
Calibration and Response 123
FIGURE 4.6
The magnitude ratio of a second-order system responding to step-input forc-
ing.
about a value of M(ω) = 1 forever. The oscillatory behavior is known as
ringing and occurs for all values of ζ < 1.
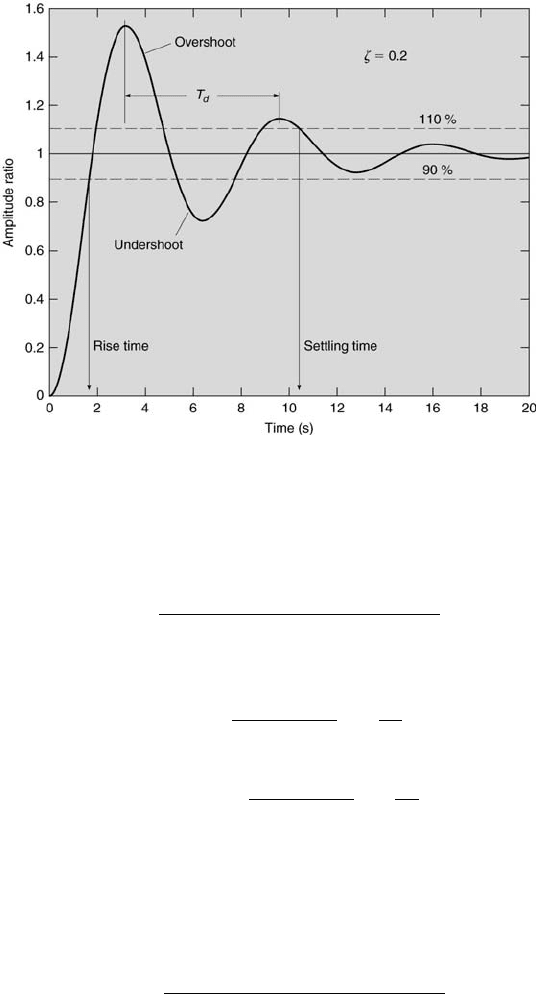
Shown in Figure 4.7 is the response of a second-order system having a
value of ζ = 0.2 to step-input forcing. Note the oscillation in the response
about an amplitude ratio of unity. In general, this oscillation is characterized
by a period T
d
, where T
d
= 2π/ω
d
, with the ringing frequency ω
d
=
ω
n
p
1 − ζ
2
. The rise time for a second-order system is the time required
for the system to initially reach 90 % of its steady-state value. The settling
time is the time beyond which the response remains within ± 10 % of its
steady-state value.
A value of ζ = 0.707 quickly achieves a steady-state response. Most
second-order instruments are designed for this value of ζ. When ζ = 0.707,
the response overshoot is within 5 % of M(t) = 1 within about one-half of
the time required for a ζ = 1 system to achieve steady state. For values
of ζ > 1, the system eventually reaches a steady-state value, taking longer
times for larger values of ζ.
4.6.2 Response to Sinusoidal-Input Forcing
The response of a second-order system to a sinusoidal input having F(t) =
KA sin(ωt) with the initial conditions y(0) = 0 and ˙y(0) = 0 is
124 Measurement and Data Analysis for Engineering and Science
FIGURE 4.7
The temporal response of a second-order system with ζ = 0.2 to step-input
forcing.
y
p
(t) =
KA sin[ωt + φ(ω)]
{[1 − (ω/ω
n
)
2
]
2
+ [2ζω/ω
n
]
2
}
1/2
, (4.61)
where the phase lag in units of radians is
φ(ω) = −tan
−1
2ζω/ω
n
1 − (ω/ω
n
)
2
for
ω
ω
n
≤ 1, (4.62)
or
φ(ω) = −π − tan
−1
2ζω/ω
n
1 − (ω/ω
n
)
2
for
ω
ω
n
> 1. (4.63)
Note that Equation 4.61 is the particular solution, which also is the steady-
state solution. This is because the homogeneous solutions for all ζ are tran-
sient and tend toward a value of zero as time increases. Hence, the steady-
state magnitude ratio based upon the input KA sin(ωt), Equation 4.61 be-
comes
M(ω) =
1
{[1 − (ω/ω
n
)
2
]
2
+ [2ζω/ω
n
]
2
}
1/2
. (4.64)

Calibration and Response 125
These equations show that the system response will contain both magnitude
and phase errors. The magnitude and phase responses for different values of
ζ are shown in Figures 4.8 and 4.9, respectively. Note that the magnitude
ratio is a function of frequency, ω, for the sinusoidal-input forcing case,
whereas it is a function of time, t, for the step-input forcing case.
First examine the magnitude response shown in Figure 4.8. For low
values of ζ, approximately 0.6 or less, and ω/ω
n
≤ 1, the magnitude ra-
tio exceeds unity. The maximum magnitude ratio occurs at the value of
ω/ω
n
=
p
1 − 2ζ
2
. For ω/ω
n
≥∼ 1.5, the magnitude ratio is less than unity
and decreases with increasing values of ω/ω
n
.
Typically, magnitude attenuation is given in units of dB/decade or
dB/octave. A decade is defined as a 10-fold increase in frequency (any
10:1 frequency range). An octave is defined as a doubling in frequency (any
2:1 frequency range). For example, using the information in Figure 4.8, there
would be an attenuation of approximately −8 dB/octave [= 20log(0.2) −
20log(0.5)] in the frequency range 1 ≤ ω/ω
n
≤ 2 when ζ = 1.
Now examine the phase response shown in Figure 4.9. As ω/ω
n
increases,
the phase angle becomes more negative. That is, the output signal begins
to lag the input signal in time, with this lag time increasing with ω/ω
n
. For
values of ω/ω
n
< 1, this lag is greater for greater values of ζ. At ω/ω
n
= 1,
all second-order systems having any value of ζ have a phase lag of −90
◦
or
1/4 of a cycle. For ω/ω
n
> 1, the increase in lag is less for systems with
greater values of ζ.
4.7 Higher-Order System Dynamic Response
As seen in this chapter, the responses of linear, first, and second-order sys-
tems to simple step and sinusoidal inputs are rather complex. Most ex-
periments involve more than one instrument. Thus, the responses of most
experimental measurement systems will be even more complex than the
simple cases examined here.
When each instrument in a measurement system is linear, as described
in Chapter 2, the total measurement system response can be calculated
easily. For the overall system, [a] the static sensitivity is the product of all
of the static sensitivities, [b] the magnitude ratio is the product of all of the
magnitude ratios, and [c] the phase shift is the sum of all of the phase shifts.
In the end, the most appropriate way to determine the dynamic response
characteristics of a measurement system is through dynamic calibration.
This can be accomplished by subjecting the system to a range of either
step or sinusoidal inputs of amplitudes and frequencies that span the entire