Patrick F. Dunn, Measurement, Data Analysis, and Sensor Fundamentals for Engineering and Science, 2nd Edition
Подождите немного. Документ загружается.

136 Measurement and Data Analysis for Engineering and Science
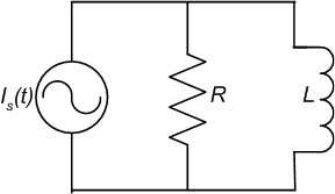
FIGURE 4.11
Current-pulse RL circuit.
What temperature does the thermocouple indicate after steady state
conditions are reached?
14. A pressure transducer that behaves as a second-order system is sup-
posed to have a damping ratio of 0.7, but some of the damping fluid has
leaked out, leaving an unknown damping ratio. When the transducer is
subjected to a harmonic input of 1850 Hz, the phase angle between the
input and the output is 45
◦
. The manufacturer states that the natural
frequency of the transducer is 18 500 rad/s. (a) What is the dynamic
error in the transducer output for a harmonic pressure signal of 1200
Hz? (b) If the transducer indicates a pressure amplitude of 50 psi, what
is the true amplitude of the pressure?
15. The output of an under-damped second-order system with ζ = 0.1 sub-
jected to step-input forcing initially oscillates with a period equal to 1
s until the oscillation dissipates. The same system then is subjected to
sinusoidal-input forcing with a frequency equal to 12.62 rad/s. Deter-
mine the phase lag (in degrees) at this frequency.
16. Consider the RL circuit shown in the Figure 4.11, where the source is
the current pulse I
s
(t) = 6 [u(t) − u(t − 1)] A, R = 5 Ω, and L = 5 H.
What is the current response of the circuit, i(t)?
17. For an RC circuit (R = 2 Ω; C = 0.5 F) with step-input forcing from 0
V to 1 V, determine (a) the voltage of the circuit at 1 s, (b) the voltage
of the circuit at 5 s, and (c) the dynamic error at 1 s.
18. For an RLC circuit (R = 2 Ω; C = 0.5 F; L = 0.5 H) with sinusoidal-
input forcing of the form F (t) = 2 sin(2t), determine (a) the phase lag
in degrees, (b) the phase lag in seconds, and (c) the magnitude ratio.
19. For an RLC circuit, (a) what are the mathematical relationships involv-
ing R, L, and C for the system to be under-damped, critically damped,
or over-damped? (b) What is the equivalent time constant of this sys-
tem?
Calibration and Response 137
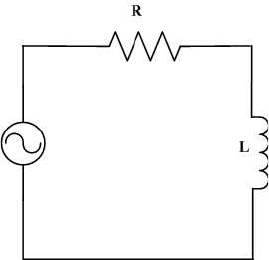
FIGURE 4.12
Simple RL circuit.
20. Consider the simple RL circuit shown in Figure 4.12 in which R = 10
Ω and L = 5 H. (a) What is the governing equation for the current
in this circuit? Is it first order or second order? (b) What is the time
constant for this system? (c) If the voltage source has a sinusoidal input
of 5sin(10t) V, what is the solution to the governing equation? What is
the magnitude ratio? What is the phase lag (in seconds)? (d) Plot the
current response versus time.
This page intentionally left blank

Bibliography
[1] Boyce, W.E. and R.C. Di Prima. 1997. Elementary Differential Equations
and Boundary Value Problems. 6th ed. New York: John Wiley and Sons.
[2] Press, W.H., Teukolsy, S.A., Vetterling, W.T. and B.P. Flannery. 1992.
Numerical Recipes. 2nd ed. New York: Cambridge University Press.
[3] S. Nakamura. 1995. Numerical Analysis and Graphic Visualization with
MATLAB. New York: Prentice-Hall.
139
This page intentionally left blank

5
Probability
CONTENTS
5.1 Chapter Overview . . . . . . . . . . . . . . . . . . . . . . . . . . . . . . . . . . . . . . . . . . . . . . . . . . . . . . . . . 142
5.2 Relation to Measurements . . . . . . . . . . . . . . . . . . . . . . . . . . . . . . . . . . . . . . . . . . . . . . . . 142
5.3 Sample versus Population . . . . . . . . . . . . . . . . . . . . . . . . . . . . . . . . . . . . . . . . . . . . . . . . . 143
5.4 Plotting Statistical Information . . . . . . . . . . . . . . . . . . . . . . . . . . . . . . . . . . . . . . . . . . . 143
5.5 Probability Density Function . . . . . . . . . . . . . . . . . . . . . . . . . . . . . . . . . . . . . . . . . . . . . 151
5.6 Various Probability Density Functions . . . . . . . . . . . . . . . . . . . . . . . . . . . . . . . . . . . 155
5.6.1 Binomial Distribution . . . . . . . . . . . . . . . . . . . . . . . . . . . . . . . . . . . . . . . . . . . . . 157
5.6.2 Poisson Distribution . . . . . . . . . . . . . . . . . . . . . . . . . . . . . . . . . . . . . . . . . . . . . . . 158
5.7 Central Moments . . . . . . . . . . . . . . . . . . . . . . . . . . . . . . . . . . . . . . . . . . . . . . . . . . . . . . . . . . 160
5.8 Probability Distribution Function . . . . . . . . . . . . . . . . . . . . . . . . . . . . . . . . . . . . . . . . 163
5.9 *Probability Concepts . . . . . . . . . . . . . . . . . . . . . . . . . . . . . . . . . . . . . . . . . . . . . . . . . . . . 165
5.9.1 *Union and Intersection of Sets . . . . . . . . . . . . . . . . . . . . . . . . . . . . . . . . . . . 165
5.9.2 *Conditional Probability . . . . . . . . . . . . . . . . . . . . . . . . . . . . . . . . . . . . . . . . . . 166
5.9.3 *Coincidences . . . . . . . . . . . . . . . . . . . . . . . . . . . . . . . . . . . . . . . . . . . . . . . . . . . . . 171
5.9.4 *Permutations and Combinations . . . . . . . . . . . . . . . . . . . . . . . . . . . . . . . . . 171
5.9.5 *Birthday Problems . . . . . . . . . . . . . . . . . . . . . . . . . . . . . . . . . . . . . . . . . . . . . . . 173
5.10 Problem Topic Summary . . . . . . . . . . . . . . . . . . . . . . . . . . . . . . . . . . . . . . . . . . . . . . . . . 175
5.11 Review Problems . . . . . . . . . . . . . . . . . . . . . . . . . . . . . . . . . . . . . . . . . . . . . . . . . . . . . . . . . . 175
5.12 Homework Problems . . . . . . . . . . . . . . . . . . . . . . . . . . . . . . . . . . . . . . . . . . . . . . . . . . . . . . 178
When you deal in large numbers, probabilities are the same as certainties. I
wouldn’t bet my life on the toss of a single coin, but I would, with great
confidence, bet on heads appearing between 49 % and 51 % of the throws of a
coin if the number of tosses was 1 billion.
Brian L. Silver. 1998. The Ascent of Science. Oxford: Oxford University Press.
It is the nature of probability that improbable things will happen.
Aristotle, c. 350 B.C.
... it is a very certain truth that, whenever we are unable to identify the most
true options, we should follow the most probable...
Ren´e Descartes. 1637. Discourse on Method.
Chance favours only the prepared mind.
Louis Pasteur, 1879.
141

142 Measurement and Data Analysis for Engineering and Science
5.1 Chapter Overview
Probability underlies all of our lives. How often has one heard that the
chance of rain tomorrow will be 50 % or that there is a good chance to be
a winner in today’s lottery? It is hard to avoid its mention in an electroni-
cally connected society. But what science is behind such statements? Similar
questions can be asked in relation to experiments, such as the probability
that a pressure will exceed a certain limit.
In this chapter we will study some of the tools of probability. We will
start by examining the differences between a population and a sample when
using statistics. Next we will find out how to calculate and present the sta-
tistical information about a population or a sample. Then, we will explore
the concept of the probability density function and its integral, the prob-
ability distribution function. The chapter concludes with a review of basic
probability concepts. After finishing with this chapter, you will have studied
most of the basic concepts of probability. This will prepare you to begin the
study of statistics, which is the subject of Chapter 6.
5.2 Relation to Measurements
Probability and statistics are two distinct but closely related fields of science.
Probability deals with the likelihood of events. The mathematics of proba-
bility shows us how to calculate the likelihood or chance of an event based on
theoretical populations. Statistics involve the collection, presentation, and
interpretation of data, usually for the purpose of making inferences about
the behavior of an underlying population or for testing theory. Both fields
can be used to answer many practical questions that arise when performing
an experiment, such as the following:
• How frequently does this event occur?
• What are the chances of rejecting a correct theory?
• How repeatable are the results?
• What confidence is there in the results?
• How can the fluctuations and drift in the data be characterized?
• How much data is necessary for an adequate sample?
Armed with a good grasp of probability and statistics, all of these ques-
tions can be answered quantitatively.

Probability 143
5.3 Sample versus Population
Quantitative information about a process or population usually is gathered
through an experiment. From this information, certain characteristics of
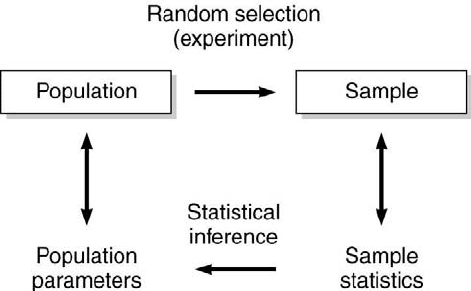
the process or population can be estimated. This approach is illustrated
schematically in Figure 5.1. The population refers to the complete col-
lection of all members relevant to a particular issue and the sample to a
subset of that population. Some populations are finite, such as the num-
ber of students in a measurements class. Some populations essentially are
infinite, such as the number of molecules in the earth’s atmosphere. Many
populations are finite but are so large that they are considered infinite, such
as the number of domestic pets in the U.S. The sample is drawn randomly
and independently from the population. Statistics of the sample, such as
its sample mean value, ¯x, and its sample variance, S
2
x
, can be com-
puted. From these statistics, the population’s parameters, which literally
are almost measurements, such as its true mean value, x
0
, and its true
variance, σ
2
, can be estimated using methods of statistical inference.
The term statistic was defined by R.A. Fisher, the renowned statistician,
as the number that is derived from observed measurements and that esti-
mates a parameter of a distribution [1]. Other useful information also can
be obtained using statistics, such as the probability that a future measurand
will have a certain value. The interval within which the true mean and true
variance are contained also can be ascertained assuming a certain level of
confidence and the distribution of all possible values of the population.
The process of sampling implicitly involves random selection. When a
measurement is made during an experiment, a value is selected randomly
from an infinite number of possible values in the measurand population.
That is, the process of selecting the next measurand value does not depend
upon any previously acquired measurand values. The specific value of the
selected measurand is a random variable, which is a real number between
−∞ and +∞ that can be associated with each possible measurand value.
So, the term random refers to the selection process and not to the often-
misinterpreted meaning that the acquired measurand values form a set of
random numbers. If the selection process is not truly random, then erroneous
conclusions about the population may be made from the sample.
5.4 Plotting Statistical Information
Usually the first thing done after an experiment is to plot the data and to
observe its trends. This data typically is a set of measurand values acquired
with respect to time or space. The representation of the variation in a mea-
144 Measurement and Data Analysis for Engineering and Science
FIGURE 5.1
The finite sample versus the infinite population.
surand’s magnitude with respect to time or space is called its signal. This
signal usually is one of three possible representations: analog (continuous
in both magnitude and time or space), discrete (continuous in magnitude
but at specific, fixed-interval values in time or space), and digital (having
specific, fixed-interval values in both magnitude and time or space). These
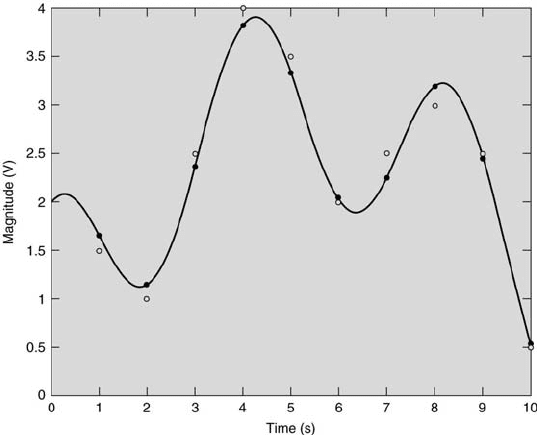
three representations of the same signal are illustrated in Figure 5.2 and
discussed further in Chapter 9. In that figure the analog signal is denoted
by the solid curve, the digital signal by open circles, and the discrete signal
by solid circles. The discrete representation sometimes is called a scatter-
gram.
A cursory examination of the continuous signal displayed in Figure 5.2
shows that the signal has variability (its magnitude varies in time) and
exhibits a central tendency (its magnitude varies about a mean value).
How can this information be quantified? What other ways are there to view
the sample such that more can be understood about the underlying physical
process?
One way to view the central tendency of the signal and the frequency of
occurrence of the signal’s values is with a histogram, which literally is a
picture of cells. Galileo may have used a frequency diagram to summarize
some astronomical observations in 1632 [8]. John Graunt probably was the
first to invent the histogram in 1662 in order to present the mortality rates
of the black plague [9].
Consider the digital representation of the signal shown in Figure 5.2.
There are 10 values in units of volts (1.5, 1.0, 2.5, 4.0, 3.5, 2.0, 2.5, 3.0,
2.5, and 0.5). The resolution of the digitization process for this case is 0.5
V. A histogram of this signal is formed by simply counting the number of
times that each value occurs and then plotting the count for each value on
the ordinate axis versus the value on the abscissa axis. The histogram is
Probability 145
FIGURE 5.2
Various representations of the same signal.
shown in Figure 5.3. Several features are immediately evident. The most
frequently occurring value is 2.5 V. This value occurs three out of ten times,
so it comprises 30 % of the signal’s values. The range of values is from 0.5 V
to 4.0 V. The average value of the signal appears to be between 2.0 V and
2.5 V (its actual value is 2.3 V).
What are the mechanics and rules behind constructing a histogram? In
practice there are two types of histograms. Equal-probability interval his-
tograms have class intervals (bins) of variable width, each containing the
same number of occurrences. Equal-width interval histograms have class
intervals of fixed width, each possibly containing a different number of oc-
currences. The latter is used most frequently. It is more informative because
it clearly shows both the frequency and the distribution of occurrences. The
number of intervals, hence the interval width, and the interval origin must
be determined first before constructing an equal-width interval histogram.
There are many subtleties involved in choosing the optimum interval width
and interval origin. The reader is referred to Scott [9] for a thorough pre-
sentation.
But how is the number of intervals chosen? Too few or too many intervals
yield histograms that are not informative and do not reflect the distribution
of the population. At one extreme, all the occurrences can be contained in
one interval; at the other extreme, each occurrence can be in its own interval.
Clearly, there must be an optimum number of intervals that yields the most