Patrick F. Dunn, Measurement, Data Analysis, and Sensor Fundamentals for Engineering and Science, 2nd Edition
Подождите немного. Документ загружается.

166 Measurement and Data Analysis for Engineering and Science
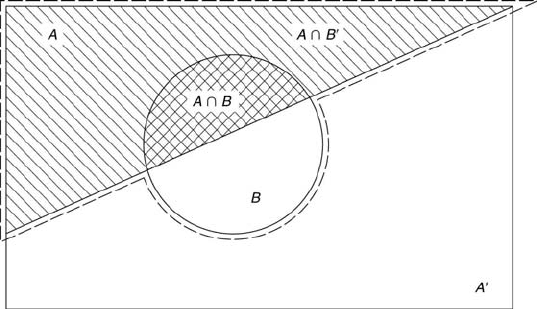
FIGURE 5.17
The union and the intersection of the sets A and B.
A and the circular region the set of events B. The complement of A is
denoted by A
0
. The sample space is exhaustive because A and A
0
comprise
the entire sample space. For two sets A and B, the union is the set of
all members of A or B or both, as denoted by the region bordered by the
dashed line. This is written as P r[A ∪ B].
If the sets of A and B are mutually exclusive where they do not share
any common members, then
P r[A ∪ B] = P r[A] + P r[B]. (5.30)
This would be the case if the sets A and B did not overlap in the figure (if
the circular region was outside the triangular region). Thus, the probability
of getting 3 or 4 in the eight-toss experiment is 1/4 (from 3 and 4).
If the sets do overlap and have common members, as shown by the cross-
hatched region in the figure, then
P r[A ∪ B] = P r[A] + P r[B] − P r[A ∩ B], (5.31)
where P r[A ∩ B] is the probability of the intersection of A and B. The
intersection is the set of all members in both A and B. So, the correct way
to compute the desired probability is P r[even∪3∪4] = P r[even] + P r[3] +
P r[4] − P r[even∩3∩4] = 3/8 + 1/8 + 1/8 − 1/8 = 1/2. P r[even∩3∩4] =
1/8, because only one common member, 4, occurred during the eight tosses.
5.9.2 *Conditional Probability
The moment questions are asked such as, “What is the chance of getting a 4
on the second toss of a die given either a 1 or a 3 was rolled on the first toss?”,

Probability 167
more thought is required to answer them. This is a problem in conditional
probability, the probability of an event given that specified events have
occurred in the past. This concept can be formalized by determining the
probability that event B occurs given that event A occurred previously.
This is written as P r[B | A], where
P r[B | A] ≡
P r[B ∩ A]
P r[A]
. (5.32)
Rearranging this definition gives
P r[B ∩ A] = P r[B | A]P r[A]. (5.33)
This is known as the multiplication rule of conditional probability. Further,
because P r[A ∩ B] = P r[B ∩ A], Equation 5.33 implies that
P r[B | A]P r[A] = P r[A | B]P r[B]. (5.34)
Examination of Figure 5.17 further reveals that
P r[A] = P r[A ∩ B] + P r[A ∩ B
0
], (5.35)
where A ∩ B
0
is shown as the lined region and B
0
means not B. Using the
converse of Equation 5.33, Equation 5.35 becomes
P r[A] = P r[A | B]P r[B] + P r[A | B
0
]P r[B
0
]. (5.36)
Equation 5.36 is known as the total probability rule of conditional probabil-
ity. It can be extended to represent more than two mutually exclusive and
exhaustive events [6].
When events A and B are mutually exclusive, then P r[B | A] = 0,
which leads to P r[B ∩ A] = 0. When event B is independent of event A,
the outcome of event A has no influence on the outcome of event B. Then
P r[B | A] = P r[B]. (5.37)
Thus, for independent events, it follows from Equations 5.33 and 5.37 that
P r[B ∩ A] = P r[B]P r[A]. (5.38)
That is, the conditional probability of a series of independent events is the
product of the individual probabilities of each of the events. Hence, to answer
the question posed at the beginning of this section, P r[B ∩ A] = P r[A]
P r[B] = (1/6)(2/6) = 2/36. That is, there is approximately a 6 % chance
that either an even number or the numbers 3 or 4 occurred.
The chance of winning the lottery can be determined easily using this
information. The results suggest not to bet in lotteries. Assume that four
balls are drawn from a bin containing white balls numbered 1 through 49,
and then a fifth ball is drawn from another bin containing red balls with

168 Measurement and Data Analysis for Engineering and Science
the same numbering scheme. Because each number selection is indepen-
dent of the other number selections, the probability of guessing the num-
bers on the four white balls correctly would be P r[1] P r[2] P r[3] P r[4] =
(1/49)(1/48)(1/47)(1/46) = 1/(5 085 024). The probability of guessing the
numbers on all five balls correctly would be Pr[1] Pr[2] Pr[3] Pr[4] Pr[5] =
[1/(5 085 024)](1/49) = 1/(249 166 176) or about 1 chance in 250 million!
That chance is about equivalent to tossing a coin and getting 28 heads in
a row. Recognizing that the probability that an event will not occur equals
one minus the probability that it will occur, the chance of not winning the
lottery is 99.999 999 6 %. So, it is very close to impossible to win the lottery.
Other useful conditional probability relations can be developed. Using
Equation 5.34 and its converse, noting that P r[A ∩ B] = P r[B ∩ A],
P r[B | A] =
P r[B]P r[A | B]
P r[A]
. (5.39)
This relation allows us to determine the probability of event B occurring
given that event A has occurred from the probability of event A occurring
given that event B has occurred.
Example Problem 5.7
Statement: Determine the probability that the temperature, T , will exceed 100
◦
F in a storage tank whenever the pressure, p, exceeds 2 atmospheres. Assume the
probability that the pressure exceeds 2 atmospheres whenever the temperature exceeds
100
◦
F is 0.30, the probability of the pressure exceeding 2 atmospheres is 0.10 and the
probability of the temperature exceeding 100
◦
F is 0.25.
Solution: Formally, P r[p > 2 | T > 100] = 0.30, P r[p¿2] = 0.10 and P r[T >100] =
0.25. Using Equation 5.39, P r[T > 100 | p >2] = (0.25)(0.30)/(0.10) = 0.75. That is,
whenever the pressure exceeds 2 atmospheres there is a 75 % chance that the temper-
ature will exceed 100
◦
F.
Equation 5.36 can be substituted into Equation 5.39 to yield
P r[B | A] =
P r[A | B]P r[B]
P r[A | B]P r[B] + P r[A | B
0
]P r[B
0
]
. (5.40)
This equation expresses what is known as Bayes’ rule, which is valid for
mutually exclusive and exhaustive events. It was discovered accidentally
by the Reverend Thomas Bayes (1701-1761) while manipulating formulas
for conditional probability [1]. Its power lies in the fact that it allows one
to calculate probabilities inversely, to determine the probability of a before
event conditional upon an after event. This equation can be extended to
represent more than two events [6]. Bayes’ rule can be used to solve many
practical problems in conditional probability. For example, the probability
that a component identified as defective by a test of known accuracy ac-
tually is defective can be determined knowing the percentage of defective
components in the population.

Probability 169
Before determining this probability specifically, examine these types of
probabilities in a more general sense. Assume that the probability of an
event occurring is p
1
. A test can be performed to determine whether or not
the event has occurred. This test has an accuracy of 100p
2
percent. That
is, it is correct 100p
2
percent of the time and incorrect 100(1 − p
2
) percent
of the time. What is the percent probability that the test can predict an
actual event? There are four possible situations that can arise: (1) the test
indicates that the event has occurred and the event actually has occurred
(a true positive), (2) the test indicates that the event has occurred and the
event actually has not occurred (a false positive), (3) the test indicates that
the event has not occurred and the event actually has occurred (a false neg-
ative), and (4) the test indicates that the event has not occurred and the
event actually has not occurred (a true negative). Here, the terms positive
and negative refer to the indicated occurrence of the event and the terms
true and false refer to whether or not the indicated occurrence agrees with
the actual occurrence of the event. So, the probabilities of the four possible
combinations of events are p
2
p
1
for true positive, (1 − p
2
)(1 − p
1
) for false
positive, (1 −p
2
)p
1
for false negative, and p
2
(1 −p
1
) for true negative. Now
the probability that an event actually occurred given that a test indicated
that it had occurred would be the ratio of the actual probability of occur-
rence (the true positive probability) to the sum of all indicated positive
occurrences (the true positive plus the false positive probabilities). That is,
P r[A | IA] =
p
2
p
1
p
2
p
1
+ (1 − p
2
)(1 − p
1
)
, (5.41)
where IA denotes the event of an indicated occurrence of A and A symbolizes
the event of an actual occurrence.
Alternatively, Equation 5.41 can be derived directly using Bayes’ rule.
Here,
P r[A | IA] =
P r[IA | A]P r[A]
P r[IA | A]P r[A] + P r[IA | A
0
]P r[A
0
]
, (5.42)
which is identical to Equation 5.41 because Pr[IA | A] = p
2
, Pr[A] = p
1
,
Pr[IA | A
0
] = (1 - p
2
) and Pr[A
0
] = (1 - p
1
).
Example Problem 5.8
Statement: An experimental technique is being developed to detect the removal
of a microparticle from the surface of a wind tunnel wall as the result of a turbulent
sweep event. Assume that a sweep event occurs 14 % of the time when the detection
scheme is operated. The experimental technique can detect a sweep event correctly 73
% of the time. [a] What is the probability that a sweep event will be detected during
the time period of operation? [b] What is the probability that a sweep event will be
detected if the experimental technique is correct 90 % of the time?
Solution: The desired probability is the ratio of true positive identifications to
true positive plus false positive identifications. Let p
1
be the probability of an actual
sweep event occurrence during the time period of operation and p
2
be the experimental

170 Measurement and Data Analysis for Engineering and Science
technique’s reliability (the probability to identify correctly). For this problem, p
1
= 0.14
and p
2
= 0.73 for part [a] and p
2
= 0.90 for part [b]. Substitution of these values into
Equation 5.41 yields P = 0.31 for part [a] and P = 0.59 for part [b]. First, note that
the probability that a sweep event will be detected is only 31 % with a 73 % reliability
of the experimental technique. This in part is because of the relatively low percentage
of sweep event occurrences during the period of operation. Second, an increase in the
technique’s reliability from 73 % to 90 %, or by 17 %, increases the probability from
31 % to 59 %, or by 28 %. An increase in technique reliability increases the probability
of correct detection relatively by a greater amount.
Example Problem 5.9
Statement: Suppose that 4 % of all transistors manufactured at a certain plant
are defective. A test to identify a defective transistor is 97 % accurate. What is the
probability that a transistor identified as defective actually is defective?
Solution: Let event A denote that the transistor actually is defective and event B
that the transistor is indicated as defective. What is P r[A | B]? It is known that P r[A]
= 0.04 and P r[B | A] = 0.97. It follows that Pr[A
0
] = 1 − P r[A] = 0.96 and Pr[B | A
0
]
= 1 − P r[B | A] = 0.03 because the set of all possible events are mutually exclusive
and exhaustive. Direct application of Bayes’ rule gives
P r[A | B] =
(0.97)(0.04)
(0.97)(0.04) + (0.03)(0.96)
= 0.57.
So, there is a 57 % chance that a transistor identified as defective actually is defective.
At first glance, this percentage seems low. Intuitively, the value would be expected to
be closer to the accuracy of the test (97 %). However, this is not the case. In fact, to
achieve a 99 % chance of correctly identifying a defective transistor, the test would
have to be 99.96 % accurate!
It is important to note that the way statistics are presented, either in the
form of probabilities, percentages, or absolute frequencies, makes a notice-
able difference to some people in arriving at the correct result. Studies [6]
have shown that when statistics are expressed as frequencies, a far greater
number of people arrive at the correct result. The previous problem can be
solved again by using an alternative approach [6].
Example Problem 5.10
Statement: Suppose that 4 % of all transistors manufactured at a certain plant
are defective. A test to identify a defective transistor is 97 % accurate. What is the
probability that a transistor identified as defective actually is defective?
Solution:
• Step 1: Determine the base rate of the population, which is the fraction of defective
transistors at the plant (0.04).
• Step 2: Using the test’s accuracy and the results of the first step, determine the
fraction of defective transistors that are identified by the test to be defective (0.04
× 0.97 = 0.04).
• Step 3: Using the fraction of good transistors in the population and the test’s false-
positive rate (1 − 0.97 = 0.03), determine the fraction of good transistors that are
identified by the test to be defective (0.96 × 0.03 = 0.03).

Probability 171
• Step 4: Determine the desired probability, which is 100 times the fraction in step 2
divided by the sum of the fractions in steps 2 and 3 (0.04 / [0.04 + 0.03] = 0.57) or
57 %.
Which approach is easier to understand?
5.9.3 *Coincidences
Conditional probability can be used to explain what appear to be rare co-
incidences. My wife and I took a tour of Scotland in 1999 along with five
other people whom we had never met before. When we boarded the tour
bus in Scotland we were astounded to find out that five out of the seven of
us lived in Indiana! Our reaction was common − what a rare coincidence,
especially because only about one out of every 1000 people in the world
(approximately 0.1 %) live in Indiana and about 3/4 of us on the bus were
from Indiana. But then I started to think and ask questions. It turns out
that the United Kingdom is a very popular vacation spot for people from
the midwestern and eastern United States and that a commercial airline was
having a special offer that included a flight and tour of Scotland for those
flying out of Chicago’s O’Hare and New York City’s Kennedy airports (all
of those on the bus lived near Chicago or New York City). Granted these
conditions do not explain why five people from Indiana versus another mid-
western or eastern state were there, but they do make this coincidence much
more probable and certainly not rare.
As remarked by Stewart [2], “Because we notice coincidences and ignore
noncoincidences, we make coincidences seem more significant than they re-
ally are.” In fact, even today many people still attribute the occurrences of
apparently rarely occurring events to mysterious causes. Perhaps it is eas-
ier to believe in an inexplicable cause than to identify the conditions under
which the event occurred. Most likely, such occurrences are not so rare after
all.
5.9.4 *Permutations and Combinations
The probability of an event can be determined knowing the number of oc-
currences of the event and the total number of occurrences of all possible
events. Finding the number of all possible events can sometimes be confus-
ing. Consider an experiment in which there are three possible occurrences
denoted by a, b, and c, each of which can occur only once without replace-
ment. What is the probability of getting c, then a, then b, which is P r[cab]?
To determine this probability, the total number of ways that a, b, and c can
be arranged respective of their order must be known. That is, the number
of permutations of a, b, and c must be determined. The number of permu-
tations of n objects is

172 Measurement and Data Analysis for Engineering and Science
n! = n(n − 1)(n − 2)...1, (5.43)
where n! is called n factorial. Stirling’s formula is sometimes useful, where
n! '
√
2πn(n/ exp(n))
n
, which agrees with Equation 5.43 within 1 % for
n > 9. So, there are six possible ways (abc, acb, bca, bac, cab, and cba) to
arrange a, b, and c. Thus, Pr[cab] = 1/6.
Now what if the experiment had four possible occurrences, a, b, c, and
d, and P r[cab] needs to be determined? The number of permutations of n
objects taken m at a time, P
n
m
, is
P
n
m
=
n!
(n − m)!
= n(n − 1)(n − 2)...(n − m + 1). (5.44)
So, there are 4!/(4-3)! or 24 possible ways to arrange three of the four possi-
ble occurrences. Thus, Pr[cab] = 1/24. The probability of getting c, then a,
then b is reduced from 1/6 to 1/24 when the possibility of a fourth occurrence
is introduced. Often it is easy to calculate the number of permutations using
a spread sheet program. For example, using Microsoft EXCEL, the value of
Equation 5.44 is given by the command PERMUT(n,m).
Further consider the same experiment, but where the number of possible
combinations of c, a, and b are determined irrespective of the order. That
is, the number of combinations of n objects taken m at a time, C
n
m
, given
by
C
n
m
=
n!
m!(n − m)!
=
n(n − 1)(n − 2)...(n − m + 1)
m!
, (5.45)
must be found. There are only 4!/(3!1!) or four possible combinations of
three out of four possible occurrences (abc, abd, cdb, and cda). So, the P r[cab]
= 1/4 for this case. That is, there is a ten-time greater chance (25 % versus
2.5 %) of getting a, b, and c in any order versus getting the particular order
of c, a, and b. Using Microsoft EXCEL, the value of Equation 5.45 is given
by the command COMBIN(n,m).
Finally, if there is repetition with replacement, then the number of possi-
ble combinations of n objects taken m at a time with replacement, C
n
m(r)
,
is
C
n
m(r)
=
(m + n − 1)!
(m!)(n − 1)!
. (5.46)
For our experiment, Equation 5.46 gives 6!/(3!3!) or 20 possible combina-
tions of three out of four possible occurrences. This leads to P r[cab] = 1/20.
Clearly, when there is repetition, the number of possible combinations in-
creases.

Probability 173
5.9.5 *Birthday Problems
There are two classic birthday problems that challenge one’s ability to com-
pute the probability of an occurrence [1]. The first is to determine the prob-
ability of at least two out of n people having the same birth date of the year
(same day and month but not necessarily the same year). The second is to
determine the probability of at least two out of n people having a specific
birth date, such as January 18th. For simplicity, assume that there are 365
days per year and that the probability of having a birthday on any day of
the year is the same (both assumptions are, in fact, not true).
Consider the first problem. Often it is easier first to compute the proba-
bility that an event will not occur and then subtract that probability from
unity to obtain the probability that the event will occur. For the second
person there is a probability of 364/365 (= [366 − n]/365 where n = 2) of
not having the same birth date of the year as the first person. For the third
person it is (364/365)(363/365) of not having the same birth date of the year
as the first person or the second person. Here each event is independent of
the other, so the joint probability is the product of the two. Continuing this
logic, the probability, Q, of n people not having the same birth date of the
year is
Q =
364
365
·
363
365
· · ·
(366 − n)
365
. (5.47)
With a little algebra and using the definition of the factorial, Equation 5.47
can be rewritten as
Q =
1
365
n
365!
(365 − n)!
=
1
365
n
P
365
n
. (5.48)
Thus, the probability, P , of at least two of n people having the same birth
date of the year is
P = 1 − Q = 1 −
1
365
n
P
365
n
. (5.49)
For n = 10, Equation 5.49 gives P = 11.69 % and for n = 50, P = 97.04 %.
How many people have to be in a room to have a greater than 50 % chance
of at least two people having the same birth date of the year? The answer
is at least 23 people (P = 50.73 %).
Now examine the second problem, which differs from the first problem
in that a specific birth date is specified. The probability of the second of n
people not having that specific birth date is (364/365) and the probability
of the third of n people not having that specific birth date is the same, and
so on. Thus, the probability of n people not having a specific birth date is
Q =
364
365
n−1
. (5.50)

174 Measurement and Data Analysis for Engineering and Science
The probability of at least two of n people having a specific birth date of
the year is
P = 1 − Q = 1 −
364
365
n−1
. (5.51)
For n = 10, Equation 5.51 gives P = 2.44 % and for n = 50, P = 12.58
%. So how many people have to be in a room to have a greater than 50 %
chance of at least two people having a specific birth date of the year? The
answer is at least 254 people (P = 50.05 %).

Probability 175
5.10 Problem Topic Summary
Topic
Review Problems
Homework Problems
Basic Probability
1, 2, 3, 11, 14, 15
1
Conditional Probability
10, 16, 17, 18
2, 3, 10
Moments
6, 7, 8, 9, 13
7, 9
Displaying Probabilities
4, 5, 12
4, 5, 6, 8
TABLE 5.2
Chapter 5 Problem Summary
5.11 Review Problems
1. Assuming equal probability of being born any day of the year, match
each of the following birthday occurrence possibilities (for one person)
with its correct probability given in Table 5.3.
2. One of each US coin currencies is placed into a container (a penny, a
nickel, a dime, and a quarter). Given that the withdrawal of a coin from
the container is random, find the correct value for each of the following
described quantities: (a) If two coins are drawn, find the probability of
any one permutation occurring. (b) If three coins are drawn without re-
placement, find the probability of the total being the maximum possible
monetary value. (c) If three coins are drawn with replacement, find the
probability of the total being the maximum possible monetary value.
(d) If two coins are drawn with replacement, find the probability of the
total number of cents being even.
Possibility of Occurrence
Probability
on the 31st of a month
0.0849
in August
0.329
on Feb. 29, 1979 (for one born in that year)
0
in a month with 30 days
0.0192
TABLE 5.3
Birthday occurrences and probabilities.