Schmuller J. Statistical Analysis with Excel For Dummies
Подождите немного. Документ загружается.

259
Chapter 14: Regression: Linear and Multiple
x-axis. If the intercept is zero, it intersects with the y-axis and the x-axis, at
the point called the origin.
And now, back to what I was originally talking about.
Regression: What a Line!
Before I began telling you about lines, equations, slopes, and intercepts, I
mentioned that a line is the best way to summarize the relationship in the
scatterplot in Figure 14-1. It’s possible to draw an infinite amount of straight
lines through the scatterplot. Which one best summarizes the relationship?
Intuitively, the “best fitting” line ought to be the one that goes through the
maximum number of points and isn’t too far away from the points it doesn’t
go through. For statisticians, that line has a special property: If you draw that
line through the scatterplot, then draw distances (in the vertical direction)
between the points and the line, and then square those distances and add
them up, the sum of the squared distances is a minimum.
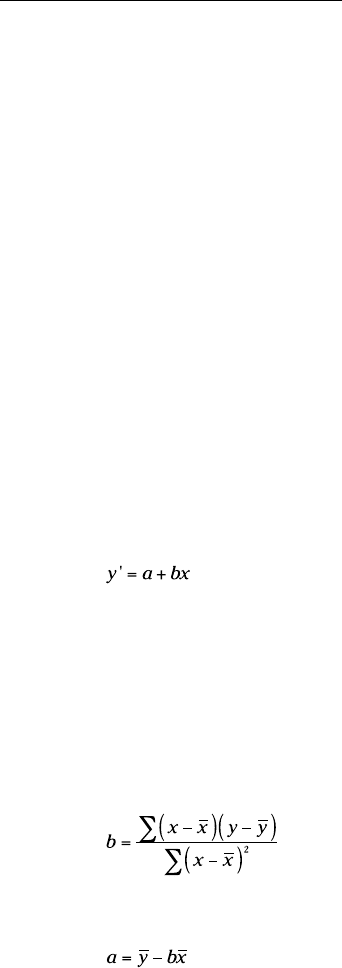
Statisticians call this line the regression line, and indicate it as
Each y’ is a point on the line. It represents the best prediction of y for a given
value of x.
To figure out exactly where this line is, you calculate its slope and its intercept.
For a regression line, the slope and intercept are called regression coefficients.
The formulas for the regression coefficients are pretty straightforward. For
the slope, the formula is
The intercept formula is
I illustrate with an example. To keep the numbers manageable and compre-
hensible, I use a small sample instead of the thousands of students you’d
find in a scatterplot of an entire university student body. Table 14-2 shows a
sample of data from 20 Sahusket University students.
20 454060-ch14.indd 25920 454060-ch14.indd 259 4/21/09 7:33:51 PM4/21/09 7:33:51 PM

260
Part III: Drawing Conclusions from Data
Table 14-2 SAT Scores and GPAs for
20 Sahusket University Students
Student SAT GPA
1 990 2.2
2 1150 3.2
3 1080 2.6
4 1100 3.3
5 1280 3.8
6 990 2.2
7 1110 3.2
8 920 2.0
9 1000 2.2
10 1200 3.6
11 1000 2.1
12 1150 2.8
13 1070 2.2
14 1120 2.1
15 1250 2.4
16 1020 2.2
17 1060 2.3
18 1550 3.9
19 1480 3.8
20 1010 2.0
Mean 1126.5 2.705
Variance 26171.32 0.46
Standard Deviation 161.78 0.82
For this set of data, the slope of the regression line is
The intercept is
20 454060-ch14.indd 26020 454060-ch14.indd 260 4/21/09 7:33:51 PM4/21/09 7:33:51 PM
261
Chapter 14: Regression: Linear and Multiple
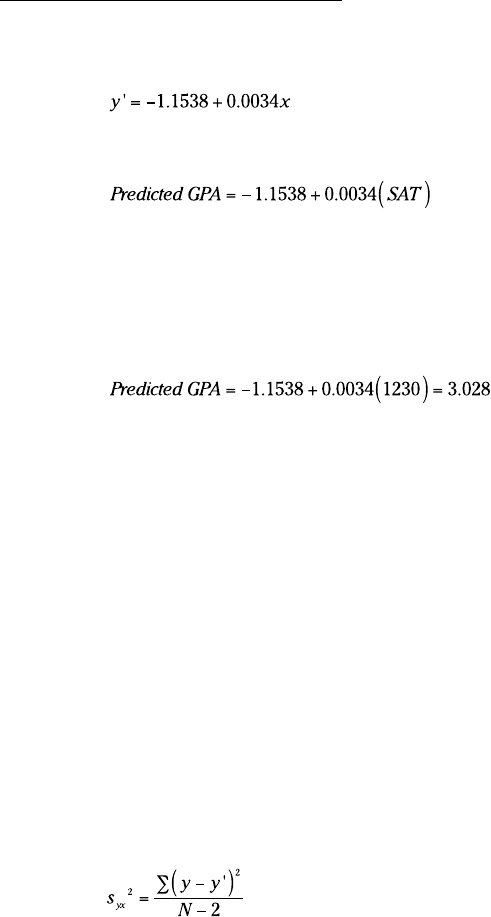
So the equation of the best fitting line through these 20 points is
or in terms of GPAs and SATs
Using regression for forecasting
Based on this sample and this regression line, you can take an applicant’s
SAT score, say 1230, and predict the applicant’s GPA:
Without this rule, the only prediction is the mean GPA, 2.705.
Variation around the regression line
In Chapter 5, I describe how the mean doesn’t tell the whole story about a
set of data. You have to show how the scores vary around the mean. For that
reason, I introduce the variance and standard deviation.
You have a similar situation here. To get the full picture of the relationship in
a scatterplot, you have to show how the scores vary around the regression
line. Here, I introduce the residual variance and standard error of estimate,
which are analogous to the variance and the standard deviation.
The residual variance is sort of an average of the squared deviations of the
observed y-values around the predicted y-values. Each deviation of a data
point from a predicted point (y - y’) is called a residual, hence the name. The
formula is
I said “sort of” because the denominator is N-2, rather than N. The reason for
the -2 is beyond our scope. As I’ve said before, the denominator of a variance
estimate is degrees of freedom (df), and that concept comes in handy in a
little while.
20 454060-ch14.indd 26120 454060-ch14.indd 261 4/21/09 7:33:51 PM4/21/09 7:33:51 PM
262
Part III: Drawing Conclusions from Data
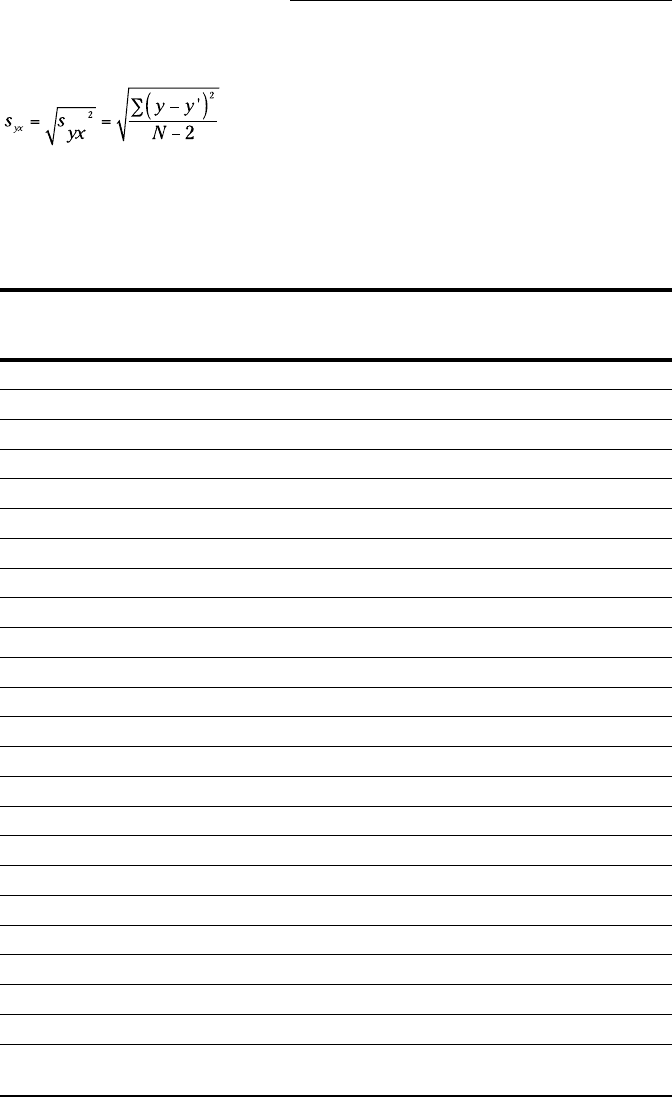
The standard error of estimate is
To show you how the residual error and the standard error of estimate play
out for the data in the example, here’s Table 14-3. This table extends Table 14-2
by showing the predicted GPA for each SAT:
Table 14-3 SAT Scores, GPAs, and Predicted GPAs for
20 Sahusket University Students
Student SAT GPA Predicted GPA
1 990 2.2 2.24
2 1150 3.2 2.79
3 1080 2.6 2.55
4 1100 3.3 2.61
5 1280 3.8 3.23
6 990 2.2 2.24
7 1110 3.2 2.65
8 920 2.0 2.00
9 1000 2.2 2.27
10 1200 3.6 2.96
11 1000 2.1 2.27
12 1150 2.8 2.79
13 1070 2.2 2.51
14 1120 2.1 2.68
15 1250 2.4 3.13
16 1020 2.2 2.34
17 1060 2.3 2.48
18 1550 3.9 4.16
19 1480 3.8 3.92
20 1010 2.0 2.31
Mean 1126.5 2.705
Variance 26171.32 0.46
Standard
Deviation
161.78 0.82
20 454060-ch14.indd 26220 454060-ch14.indd 262 4/21/09 7:33:52 PM4/21/09 7:33:52 PM
263
Chapter 14: Regression: Linear and Multiple
As the table shows, sometimes the predicted GPA is pretty close, sometimes
it’s not. One predicted value (4.16) is impossible.
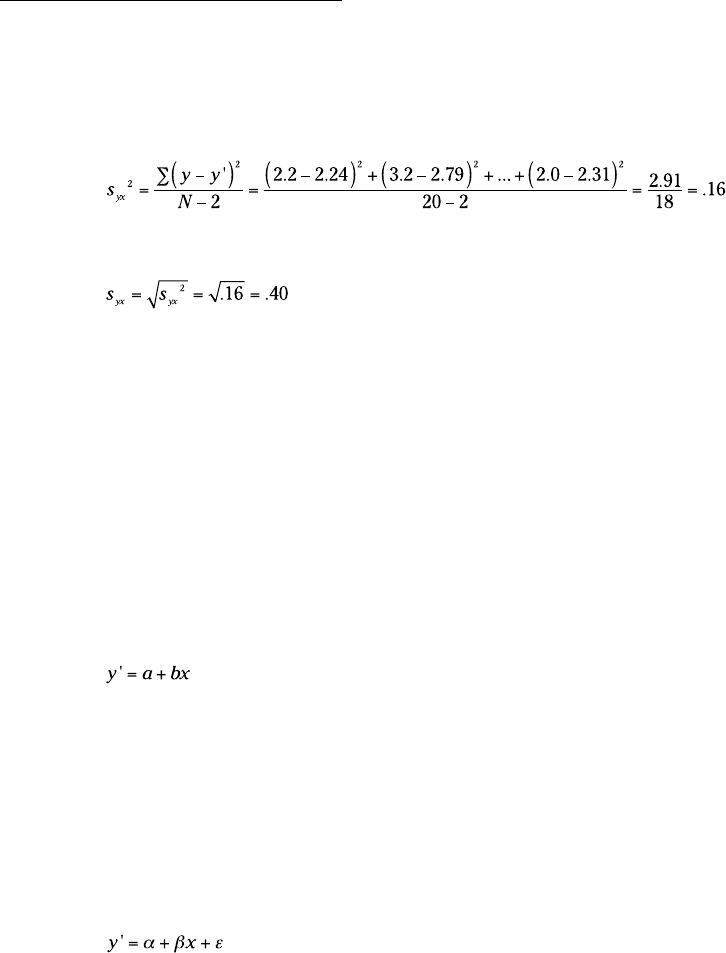
For these data, the residual variance is
The standard error of estimate is
If the residual variance and the standard error of estimate are small, the
regression line is a good fit to the data in the scatterplot. If the residual vari-
ance and the standard error of estimate are large, the regression line is a
poor fit.
What’s “small”? What’s “large”? What’s a “good” fit?
Keep reading.
Testing hypotheses about regression
The regression equation I’ve been working with
summarizes a relationship in a scatterplot of a sample. The regression coef-
ficients a and b are sample statistics. You can use these statistics to test
hypotheses about population parameters, and that’s what I do in this section.
The regression line through the population that produces the sample (like
the entire Sahutsket University student body, past and present) is the graph
of an equation that consists of parameters, rather than statistics. By conven-
tion, remember, Greek letters stand for parameters, so the regression equa-
tion for the population is
The first two Greek letters on the right are α (alpha) and β (beta), the equiva-
lents of a and b. What about that last one? It looks something like the Greek
equivalent of e. What’s it doing there?
20 454060-ch14.indd 26320 454060-ch14.indd 263 4/21/09 7:33:52 PM4/21/09 7:33:52 PM

264
Part III: Drawing Conclusions from Data
That last term is the Greek letter epsilon. It represents “error” in the popula-
tion. In a way, “error” is an unfortunate term. It’s a catchall for “things you
don’t know or things you have no control over.” Error is reflected in the
residuals — the deviations from the predictions. The more you understand
about what you’re measuring, the more you decrease the error.
You can’t measure the error in the relationship between SAT and GPA, but
it’s lurking there. Someone might score low on the SAT, for example, and
then go on to have a wonderful college career with a higher-than-predicted
GPA. On a scatterplot, this person’s SAT-GPA point looks like an error in pre-
diction. As you find out more about that person, you might discover that he
or she was sick on the day of the SAT, and that explains the “error.”
You can test hypotheses about α, β, and ε, and that’s what I do in the upcom-
ing subsections.
Testing the fit
I begin with a test of how well the regression line fits the scatterplot. This is a
test of ε, the error in the relationship.
The objective is to decide whether or not the line really does represent a
relationship between the variables. It’s possible that what looks like a rela-
tionship is just due to chance and the equation of the regression line doesn’t
mean anything (because the amount of error is overwhelming) — or it’s pos-
sible that the variables are strongly related.
These possibilities are testable, and you set up hypotheses to test them:
H
0
: No real relationship
H
1
: Not H
0
Although those hypotheses make nice light reading, they don’t set up a sta-
tistical test. To set up the test, you have to consider the variances. To con-
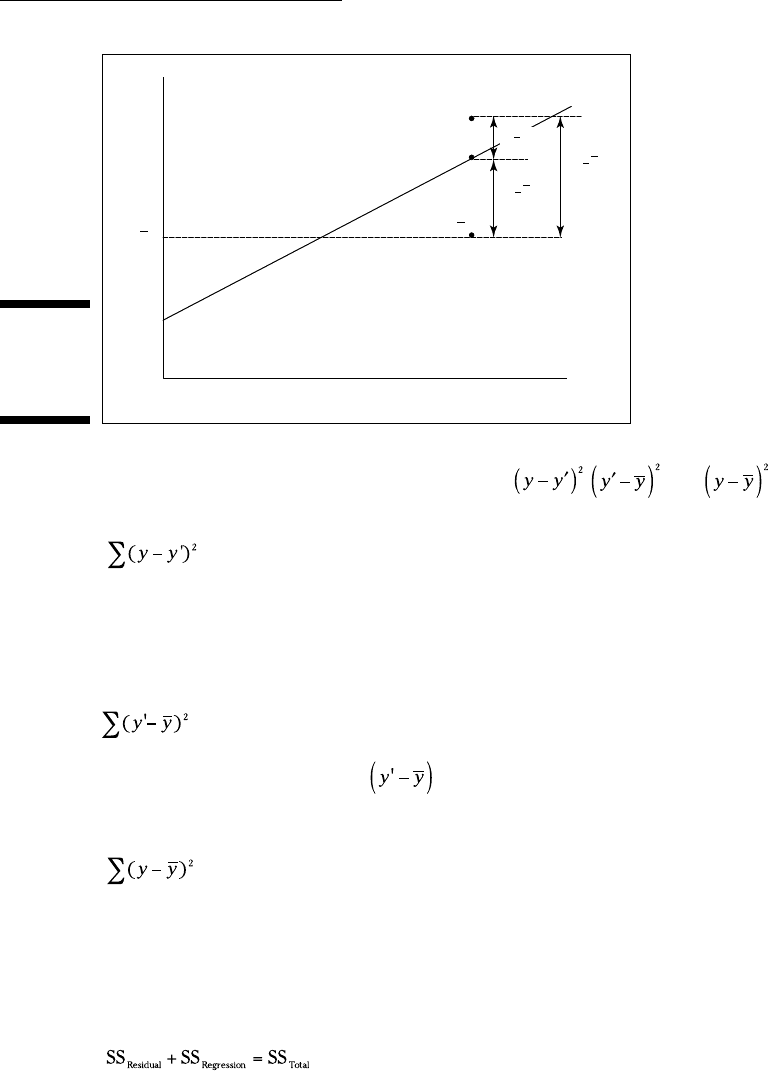
sider the variances, you start with the deviations. Figure 14-3 focuses on one
point in a scatterplot and its deviation from the regression line (the residual)
and from the mean of the y-variable. It also shows the deviation between the
regression line and the mean.
As the figure shows, the distance between the point and the regression line
and the distance between the regression line and the mean add up to the dis-
tance between the point and the mean:
This sets the stage for some other important relationships.
20 454060-ch14.indd 26420 454060-ch14.indd 264 4/21/09 7:33:52 PM4/21/09 7:33:52 PM
265
Chapter 14: Regression: Linear and Multiple
Figure 14-3:
The devia-
tions in a
scatterplot.
x
y
(')yy
(' )yy
()yy
(,)xy
(, ')xy
y
(, )xy
Start by squaring each deviation. That gives you , , and .
If you add up each of the squared deviations, you have
I just showed you this one. That’s the numerator for the residual variance.
It represents the variability around the regression line— the “error” I spoke
of earlier. In the terminology of Chapter 12, the numerator of a variance is
called a Sum of Squares, or SS. So this is SS
Residual
.
This one is new. The deviation
represents the gain in prediction due
to using the regression line rather than the mean. The sum reflects this gain,
and is called SS
Regression
.
I showed you this one in Chapter 5 — although I used x rather than y. That’s
the numerator of the variance of y. In Chapter 12 terms, it’s the numerator of
total variance. This one is SS
Total
.
This relationship holds among these three sums:
20 454060-ch14.indd 26520 454060-ch14.indd 265 4/21/09 7:33:53 PM4/21/09 7:33:53 PM
266
Part III: Drawing Conclusions from Data
Each one is associated with a value for degrees of freedom — the denomi-
nator of a variance estimate. As I pointed out in the previous section, the
denominator for SS
Residual
is N-2. The df for SS
Total
is N-1 (see Chapter 5 and
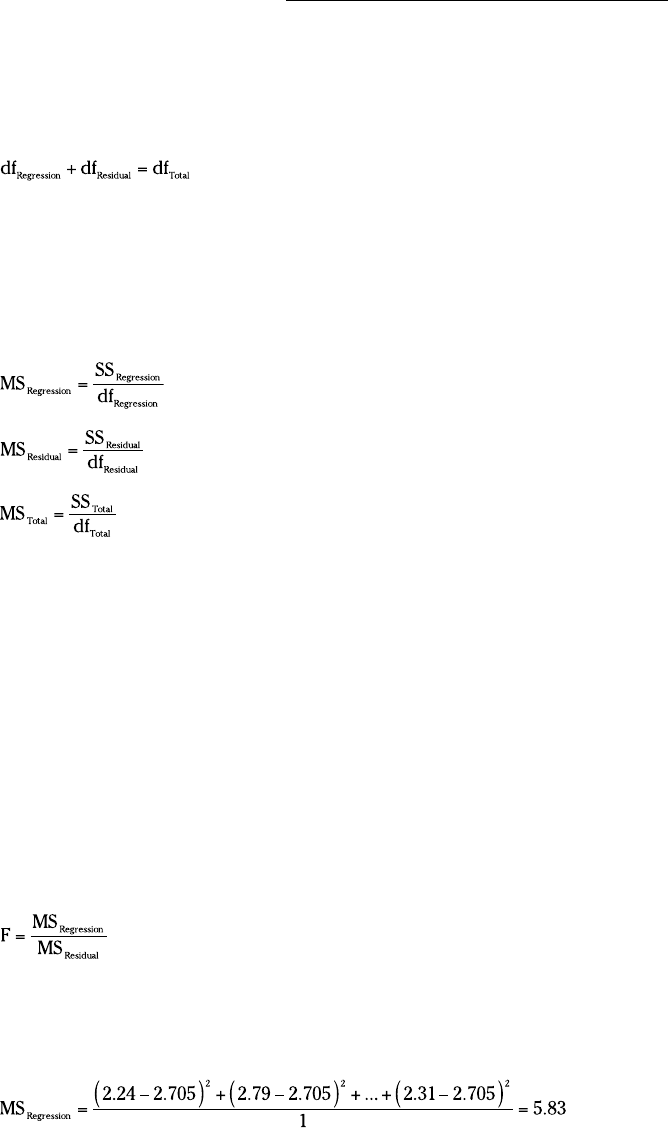
Chapter 12). As with the SS, the degrees of freedom add up:
This leaves one degree of freedom for Regression.
Where is this all headed, and what does it have to do with hypothesis test-
ing? Well, since you asked, you get variance estimates by dividing SS by
df. Each variance estimate is called a Mean Square, abbreviated MS (again,
Chapter 12):
Now for the hypothesis part. If H
0
is true and what looks like a relationship
between x and y is really no big deal, the piece that represents the gain in
prediction because of the regression line (MS
Regression
) should be no greater
than the variability around the regression line (MS
Residual
). If H
0
is not true,
and the gain in prediction is substantial, then MS
Regression
should be a lot
bigger than MS
Residual
.
So the hypotheses now set up as
H
0
: σ
2
Regression
≤ σ
2
Residual
H
1
: σ
2
Regression
> σ
2
Residual
These are hypotheses you can test. How? To test a hypothesis about two
variances, you use an F test (Chapter 11). The test statistic here is
To show you how it all works, I apply the formulas to the Sahusket example.
The MS
Residual
is the same as s
yx
2
from the preceding section, and that value is
0.16. The MS
Regression
is
20 454060-ch14.indd 26620 454060-ch14.indd 266 4/21/09 7:33:53 PM4/21/09 7:33:53 PM
267
Chapter 14: Regression: Linear and Multiple
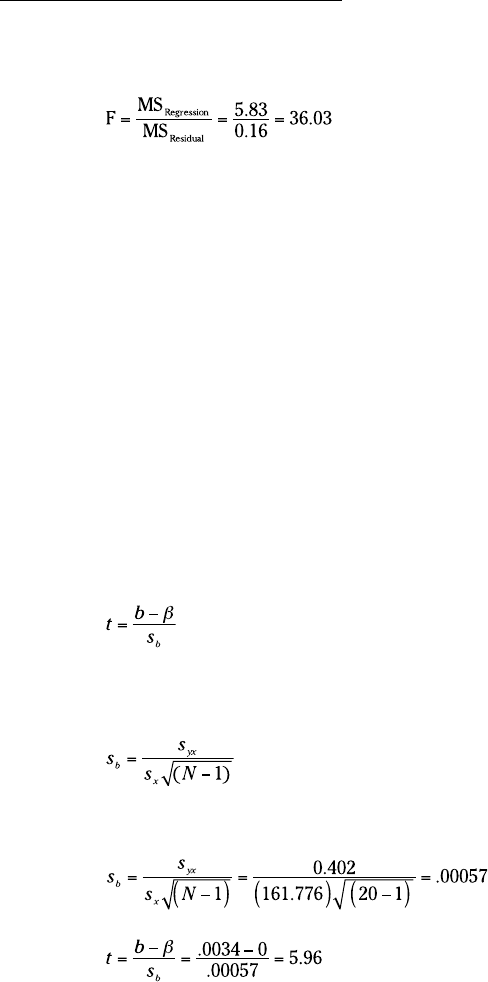
This sets up the F:
With 1 and 18 df and α = .05, the critical value of F is 4.41. (You can use the
worksheet function FINV to verify.) The calculated F is greater than the criti-
cal F, so the decision is to reject H
0
. That means the regression line provides
a good fit to the data in the sample.
Testing the slope
Another question that arises in linear regression is whether or not the slope
of the regression line is significantly different from zero. If it’s not, the mean
is just as good a predictor as the regression line.
The hypotheses for this test are:
H
0
: β ≤ 0
H
1
: β > 0
The statistical test is t, which I discuss in Chapters 9, 10, and 11 in connection
with means. The t-test for the slope is
with df = N-2. The denominator estimates the standard error of the slope.
This term sounds more complicated than it is. The formula is:
where s
x
is the standard deviation of the x-variable. For the data in the example
The actual value is 6.00. Rounding s
yx
and s
b
to a manageable number of deci-
mal places before calculating results in 5.96. Either way, this is larger than
the critical value of t for 18 df and α = .05 (2.10), so the decision is to reject
H
0
. This example, by the way, shows why it’s important to test hypotheses.
20 454060-ch14.indd 26720 454060-ch14.indd 267 4/21/09 7:33:54 PM4/21/09 7:33:54 PM
268
Part III: Drawing Conclusions from Data
The slope, 0.0034 looks like a very small number. (Possibly because it is a
very small number.) Still, it’s big enough to reject H
0
in this case.
Testing the intercept
For completeness, I include the hypothesis test for the intercept. I doubt you’ll
have much use for it, but it appears in the output of some of Excel’s regression-
related capabilities. I want you to understand all aspects of that output (which
I tell you about in a little while), so here it is.
The hypotheses are
H
0
: α = 0
H
1
: α ≠ 0
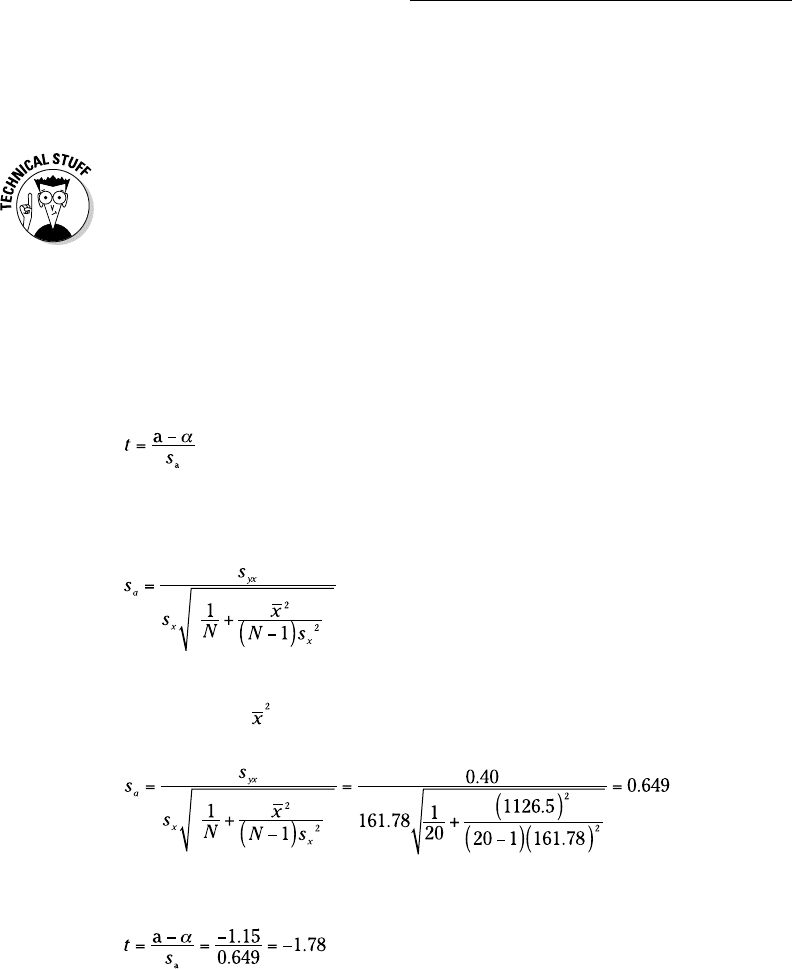
The test, once again, is a t-test. The formula is
The denominator is the estimate of the standard error of the intercept.
Without going into detail, the formula for s
a
is
where s
x
is the standard deviation of the x-variable, s
x
2
is the variance of the
x-variable, and
is the squared mean of the x-variable. Applying this formula
to the data in the example,
The t-test is
With 18 degrees of freedom, and the probability of a Type I error at .05, the
critical t is 2.45 for a two-tailed test. It’s a two-tailed test because H
1
is that
20 454060-ch14.indd 26820 454060-ch14.indd 268 4/21/09 7:33:54 PM4/21/09 7:33:54 PM