Schmuller J. Statistical Analysis with Excel For Dummies
Подождите немного. Документ загружается.

269
Chapter 14: Regression: Linear and Multiple
the intercept doesn’t equal zero — it doesn’t specify whether the intercept is
greater than zero or less than zero. Because the calculated value isn’t more
negative than the negative critical value, the decision is to not reject H
0
.
Worksheet Functions for Regression
Excel is a big help for computation-intensive work like linear regression. An
assortment of functions and data analysis tools makes life a lot easier. In this
section, I concentrate on the worksheet functions and on two array functions.
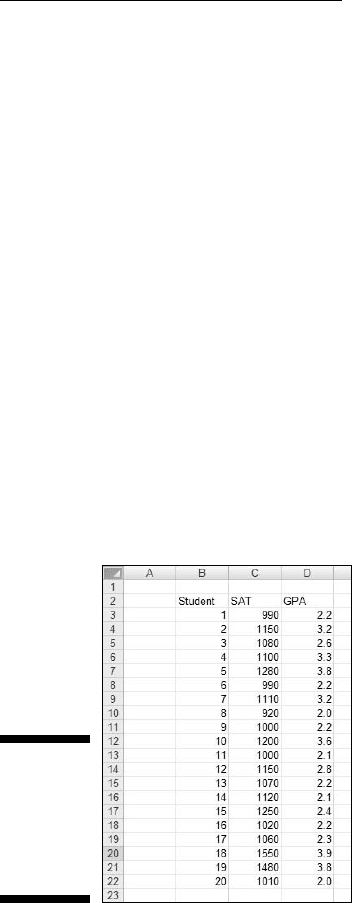
Figure 14-4 shows the data I use to illustrate each function. The data are GPA
and SAT scores for 20 students in the example I showed you earlier. As the
figure shows, the SAT scores are in C3:C22 and the GPAs are in D3:D22. The
SAT is the x-variable and GPA is the y-variable.
To clarify what the functions do, I defined names for the data arrays. I defined
SAT as the name for C3:C22 and I defined GPA as the name for D3:D22. That
way, I can use those names in the arguments for the functions. If you don’t
remember how to define a name for an array, go back to Chapter 2.
Figure 14-4:
Data for the
regression-
related
worksheet
functions.
SLOPE, INTERCEPT, STEYX
These three functions work the same way, so I give a general description and
provide details as necessary for each function.
20 454060-ch14.indd 26920 454060-ch14.indd 269 4/21/09 7:33:54 PM4/21/09 7:33:54 PM
270
Part III: Drawing Conclusions from Data
1. With the data entered, select a cell.
2. From the Statistical Functions menu, select a regression function to
open its Function Arguments dialog box.
• To calculate the slope of a regression line through the data, select
SLOPE.
• To calculate the intercept, select INTERCEPT.
• To calculate the standard error of estimate, select STEYX.
Figures 14-5, 14-6, and 14-7 show the Function Arguments dialog boxes
for these three functions.
3. In the Function Arguments dialog box, enter the appropriate values
for the arguments.
In the Known_y’s box, I entered the name for the cell range that holds
the scores for the y-variable. For this example, that’s GPA (defined as
the name for C3:C22).
In the Known_x’s box, I entered the name for the cell range that holds
the scores for the x-variable. For this example, it’s SAT (defined as the
name for D3:D22). After I enter this name, the answer appears in the
dialog box.
• SLOPE’s answer is .00342556 (Figure 14-5).
• INTERCEPT’s answer is –1.153832541 (Figure 14-6).
• STEYX’s answer is 0.402400043 (Figure 14-7).
4. Click OK to put the answer into the selected cell.
Figure 14-5:
The
Function
Arguments
dialog box
for SLOPE.
20 454060-ch14.indd 27020 454060-ch14.indd 270 4/21/09 7:33:54 PM4/21/09 7:33:54 PM
271
Chapter 14: Regression: Linear and Multiple
Figure 14-6:
The
Function
Arguments
dialog
box for
INTERCEPT.
Figure 14-7:
The
Function
Arguments
dialog box
for STEYX.
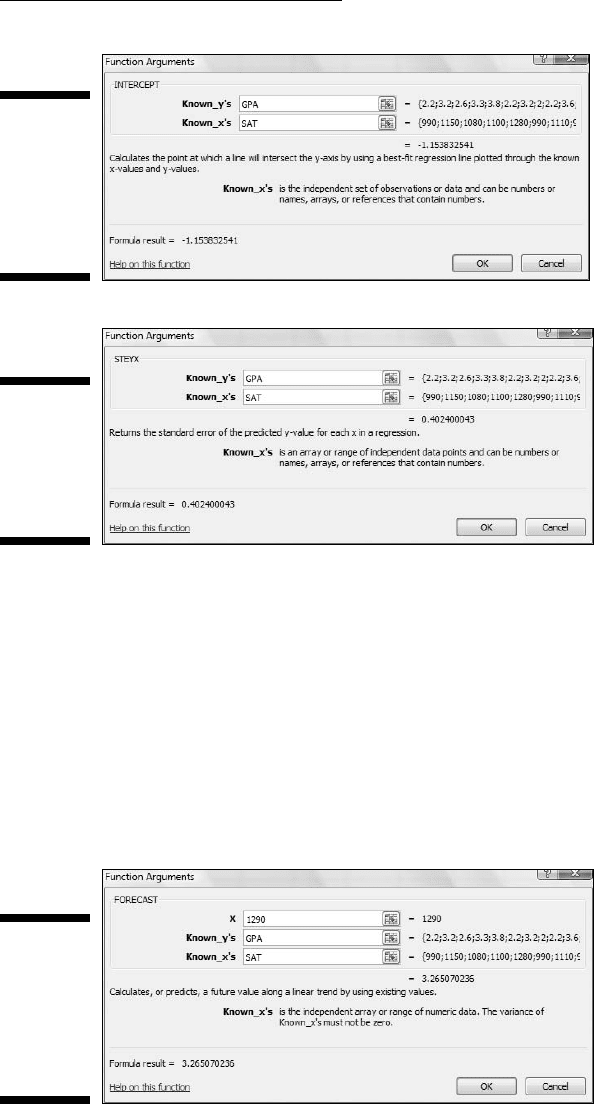
FORECAST
This one is a bit different from the preceding three. In addition to the col-
umns for the x-and-y variables, for FORECAST, you supply a value for x
and the answer is a prediction based on the linear regression relationship
between the x-variable and the y-variable.
Figure 14-8 shows the Function Arguments dialog box for FORECAST. In the
X box, I entered 1290. For this SAT, the figure shows the predicted GPA is
3.265070236.
Figure 14-8:
The
Function
Arguments
dialog
box for
FORECAST.
20 454060-ch14.indd 27120 454060-ch14.indd 271 4/21/09 7:33:55 PM4/21/09 7:33:55 PM
272
Part III: Drawing Conclusions from Data
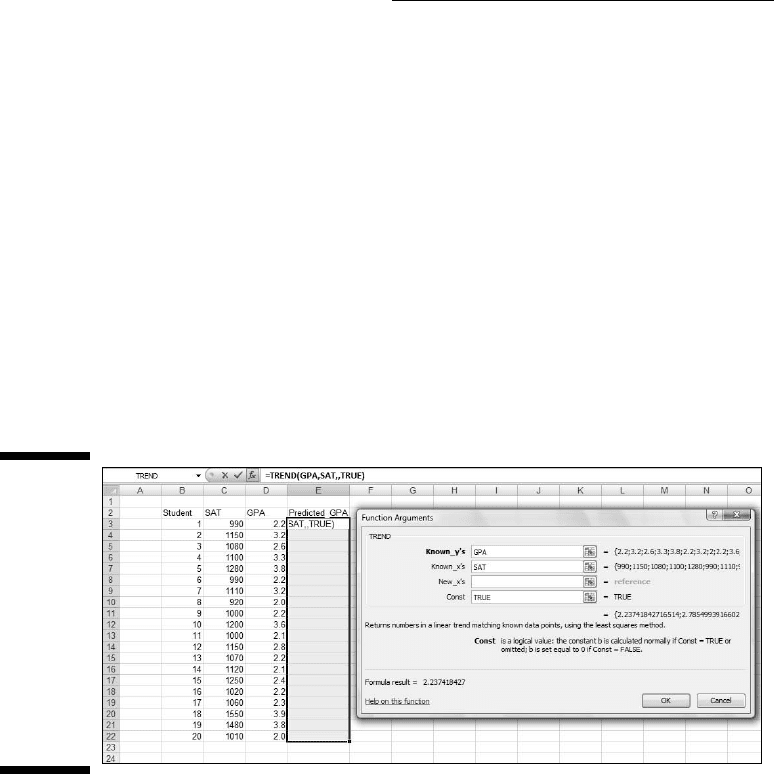
Array function: TREND
TREND is a versatile function. You can use TREND to generate a set of pre-
dicted y-values for the x-values in the sample.
You can also supply a new set of x-values and generate a set of predicted
y-values, based on the linear relationship in your sample. It’s like applying
FORECAST repeatedly in one fell swoop.
In this section, I go through both uses.
Predicting y’s for the x’s in your sample
First, I use TREND to predict GPAs for the 20 students in the sample.
Figure 14-9 shows TREND set up to do this. I include the Formula Bar in this
screen shot so you can see what the formula looks like for this use of TREND.
Figure 14-9:
The
Function
Arguments
dialog box
for TREND,
along with
data. TREND
is set up
to predict
GPAs for
the sample
SATs.
1. With the data entered, select a column for TREND’s answers.
I selected E3:E22. That puts the predicted GPAs right next to the sample
GPAs.
2. From the Statistical Functions menu, select TREND to open the
Function Arguments dialog box for TREND.
3. In the Function Arguments dialog box, enter the appropriate values
for the arguments.
In the Known_y’s box, enter the name for the cell range that holds the
scores for the y-variable. For this example, that’s GPA (D3:D22).
20 454060-ch14.indd 27220 454060-ch14.indd 272 4/21/09 7:33:55 PM4/21/09 7:33:55 PM
273
Chapter 14: Regression: Linear and Multiple
In the Known_x’s box, enter the name for the cell range that holds the
scores for the x-variable. For this example, it’s SAT (C3:C22).
I left the New_x’s box blank.
In the Const box, I typed TRUE (or leave it blank) to calculate the y-inter-
cept, or type FALSE to set the y-intercept to zero.
(I really don’t know why you’d enter FALSE.) A note of caution: In the
dialog box, the instruction for the Const box refers to b. That’s the
y-intercept. Earlier in the chapter, I use a to represent the y-intercept,
and b to represent the slope. No particular usage is standard for this.
4. IMPORTANT: Do NOT click OK. Because this is an array function,
press Ctrl+Shift+Enter to put TREND’s answers into the selected array.
Figure 14-10 shows the answers in E3:E22.
Figure 14-10:
The results
of TREND:
Predicted
GPAs for
the sample
SATs.
Predicting a new set of y’s for a new set of x’s
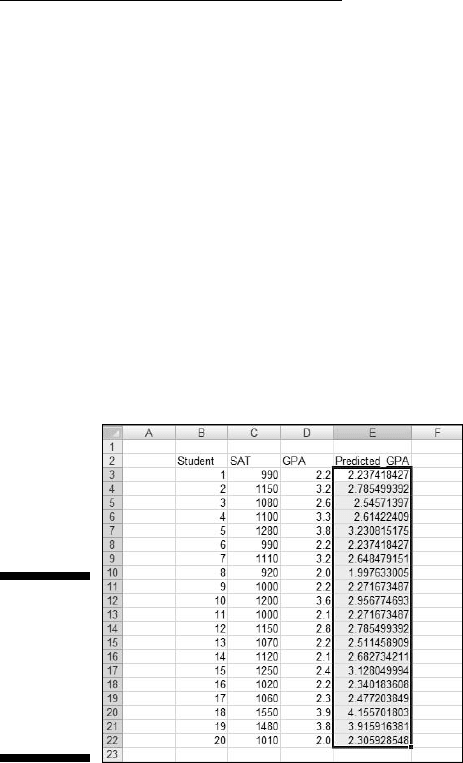
Here, I use TREND to predict GPAs for four new SAT scores. Figure 14-11
shows TREND set up for this, with the name New_SAT defined for the cell
range that holds the new scores. The figure also shows the selected cell
range for the results. Once again, I included the Formula Bar to show you the
formula for this use of the function.
20 454060-ch14.indd 27320 454060-ch14.indd 273 4/21/09 7:33:55 PM4/21/09 7:33:55 PM
274
Part III: Drawing Conclusions from Data
Figure 14-11:
The
Function
Arguments
dialog box
for TREND,
along with
data. TREND
is set up
to predict
GPAs for a
new set of
SATs.
1. With the data entered, select a cell range for TREND’s answers.
I selected G8:G11.
2. From the Statistical Functions menu, select TREND to open the
Function Arguments dialog box for TREND.
3. In the Function Arguments dialog box, enter the appropriate values
for the arguments.
In the Known_y’s box, enter the name of the cell range that holds the
scores for the y-variable. For this example, that’s GPA (D3:D22).
In the Known_x’s box, enter the name of the cell range that holds the
scores for the x-variable. For this example, it’s SAT (C3:C22).
In the New_x’s box, enter the name of the cell range that holds the new
scores for the x-variable. Here, that’s New_SAT (F8:F11).
In the Const box, the choices are to enter TRUE (or leave it blank) to cal-
culate the y-intercept, or FALSE to set the y-intercept to zero.I entered
TRUE. (Again, I really don’t know why you’d enter FALSE.)
4. IMPORTANT: Do NOT click OK. Because this is an array function,
press Ctrl+Shift+Enter to put TREND’s answers into the selected
column.
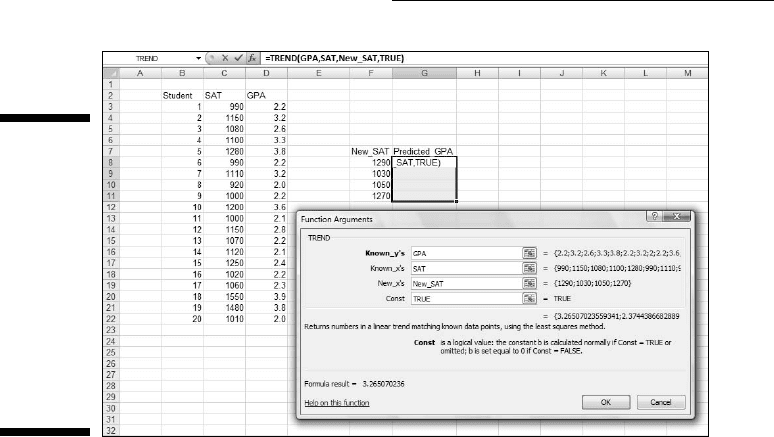
Figure 14-12 shows the answers in G8:G11. This time I included the
Formula Bar to show you that Excel now surrounds the formula with
curly brackets to indicate an array formula.
20 454060-ch14.indd 27420 454060-ch14.indd 274 4/21/09 7:33:55 PM4/21/09 7:33:55 PM
275
Chapter 14: Regression: Linear and Multiple
Figure 14-12:
The Results
of TREND:
Predicted
GPAs for a
new set of
SATs.
Array function: LINEST
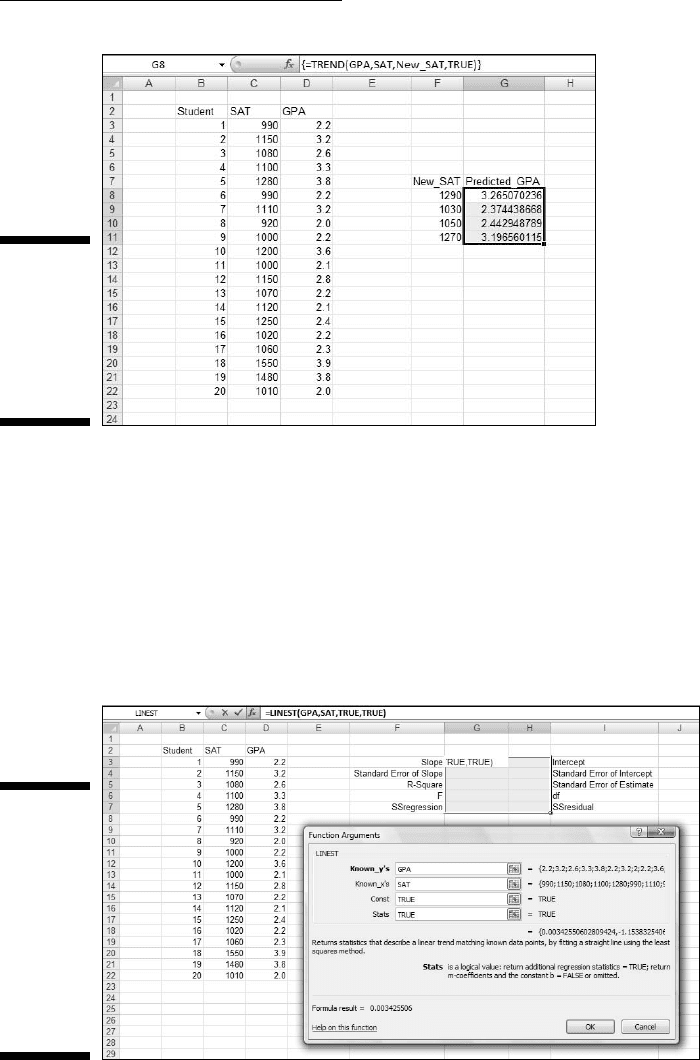
LINEST combines SLOPE, INTERCEPT, and STEYX, and throws in a few extras.
Figure 14-13 shows the Function Arguments dialog box for LINEST, along with
the data and the selected array for the answers. Notice that it’s a five-row-by-
two-column array. For linear regression, that’s what the selected array has to
be. How would you know the exact row-column dimensions of the array if I
didn’t tell you? Well . . . you wouldn’t.
Figure 14-13:
The
Function
Arguments
dialog box
for LINEST,
along with
the data and
the selected
array for the
results.
20 454060-ch14.indd 27520 454060-ch14.indd 275 4/21/09 7:33:56 PM4/21/09 7:33:56 PM

276
Part III: Drawing Conclusions from Data
Here are the steps for using LINEST:
1. With the data entered, select a five-row-by-two-column array of cells
for LINEST’s results.
I selected G3:H7.
2. From the Statistical Functions menu, select LINEST to open the
Function Arguments dialog box for LINEST.
3. In the Function Arguments dialog box, enter the appropriate values
for the arguments.
In the Known_y’s box, I entered the name of the cell range that holds the
scores for the y-variable. For this example, that’s GPA (D3:D22).
In the Known_x’s box, I entered the name of the cell range that holds the
scores for the x-variable. For this example, it’s SAT (C3:C22).
In the Const box, the choices are to enter TRUE (or leave it blank) to
calculate the y-intercept, or FALSE to set the y-intercept to zero. .I
entered TRUE.
In the Stats box, the choices are to enter TRUE to return regression sta-
tistics in addition to the slope and the intercept, or FALSE (or leave it
blank) to return just the slope and the intercept. I entered TRUE.
In the dialog box, b refers to intercept and m-coefficient refers to slope.
As I said earlier, no set of symbols is standard for this.
4. IMPORTANT: Do NOT click OK. Because this is an array function,
press Ctrl+Shift+Enter to put LINEST’s answers into the selected array.
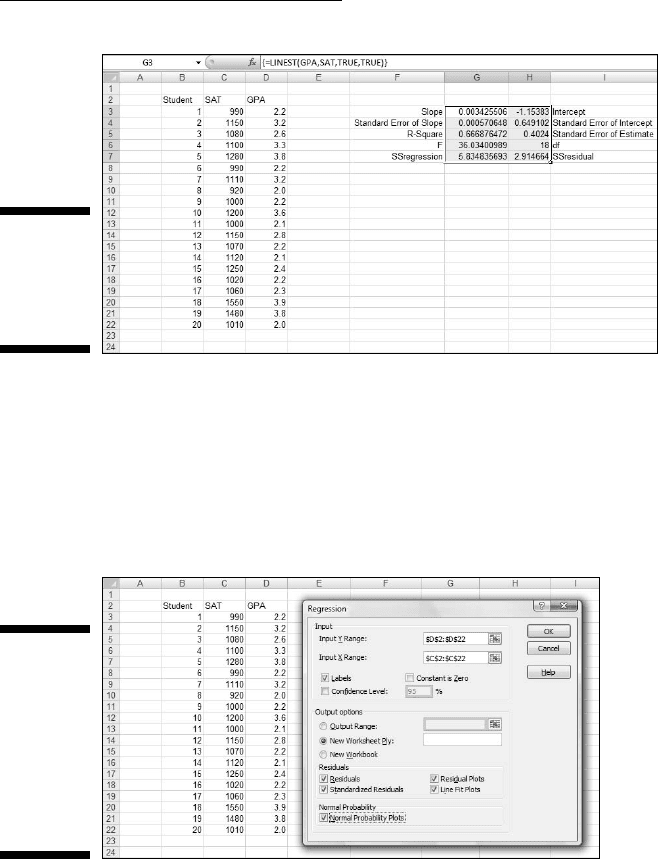
Figure 14-14 shows LINEST’s results. They’re not labeled in any way, so I
added the labels for you in the worksheet. The left column gives you the
slope, standard error of the slope, something called “R Square,” F, and the
SS
regression
. What’s R Square? That’s another measure of the strength of the
relationship between SAT and GPA in the sample. I discuss it in detail in
Chapter 15.
The right column provides the intercept, standard error of the intercept,
standard error of estimate, degrees of freedom, and SS
residual
.
20 454060-ch14.indd 27620 454060-ch14.indd 276 4/21/09 7:33:56 PM4/21/09 7:33:56 PM
277
Chapter 14: Regression: Linear and Multiple
Figure 14-14:
LINEST’s
results in
the selected
array.
Data Analysis Tool: Regression
Excel’s Regression data analysis tool does everything LINEST does (and
more) and labels the output for you, too. Figure 14-15 shows the Regression
tool’s dialog box, along with the data for the SAT-GPA example.
Figure 14-15:
The
Regression
data
analysis tool
dialog box,
along with
the SAT-
GPA data.
The steps for using this tool are:
1. Type the data into the worksheet, and include labels for the columns.
2. Select Data | Data Analysis to open the Data Analysis dialog box.
20 454060-ch14.indd 27720 454060-ch14.indd 277 4/21/09 7:33:56 PM4/21/09 7:33:56 PM

278
Part III: Drawing Conclusions from Data
3. In the Data Analysis dialog box, scroll down the Analysis Tools list
and select Regression. Click OK to open the Regression dialog box.
This is the dialog box in Figure 14-15.
4. In the Input Y Range box, enter the cell range that holds the data for
the y-variable.
For the example, the GPAs (including the label) are in $D$2:$D$22. Note
the $-signs for absolute referencing.
5. In the Input X Range box, enter the cell range that holds the data for
the x-variable.
The SATs (including the label) are in $C$2:$C$22.
6. If the cell ranges include column headings, check the Labels checkbox.
I included the headings in the ranges, so I checked the box.
7. The Alpha box has 0.05 as a default. Change that value if you want a
different alpha.
8. In the Output Options, select a radio button to indicate where you
want the results.
I selected New Worksheet Ply to put the results on a new page in the
worksheet.
9. The Residuals area provides four capabilities for viewing the devia-
tions between the data points and the predicted points. Check as
many as you like.
I selected all four. I’ll explain them when I show you the output.
10. Select the Normal Probability Plots option if you want to produce a
graph of the percentiles of the y-variable.
I checked this one so I could show it to you in the output.
11. Click OK.
Because I selected New Worksheet Ply, a newly created page opens with
the results.
A word about Steps 4 and 5: You’ll notice I didn’t enter the names for the
cell ranges (GPA and SAT). Instead I entered the ranges ($D$2:$D$22 and
$C$2:$C$22). Why? When I define a name for a cell range, I don’t include the
cell that holds the name (for reasons I explain in Chapter 2). Following this
practice, however, creates a small hurdle when you use a data analysis tool:
You can’t check the Labels checkbox if the defined names aren’t in the named
range. Checking that checkbox makes the variable names show up in the
output — which is a good thing. So . . . I just enter the cell range including the
name cell and check the Labels checkbox.
20 454060-ch14.indd 27820 454060-ch14.indd 278 4/21/09 7:33:56 PM4/21/09 7:33:56 PM