Schmuller J. Statistical Analysis with Excel For Dummies
Подождите немного. Документ загружается.

289
Chapter 14: Regression: Linear and Multiple
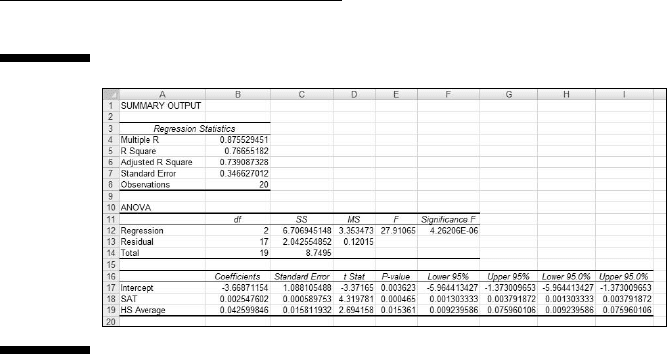
Figure 14-25:
Part of
the output
from the
Regression
data analy-
sis tool: The
ANOVA
table
and the
Coefficients
table.
If you go through the example, you’ll see the table of residuals in the output.
Compare the absolute values of the residuals from the linear regression with
the absolute values of the residuals from the multiple regression; you’ll see
the multiple ones are smaller, on average.
The graphic output has some additions, too: A scatterplot of HS Average and
GPA that also shows predicted GPAs, and a plot of residuals and HS Average.
20 454060-ch14.indd 28920 454060-ch14.indd 289 4/21/09 7:33:59 PM4/21/09 7:33:59 PM

290
Part III: Drawing Conclusions from Data
20 454060-ch14.indd 29020 454060-ch14.indd 290 4/21/09 7:33:59 PM4/21/09 7:33:59 PM

Chapter 15
Correlation: The Rise and Fall of
Relationships
In This Chapter
▶ What correlation is all about
▶ How correlation connects to regression
▶ Conclusions from correlations
▶ Analyzing items
I
n Chapter 14, I show you the ins and outs of regression, a tool for sum-
marizing relationships between (and among) variables. In this chapter,
I introduce you to the ups and downs of correlation, another tool for looking
at relationships.
I use the example of SAT and GPA from Chapter 14, and show how to think
about the data in a slightly different way. The new concepts connect to what
I showed you in the preceding chapter, and you’ll see how that works. I also
show you how to test hypotheses about relationships and how to use Excel
functions and data analysis tools for correlation.
Scatterplots Again
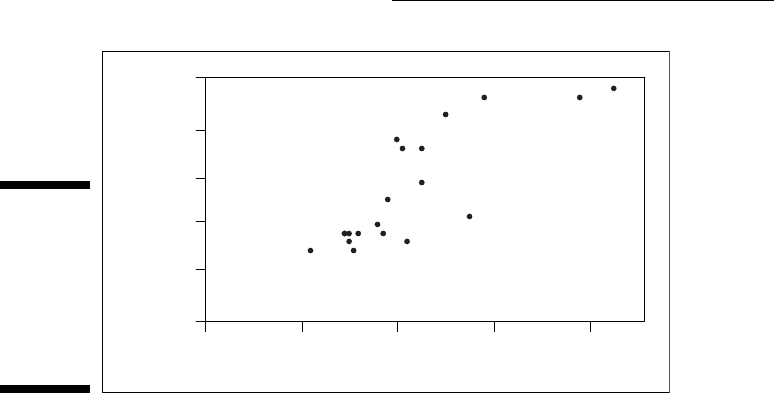
A scatterplot is a graphic way of showing a relationship between two vari-
ables. Figure 15-1 is a scatterplot that represents the GPAs and SAT scores of
20 students at the fictional Sahusket University. The GPAs are on a 4.0 scale
and the SATs are combined Verbal and Math.
Each point represents one student. A point’s location in the horizontal direc-
tion represents the student’s SAT. That same point’s location in the vertical
direction represents the student’s GPA.
21 454060-ch15.indd 29121 454060-ch15.indd 291 4/21/09 7:34:46 PM4/21/09 7:34:46 PM
292
Part III: Drawing Conclusions from Data
Figure 15-1:
A scatter-
plot of 20
students’
SAT and
GPA at
Sahusket
University.
SAT
GPA
700 900 1100 1300 1500
4.0
3.5
3.0
2.5
2.0
1.5
Understanding Correlation
In Chapter 14, I refer to the SAT as the independent variable and to the GPA as
the dependent variable. The objective in Chapter 14 was to use SAT to predict
GPA. Here’s a very important point: Although I use scores on one variable to
predict scores on the other, I do not mean that the score on one variable causes
a score on the other. “Relationship” doesn’t necessarily mean “causality.”
Correlation is a statistical way of looking at a relationship. When two things
are correlated, it means that they vary together. Positive correlation means
that high scores on one are associated with high scores on the other, and
that low scores on one are associated with low scores on the other. The scat-
terplot in Figure 15-1 is an example of positive correlation.
Negative correlation, on the other hand, means that high scores on the first
thing are associated with low scores on the second. Negative correlation
also means that low scores on the first are associated with high scores on
the second. An example is the correlation between body weight and the time
spent on a weight-loss program. If the program is effective, the higher the
amount of time spent on the program, the lower the body weight. Also, the
lower the amount of time spent on the program, the higher the body weight.
Table 15-1, a repeat of Table 14-2, shows the data from the scatterplot.
21 454060-ch15.indd 29221 454060-ch15.indd 292 4/21/09 7:34:47 PM4/21/09 7:34:47 PM

293
Chapter 15: Correlation: The Rise and Fall of Relationships
Table 15-1 SAT Scores and GPAs for 20 Sahusket
University Students
Student SAT GPA
1 990 2.2
2 1150 3.2
3 1080 2.6
4 1100 3.3
5 1280 3.8
6 990 2.2
7 1110 3.2
8 920 2.0
9 1000 2.2
10 1200 3.6
11 1000 2.1
12 1150 2.8
13 1070 2.2
14 1120 2.1
15 1250 2.4
16 1020 2.2
17 1060 2.3
18 1550 3.9
19 1480 3.8
20 1010 2.0
Mean 1126.5 2.705
Variance 26171.32 0.46
Standard Deviation 161.78 0.82
In keeping with the way I used SAT and GPA in Chapter 14, SAT is the x-vari-
able and GPA is the y-variable.
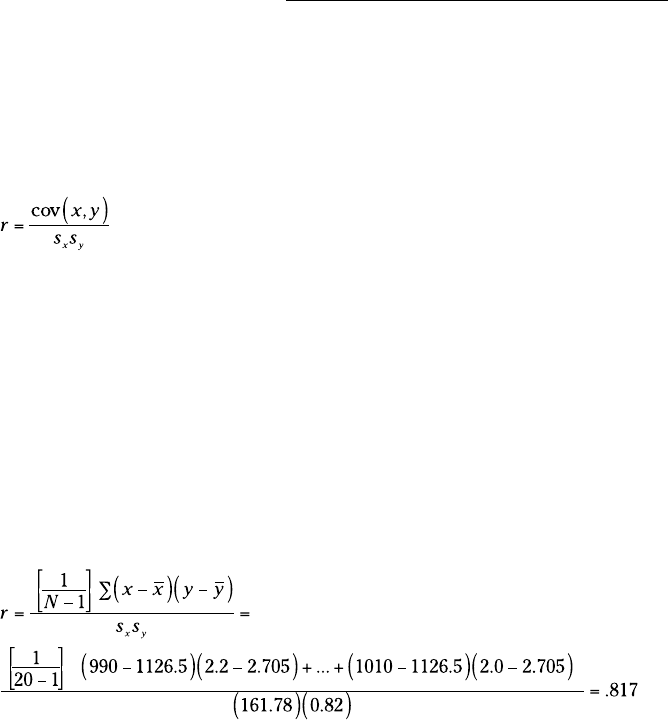
The formula for calculating the correlation between the two is
21 454060-ch15.indd 29321 454060-ch15.indd 293 4/21/09 7:34:47 PM4/21/09 7:34:47 PM
294
Part III: Drawing Conclusions from Data
The term on the left, r, is called the correlation coefficient. It’s also called
Pearson’s product-moment correlation coefficient after its creator Karl Pearson.
The two terms in the denominator on the right are the standard deviation of
the x-variable and the standard deviation of the y-variable. The term in the
numerator is called the covariance. So another way to write this formula is
The covariance represents x and y varying together. Dividing the covariance
by the product of the two standard deviations imposes some limits. The
lower limit of the correlation coefficient is –1.00, and the upper limit is +1.00.
A correlation coefficient of –1.00 represents perfect negative correlation (low
x-scores associated with high y-scores, and high x-scores associated with
low y-scores.) A correlation of +1.00 represents perfect positive correlation
(low x-scores associated with low y-scores and high x-scores associated with
high y-scores.) A correlation of 0.00 means that the two variables are not
related.
Applying the formula to the data in Table 15-1,
What, exactly, does this number mean? I’m about to tell you.
Correlation and Regression
Figure 15.2 shows the scatterplot with the line that “best fits” the points. It’s
possible to draw an infinite number of lines through these points. Which one
is best?
To be “best,” a line has to meet a specific standard: If you draw the distances
in the vertical direction between the points and the line, and you square
those distances, and then you add those squared distances, the best fitting
line is the one that makes the sum of those squared distances as small as
possible. This line is called the regression line.
21 454060-ch15.indd 29421 454060-ch15.indd 294 4/21/09 7:34:47 PM4/21/09 7:34:47 PM
295
Chapter 15: Correlation: The Rise and Fall of Relationships
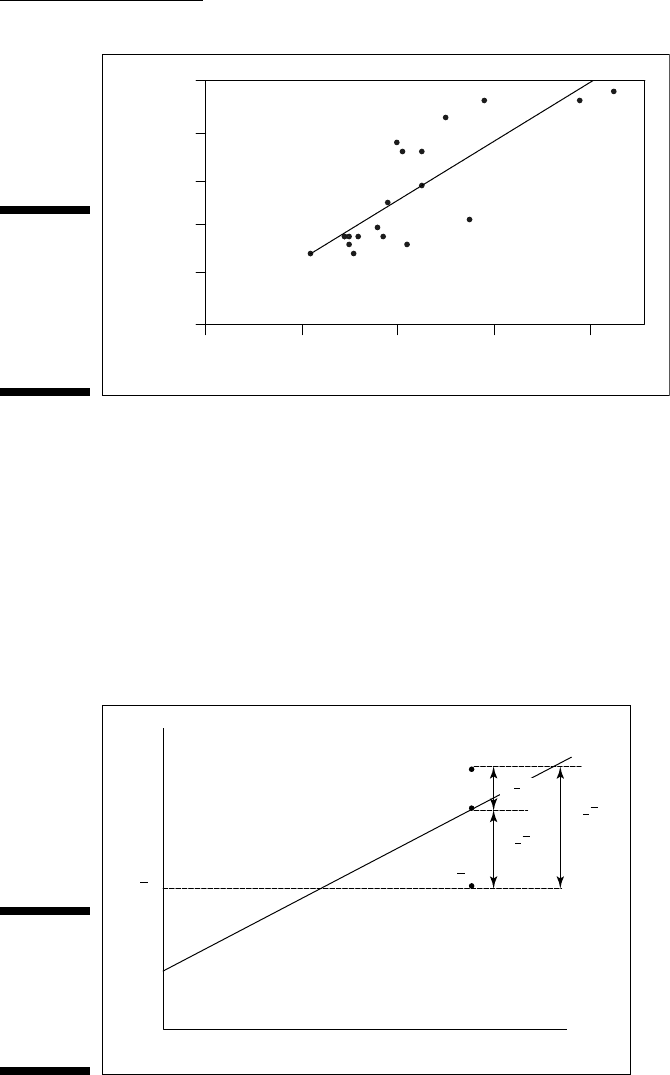
Figure 15-2:
Scatterplot
of the 20
students,
including
the regres-
sion line.
SAT
GPA
700 900 1100 1300 1500
4.0
3.5
3.0
2.5
2.0
1.5
The regression line’s purpose in life is to enable you to make predictions. As I
mention in Chapter 14, without a regression line your best predicted value of
the y-variable is the mean of the y’s. A regression line takes the x-variable into
account and delivers a more precise prediction. Each point on the regression
line represents a predicted value for y. In the symbology of regression, each
predicted value is a y’.
Why do I tell you all of this? Because correlation is closely related to regres-
sion. Figure 15-3 focuses on one point in the scatterplot, and its distance to
the regression line and to the mean. (This is a repeat of Figure 14-3.)
Figure 15-3:
One point in
the scatter-
plot and its
associated
distances.
x
y
(')yy
(' )yy
()yy
(,)xy
(, ')xy
y
(, )xy
21 454060-ch15.indd 29521 454060-ch15.indd 295 4/21/09 7:34:47 PM4/21/09 7:34:47 PM
296
Part III: Drawing Conclusions from Data
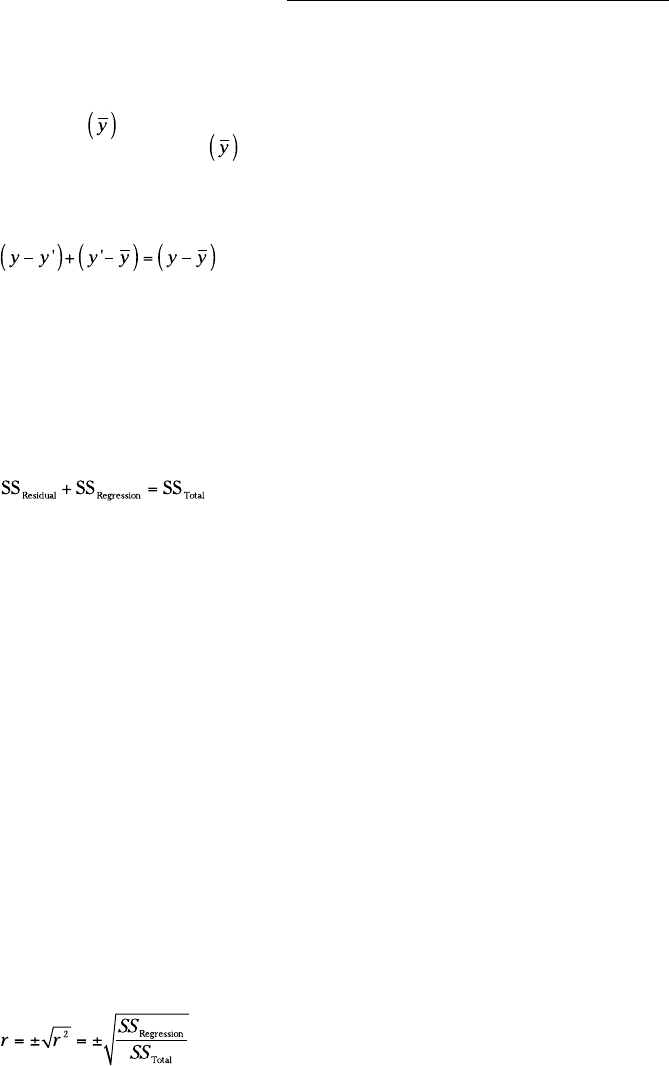
Notice the three distances laid out in the Figure. The distance labeled (y-y’)
is the difference between the point and the regression line’s prediction for
where the point should be. (In Chapter 14, I call that a residual.) The distance
labeled y-
is the difference between the point and the mean of the y’s.
The distance labeled y’-
is the gain in prediction ability that you get from
using the regression line to predict the point instead of using the mean.
Figure 15-3 shows the three distances are related like this:
As I point out in Chapter 14, you can square all the residuals and add them,
square all the deviations of the predicted points from the mean and add
them, and square all the deviations of the actual points from the mean and
add them, too.
It turns out that these sums of squares are related in the same way as the
deviations I just showed you:
If SS
Regression
is large in comparison to SS
Residual
, that indicates that the relation-
ship between the x-variable and the y-variable is a strong one. It means that
throughout the scatterplot, the variability around the regression line is small.
On the other hand, if SS
Regression
is small in comparison to SS
Residual
, that
means that the relationship between the x-variable and the y-variable is weak.
In this case, the variability around the regression line is large throughout the
scatterplot.
One way to test SS
Regression
against SS
Residual
is to divide each by its degrees
of freedom (1 for SS
Regression
and N-2 for SS
Residual
) to form variance estimates
(also known as Mean Squares, or MS), and then divide one by the other to
calculate an F. If MS
Regression
is significantly larger than MS
Residual
, you have evi-
dence that the x-y relationship is strong. (See Chapter 14 for details.)
Here’s the clincher, as far as correlation is concerned: Another way to
assess the size of SS
Regression
is to compare it with SS
Total
. Divide the first by
the second. If the ratio is large, this tells you the x-y relationship is strong.
This ratio has a name. It’s called the coefficient of determination. Its symbol is
r
2
. Take the square root of this coefficient, and you have . . . the correlation
coefficient!
21 454060-ch15.indd 29621 454060-ch15.indd 296 4/21/09 7:34:47 PM4/21/09 7:34:47 PM
297
Chapter 15: Correlation: The Rise and Fall of Relationships
The plus-or-minus sign (±) means that r is either the positive or negative
square root, depending on whether the slope of the regression line is positive
or negative.
So, if you calculate a correlation coefficient and you quickly want to know
what its value signifies, just square it. The answer — the coefficient of deter-
mination — lets you know the proportion of the SS
Total
that’s tied up in the
relationship between the x-variable and the y-variable. If it’s a large propor-
tion, the correlation coefficient signifies a strong relationship. If it’s a small
proportion, the correlation coefficient signifies a weak relationship.
In the GPA-SAT example, the correlation coefficient is .817. The coefficient of
determination is
In this sample of 20 students, the SS
Regression
is 66.7 percent of the SS
Total
.
Sounds like a large proportion, but what’s large? What’s small? Those ques-
tions scream out for hypothesis tests.
Testing Hypotheses About Correlation
In this section, I show you how to answer important questions about cor-
relation. Like any other kind of hypothesis testing, the idea is to use sample
statistics to make inferences about population parameters. Here, the sample
statistic is r, the correlation coefficient. By convention, the population param-
eter is ρ (rho), the Greek equivalent of r. (Yes, it does look like our letter p,
but it really is the Greek equivalent of r.)
Two kinds of questions are important in connection with correlation: (1) Is a
correlation coefficient greater than zero? (2) Are two correlation coefficients
different from one another?
Is a correlation coefficient
greater than zero?
Returning once again to the Sahusket SAT-GPA example, you can use the
sample r to test hypotheses about the population ρ — the correlation coef-
ficient for all students at Sahusket University.
21 454060-ch15.indd 29721 454060-ch15.indd 297 4/21/09 7:34:48 PM4/21/09 7:34:48 PM
298
Part III: Drawing Conclusions from Data
Assuming we know in advance (before we gather any sample data), that any
correlation between SAT and GPA should be positive, the hypotheses are:
H
0
: ρ ≤ 0
H
1
: ρ > 0
I set α = .05.
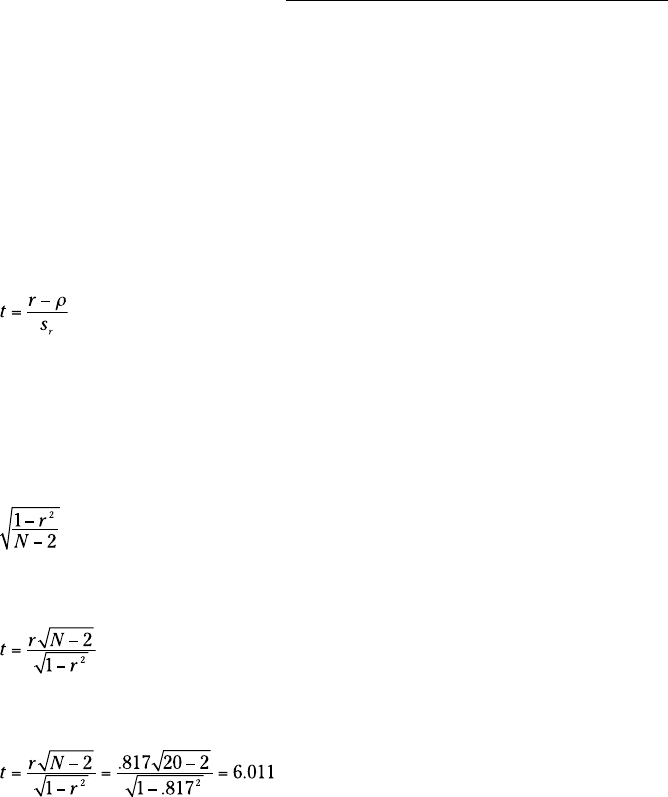
The appropriate statistical test is a t-test. The formula is:
This test has N-2 df.
For the example, the values in the numerator are set: r is .817 and ρ (in H
0
) is
zero. What about the denominator? I won’t burden you with the details. I’ll
just tell you that’s
With a little algebra, the formula for the t-test simplifies to
For the example,
With df = 18 and α = .05 (one-tailed), the critical value of t is 2.10 (use the
worksheet function TINV to check). Because the calculated value is greater
than the critical value, the decision is to reject H
0
.
Do two correlation coefficients differ?
In a sample of 24 students at Farshimmelt College, the correlation between
SAT and GPA is .752. Is this different from the correlation (.817) at Sahutsket
University? If I have no way of assuming that one correlation should be
higher than the other, the hypotheses are:
21 454060-ch15.indd 29821 454060-ch15.indd 298 4/21/09 7:34:48 PM4/21/09 7:34:48 PM