Schmuller J. Statistical Analysis with Excel For Dummies
Подождите немного. Документ загружается.

239
Chapter 12: Testing More Than Two Samples
Figure 12-7:
The Anova:
Two Factor
Without
Replication
data
analysis tool
dialog box.
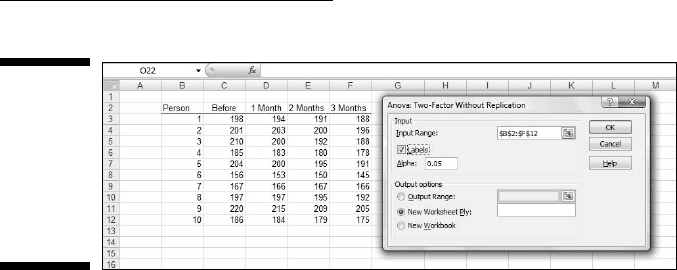
The steps for using this tool are:
1. Type the data for each sample into a separate data array. Put the label
for each person in a data array.
For this example the labels for Person are in column B. The data in the
Before sample are in column C, the data in the 1 Month sample are in
column D, the data for the 2 Month sample are in column E, and the data
for the 3 Month sample are in column F.
2. Select Data | Data Analysis to open the Data Analysis dialog box.
3. In the Data Analysis dialog box, scroll down the Analysis Tools list
and select Anova: Two Factor Without Replication. Click OK to open
the select Anova: Two Factor Without Replication dialog box.
This is the dialog box in Figure 12-7.
4. In the Input Range box, type the cell range that holds all the data.
For the example, the data are in $B$2:$F$12. Note the $-signs for abso-
lute referencing. Note also — and this is important — the Person column
is part of the data.
5. If the cell ranges include column headings, select the Labels option.
I included the headings in the ranges, so I checked the box.
6. The Alpha box has 0.05 as a default. Change that value if you want a
different α.
7. In the Output Options, select a radio button to indicate where you
want the results.
I selected New Worksheet Ply to put the results on a new page in the
worksheet.
8. Click OK.
Because I selected New Worksheet Ply, a newly created page opens with
the results.
18 454060-ch12.indd 23918 454060-ch12.indd 239 4/21/09 7:31:39 PM4/21/09 7:31:39 PM
240
Part III: Drawing Conclusions from Data
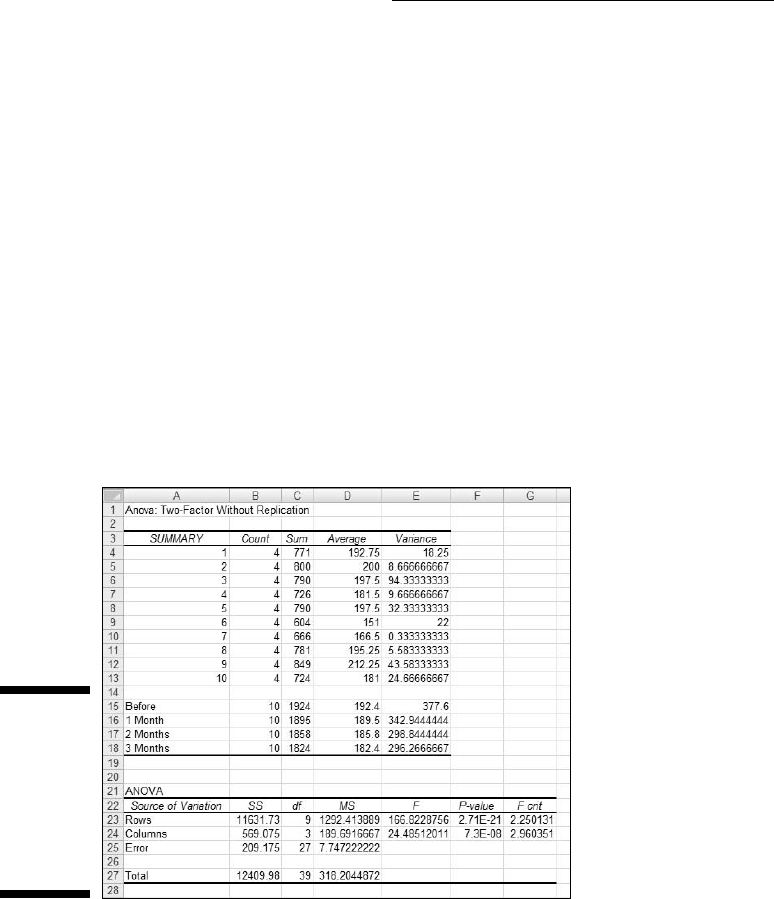
Figure 12-8 shows the tool’s output, after I expanded the columns. The output
features two tables, SUMMARY and ANOVA.
The SUMMARY table is in two parts. The first part provides summary sta-
tistics for the rows. The second part provides summary statistics for the
columns. Summary statistics include the number of scores in each row and in
each column along with the sums, means, and variances.
The ANOVA table presents the Sums of Squares, df, Mean Squares, F,
P-values, and critical F-ratios for the indicated df. The table features
two values for F. One F is for the rows, the other for the columns. The
P-value is the proportion of area that the F cuts off in the upper tail of the
F-distribution. If this value is less than .05, reject H
0
.
Although the ANOVA table includes an F for the rows, this doesn’t concern
you in this case, as H
0
is only about the columns in the data. Each row repre-
sents the data for one person. A high F just implies that people are different
from one another, and that’s not news.
Figure 12-8:
Output from
the Anova:
Two Factor
Without
Replication
data analy-
sis tool.
Analyzing trend
Excel’s Anova: Two Factor Without Replication tool does not provide a way
for performing a trend analysis. As with the planned comparisons, a little
ingenuity takes you a long way. The Excel worksheet functions SUMPRODUCT
and SUMSQ help with the calculations.
18 454060-ch12.indd 24018 454060-ch12.indd 240 4/21/09 7:31:39 PM4/21/09 7:31:39 PM
241
Chapter 12: Testing More Than Two Samples
The worksheet page with the ANOVA output gives the information you need
to get started. In this section, I take you through the analysis of linear trend.
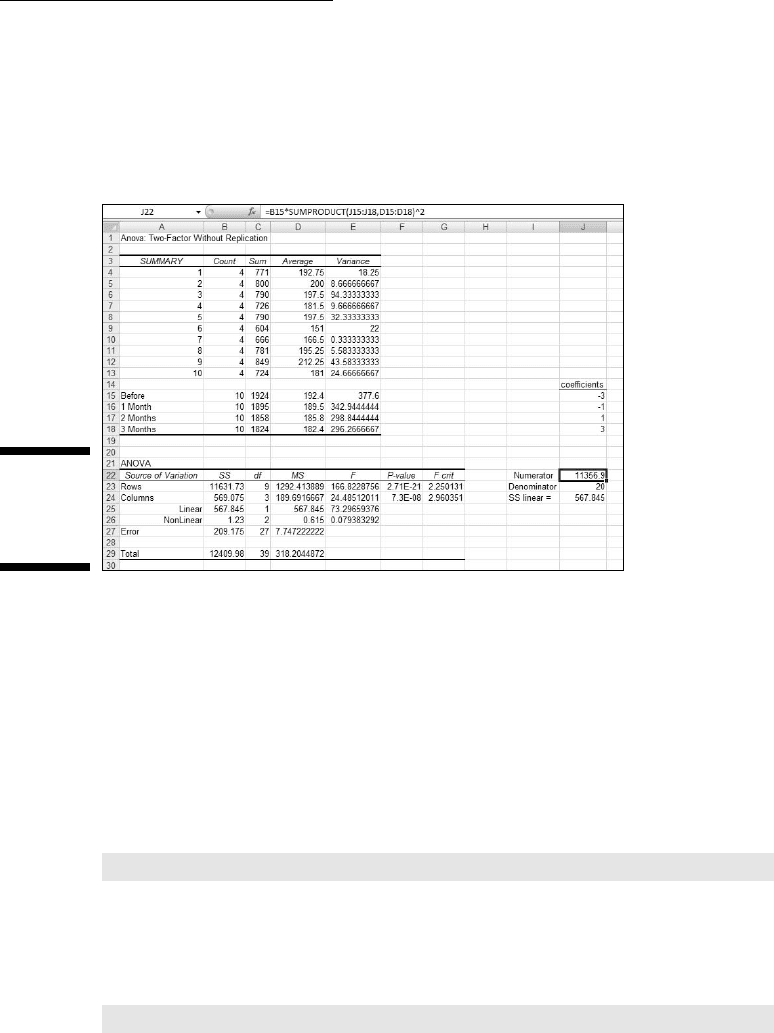
I start by putting the comparison coefficients for linear trend into J15 through
J18, as shown in Figure 12-9.
Figure 12-9:
Carrying
out a trend
analysis.
In J22 through J24, I put information related to SS
Linear
— the numerator, the
denominator, and the value of the Sum of Squares. I use separate cells for the
numerator and denominator to simplify the formulas.
As I pointed out before, SUMPRODUCT takes arrays of cells, multiplies the
numbers in the corresponding cells, and sums the products. (This func-
tion is on the Math & Trig menu, not the Statistical Functions menu.) I used
SUMPRODUCT to multiply each coefficient by each sample mean and then
add the products. I stored that result in J22. That’s the numerator for the
SS
Linear
. I selected J22 so you could see its formula in the Formula bar:
=B15*SUMPRODUCT(J15:J18,D15:D18)^2
The value in B15 is the number in each column. The array J15:J18 holds the
comparison coefficients, and D15:D18 holds the column means.
J23 holds the denominator. Its formula is:
=SUMSQ(J15:J18)
18 454060-ch12.indd 24118 454060-ch12.indd 241 4/21/09 7:31:39 PM4/21/09 7:31:39 PM

242
Part III: Drawing Conclusions from Data
SUMSQ (another function on the Math & Trig Functions menu) squares the
coefficients in J15:J18 and adds them.
J24 holds the value for SS
Linear
. That’s J22 divided by J23.
Figure 12-9 shows that in the ANOVA table I’ve inserted two rows above
the row for Error. One row holds the SS, df, MS, F, P-Value and critical F for
Linear, the other holds these values for Nonlinear. SS
Nonlinear
in B26 is B24-B25.
The F for Linear is D25 divided by D27. The formula for the P-Value in F25 is
=FDIST(E25,C25,C27)
The first argument, E25, is the F. The second and third arguments are the df.
The formula for the critical F in F25 is
=FINV(0.05,C25,C27)
The first argument is α, and the second and third are the df.
18 454060-ch12.indd 24218 454060-ch12.indd 242 4/21/09 7:31:39 PM4/21/09 7:31:39 PM

Chapter 13
Slightly More Complicated Testing
In This Chapter
▶ Working with two variables
▶ Working with replications
▶ Understanding interactions
I
n Chapter 11, I show you how to test hypotheses with two samples. In
Chapter 12, I show you how to test hypotheses when you have more than
two samples. The common thread through both chapters is that one indepen-
dent variable (also called a factor) is involved.
Many times, you have to test the effects of more than one factor. In this
Chapter, I show how to analyze two factors within the same set of data.
Several types of situations are possible, and I describe Excel data analysis
tools that deal with each one.
Cracking the Combinations
FarKlempt Robotics, Inc., manufactures battery-powered robots. They want
to test three rechargeable batteries for these robots on a set of three tasks —
climbing, walking, and assembling. Which combination of battery and task
results in the longest battery life?
They test a sample of nine robots. They randomly assign each robot one bat-
tery and one type of task. FarKlempt tracks the number of days each robot
works before recharging. The data are in Table 13-1.
19 454060-ch13.indd 24319 454060-ch13.indd 243 4/21/09 7:33:07 PM4/21/09 7:33:07 PM
244
Part III: Drawing Conclusions from Data
Table 13-1 FarKlempt Robots: Number of Days before
Recharging in Three Tasks with Three Batteries
Task Battery 1 Battery 2 Battery 3 Average
Climbing 12 15 20 15.67
Walking 14 16 19 16.33
Assembling 11 14 18 14.33
Average 12.33 15.00 19.00 15.44
This calls for two hypothesis tests:
H
0
: μ
Battery1
= μ
Battery2
= μ
Battery3
H
1
: Not H
0
and
H
0
: μ
Climbing
= μ
Walking
= μ
Assembling
H
1
: Not H
0
In both tests, set α = .05.
Breaking down the variances
The appropriate analysis for these tests is an analysis of variance (ANOVA).
Each variable — Batteries and Tasks — is also called a factor. So this analysis
is called a two-factor ANOVA.
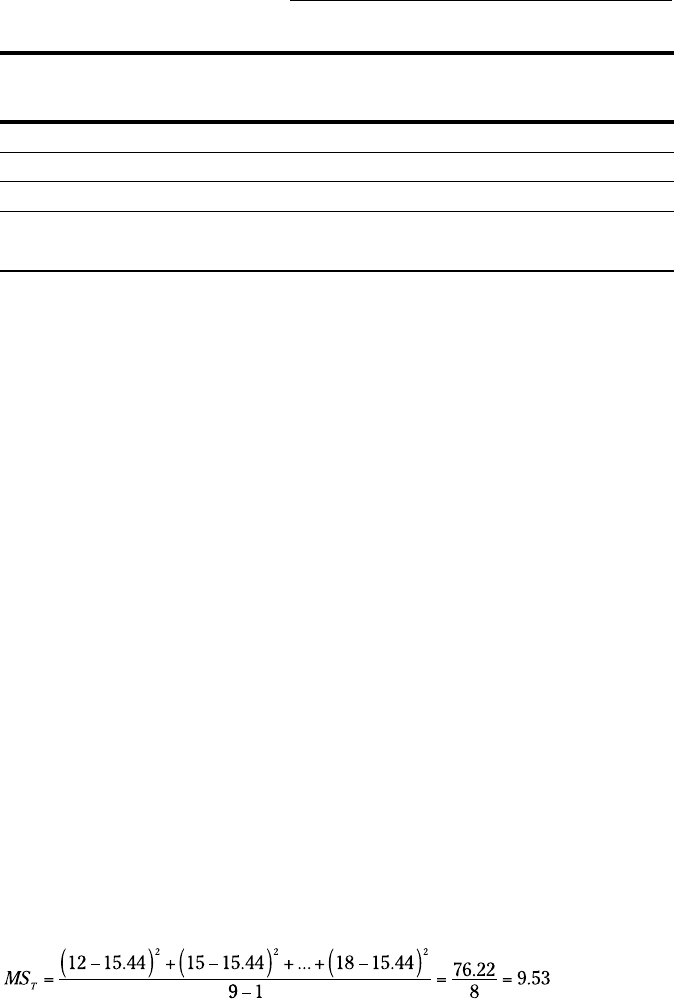
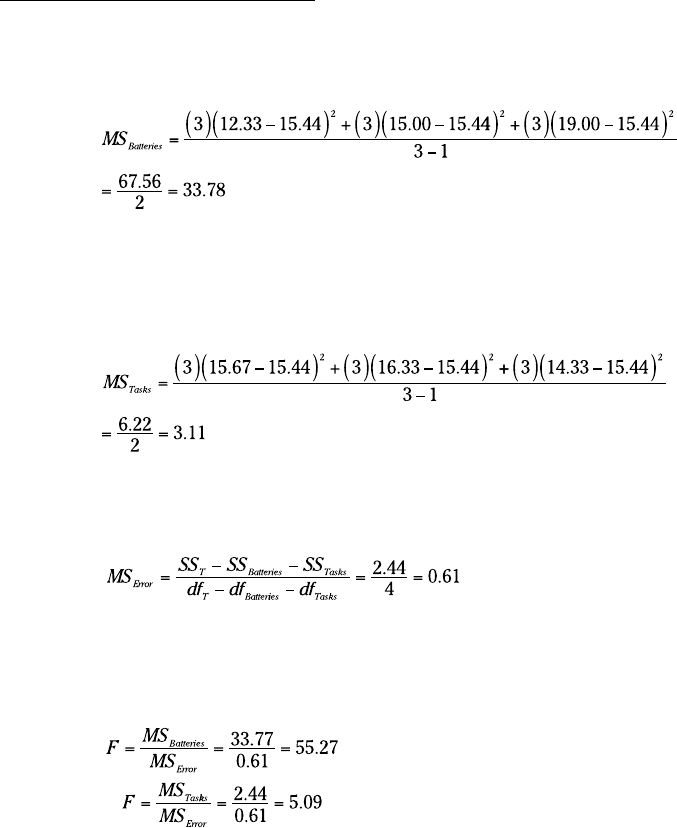
To understand this ANOVA, consider the variances inside the data. First,
focus on the variance in the whole set of nine numbers — MS
T
. (“T” in the
subscript stands for “Total.”) The mean of those numbers is 15.44. Because
it’s the mean of all the numbers, it goes by the name grand mean.
This variance is
19 454060-ch13.indd 24419 454060-ch13.indd 244 4/21/09 7:33:07 PM4/21/09 7:33:07 PM
245
Chapter 13: Slightly More Complicated Testing
The means of the three batteries (the column means) also vary from 15.44.
That variance is
Why does the 3 appear as a multiplier of each squared deviation? When you
deal with means, you have to take into account the number of scores that
produced each mean.
Similarly, the means of the tasks (the row means) vary from 15.44:
One variance is left. It’s called MS
Error
. This is what remains when you sub-
tract the SS
Batteries
and the SS
Tasks
from the SS
T
, and divide that by the df that
remains when you subtract df
Batteries
and df
Tasks
from df
T
:
To test the hypotheses, you calculate one F for the effects of the batteries and
another for the effects of the tasks. For both, the denominator (the so-called
“error term”) is MS
Error
:
Each F has 2 and 4 degrees of freedom. With α = .05, the critical F in each
case is 6.94. The decision is to reject H
0
for the batteries (they differ from one
another to an extent greater than chance), but not for the tasks.
To zero in on the differences for the batteries, you carry out planned com-
parisons among the column means. (See Chapter 12 for the details.)
19 454060-ch13.indd 24519 454060-ch13.indd 245 4/21/09 7:33:07 PM4/21/09 7:33:07 PM
246
Part III: Drawing Conclusions from Data
Data analysis tool: Anova: Two-Factor
Without Replication
Excel’s Anova: Two-Factor Without Replication tool carries out the analysis
I just outlined. (I used this tool for another type of analysis in Chapter 12.)
Without Replication means that only one robot is assigned to each battery-
task combination. If you assign more than one to each combination, that’s
replication.
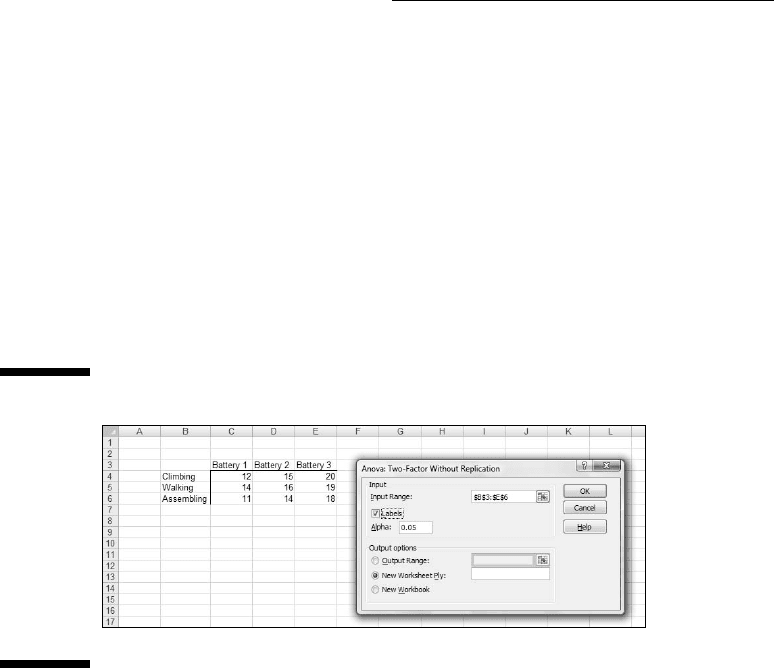
Figure 13-1 shows this tool’s dialog box along with the data for the batteries-
tasks example.
Figure 13-1:
The Anova:
Two Factor
Without
Replication
data
analysis
tool dialog
box along
with the
batteries-
tasks data.
The steps for using this tool are:
1. Enter the data into the worksheet, and include labels for the rows and
columns.
For this example, the labels for the tasks are in cells B4, B5, and B6. The
labels for the batteries are in cells C3, D3, and E3. The data are in cells
C4 through E6.
2. Select Data | Data Analysis to open the Data Analysis dialog box.
3. In the Data Analysis dialog box, scroll down the Analysis Tools list
and select Anova: Two Factor Without Replication. Click OK to open
the select Anova: Two Factor Without Replication dialog box.
This is the dialog box in Figure 13-1.
4. In the Input Range box, enter the cell range that holds all the data.
For the example, the data range is $B$3:$E$6. Note the $-signs for abso-
lute referencing. Note also — and this is important — the row labels are
19 454060-ch13.indd 24619 454060-ch13.indd 246 4/21/09 7:33:07 PM4/21/09 7:33:07 PM
247
Chapter 13: Slightly More Complicated Testing
part of the data range. The column labels are, too. The first cell in the
data range, B2, is blank, but that’s OK.
5. If the cell ranges include column headings, select the Labels option.
I included the headings in the ranges, so I checked the box.
6. The Alpha box has 0.05 as a default. Change that value if you want a
different α.
7. In the Output Options, select a radio button to indicate where you
want the results.
I selected New Worksheet Ply to put the results on a new page in the
worksheet.
8. Click OK.
Because I selected New Worksheet Ply, a newly created page opens with
the results.
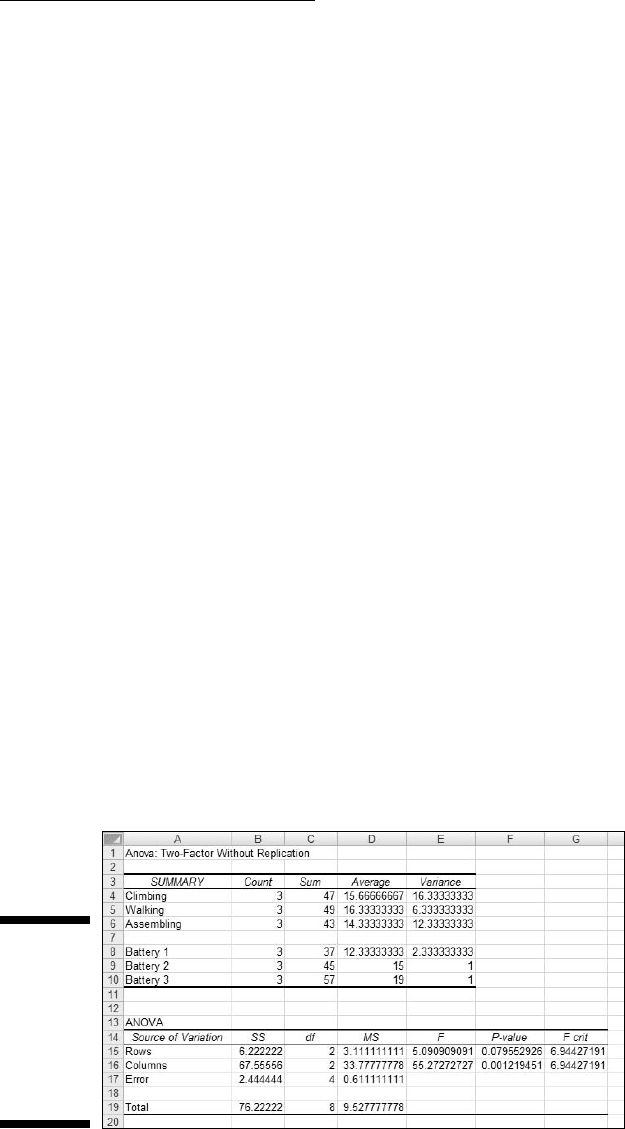
Figure 13-2 shows the tool’s output, after I expanded the columns. The output
features two tables, SUMMARY and ANOVA.
The SUMMARY table is in two parts. The first part provides summary statistics
for the rows. The second part provides summary statistics for the columns.
Summary statistics include the number of scores in each row and in each
column along with the sums, means, and variances.
The ANOVA table presents the Sums of Squares, df, Mean Squares, F, P-values,
and critical F for the indicated df. The table features two values for F. One F is
for the rows, the other for the columns. The P-value is the proportion of area
that the F cuts off in the upper tail of the F-distribution. If this value is less than
.05, reject H
0
.
In this example, the decisions are to reject H
0
for the batteries (the columns)
and to not reject H
0
for the tasks (the rows).
Figure 13-2:
Output from
the Anova:
Two Factor
Without
Replication
data analy-
sis tool.
19 454060-ch13.indd 24719 454060-ch13.indd 247 4/21/09 7:33:07 PM4/21/09 7:33:07 PM
248
Part III: Drawing Conclusions from Data
Cracking the Combinations Again
The analysis I just showed you involves one score for each combination of
the two factors. Assigning one individual to each combination is appropriate
for robots and other manufactured objects, where you can assume that one
object is pretty much the same as another.
When people are involved, it’s a different story. Individual variation among
humans is something you can’t overlook. For this reason, it’s necessary to
assign a sample of people to a combination of factors — not just one person.
Rows and columns
I illustrate with an example. Imagine that a company has two methods of
presenting its training information. One is via a person who presents the
information orally, the other is via a text. Imagine also that the information is
presented in either a humorous way or in a technical way. I refer to the first
factor as Presentation Method and to the second as Presentation Style.
Combining the two levels of Presentation Method with the two levels of
Presentation Style gives four combinations. The company randomly assigns
4 people to each combination, for a total of 16 people. After providing the
training, they test the 16 people on their comprehension of the material.
Figure 13-3 shows the combinations, the four comprehension scores within
each combination, and summary statistics for the combinations, rows, and
columns.
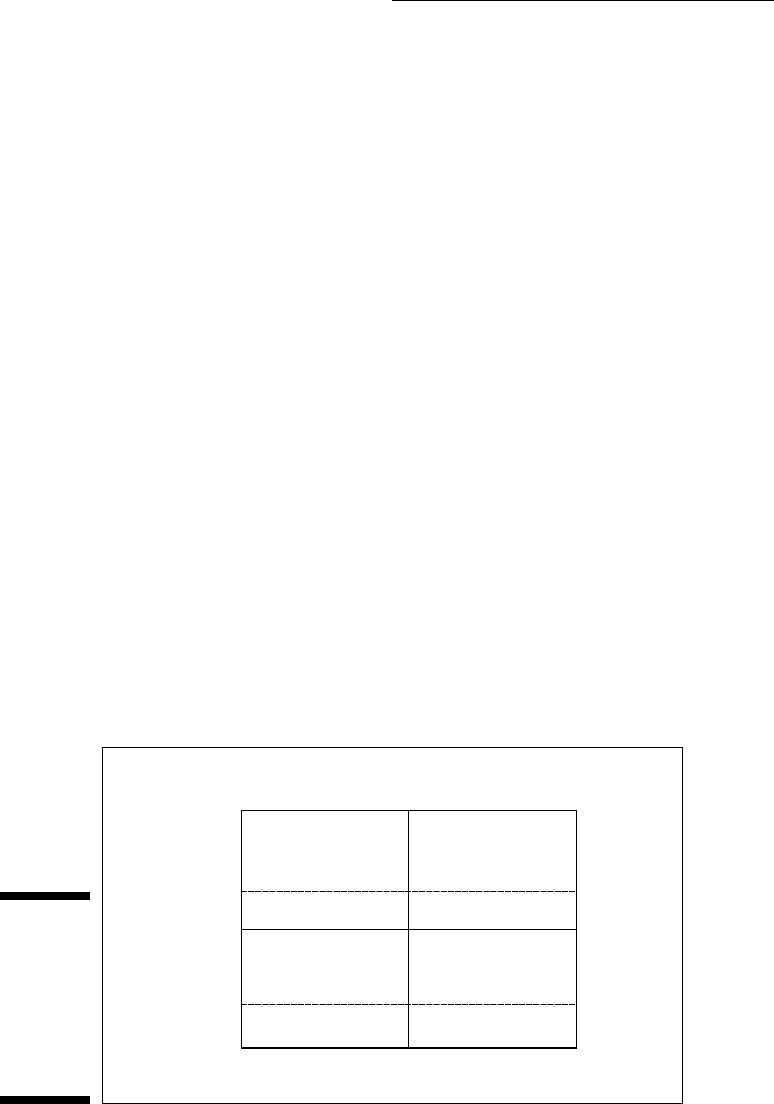
Figure 13-3:
Combining
the levels of
Presentation
Method with
the levels of
Presentation
Style.
Presentation Style
Humorous
Presentation
Method
Spoken
Mean = 57.25
Variance = 12.92
Mean = 24.25
Variance = 12.92
Mean = 29.25
Variance = 12.25
Mean = 68.50
Variance = 12.33
Mean = 40.75
Mean = 48.88
Mean = 46.38 Grand Mean =
44.81
Mean = 43.25
Spoken
and
Humorous
54
55
62
68
Spoken
and
Technical
22
21
29
25
Text
and
Humorous
33
25
28
31
Text
and
Technical
66
65
71
72
Text
Technical
19 454060-ch13.indd 24819 454060-ch13.indd 248 4/21/09 7:33:08 PM4/21/09 7:33:08 PM