Schneider P., Eberly D.H. Geometric Tools for Computer Graphics
Подождите немного. Документ загружается.

894 Appendix A Numerical Methods
var = Variation(t0, X0, t1, X1);
if (var > minvariation) {
tm=(t0+t1)/2;
xmid = X(tm);
Subdivide(level - 1, t0, X0, tm, Xm, sub);
Subdivide(level - 1, tm, Xm, t1, X1, sub);
return;
}
}
sub.Append(X1);
}
Initial call:
List sub = { X(tmin) };
Subdivide(maxlevel, tmin, X(tmin), tmax, X(tmax), sub);
The maxlevel parameter avoids deep recursive calls when a small minvariation is
specified. However, if
level reaches zero, the variation for the current interval is not
necessarily within the specified tolerance. Since the variation does not provide error
bounds for the distance calculation, this is not a problem.
A.9 Topics from Calculus
This section reviews several topics from calculus that can be useful in solving a
number of problems discussed in this book, particularly distance and intersection.
A.9.1 Level Sets
Political maps show boundaries of states and countries, and some amount of geo-
graphical features (rivers, oceans, etc.), but these are often shown indicatively. Topo-
graphic maps, on the other hand, are useful because they explicitly show the elevation
of the land. This is done by the use of contours—curves representing the cross section
of the land at a particular altitude. By observing the altitude markings associated with
particular contours, as well as their topology, the map user can easily distinguish in-
clines, peaks, and valleys. Further, the steepness of a slope can easily be discerned,
by the relative distance between adjacent contours—the closer together they are, the
steeper the slope.
A contour map can be considered to be a way of visualizing a function of two
variables f(x, y) =z,wherex and y are the latitude and longitude and z is the height
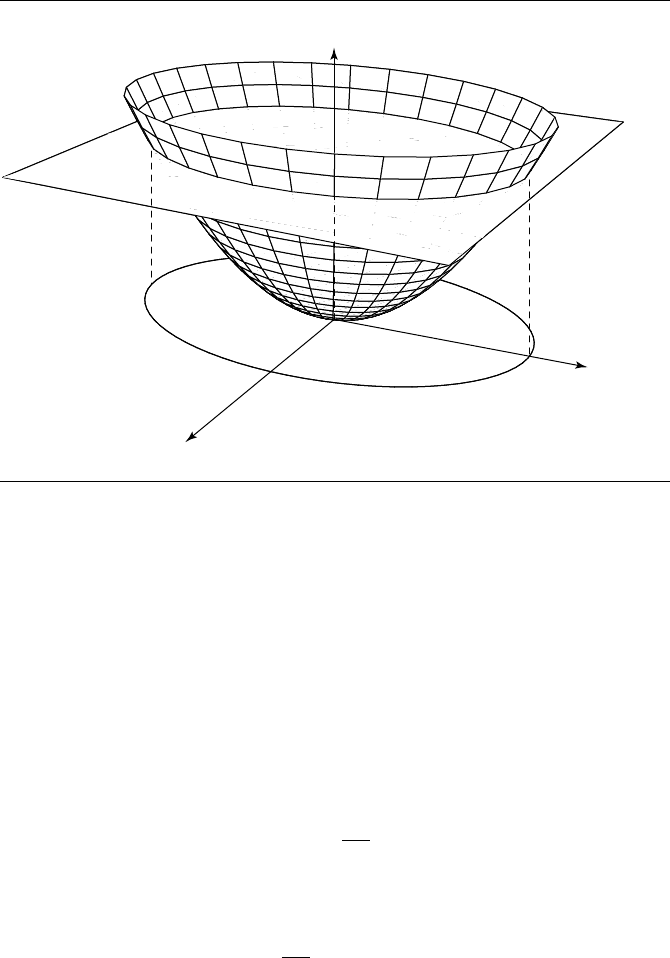
(altitude). If we intersect the function f with a horizontal plane
A.9 Topics from Calculus 895
x
y
z
Figure A.2 Intersection of a function f(x, y) = z and plane z = 0.8 yields a level curve, shown
projected on the xy-plane.
z = h
and project the resulting curve onto the xy-plane, then we get what is referred to as
a level curve (see Figure A.2). This level curve has the equation
f(x, y) = a
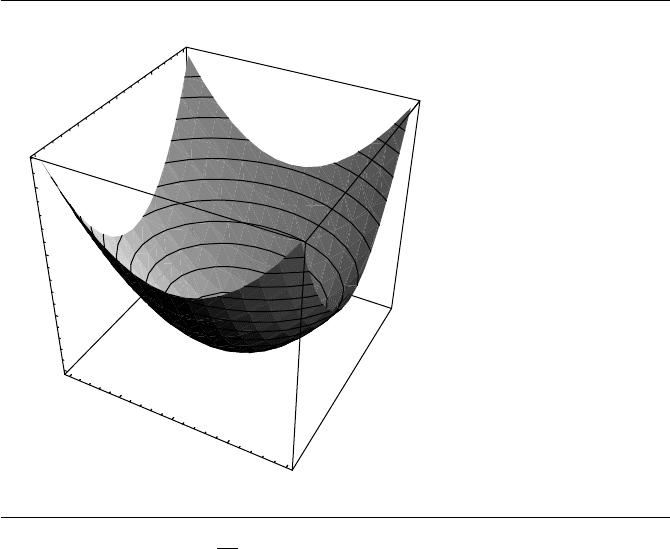
If we have the paraboloid
f(x, y) =
2x
2
3
+ y
2
(see Figure A.3), then the level curves have equations of the form
2x
2
3
+ y
2
= h
For h>0, these are ellipses; for h =0, it is a point; and for h<0, there are no curves.
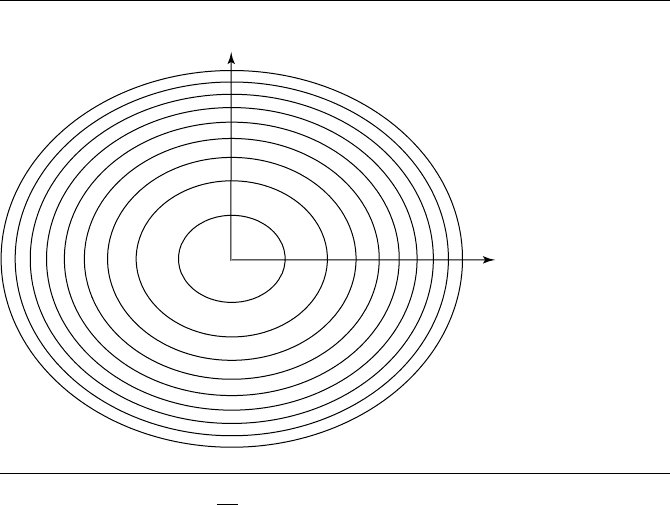
A number of the projected level curves are shown in Figure A.4.
896 Appendix A Numerical Methods
–1
–0.5
0
0.5
1
–1
–0.5
0
0.5
1
0
0.5
1
1.5
Figure A.3 Level curves for f(x, y) =
2x
2
3
+ y
2
.
Level curves of a function f(x, y) and the gradient of the function ∇f(x, y) have
an important geometric relationship. Suppose we have any point (in f ’s domain, of
course) x
0
, y
0
and that f(x
0
, y
0
) = c for some constant c. We know that f(x, y) = c
defines some level curve for f , and that f(x
0
, y
0
) is a point on that curve. The
maximum rate of increase for f at (x
0
, y
0
) is in the direction of ∇f(x
0
, y
0
) and
the minimum in the direction of −∇f(x
0
, y
0
). Intuitively, it seems, then, that the
gradient must be perpendicular to the level curve at f(x
0
, y
0
), and this indeed turns
out to be the case. An outline of the proof follows (Anton 1980).
Assume we have a level curve
f(x, y) = c (A.9)
through (x
0
, y
0
). We can represent this curve parametrically, as
x =x(t)
y =y(t)
which has a nonzero tangent vector at (x
0
, y
0
)
A.9 Topics from Calculus 897
x
y
Figure A.4 Level curves for f(x, y) =
2x
2
3
+ y
2
, projected onto the xy-plane.
x
(t
0
)i + y
(t
0)
j = 0
where t
0
is the value of the parameter at the point (x
0
, y
0
).
If we differentiate Equation A.9 with respect to t and apply the chain rule, we get
f
x
(x(t), y(t))x
(t) + f
y
(x(t), y(t))y
(t) = 0
Using the facts that x(t
0
) = x
0
and y(t
0
) = y
0
, and substituting t = t
0
,weget
f
x
(x
0
, y
0
)x
(t
0
) + f
y
(x
0
, y
0
)y
(t
0
) = 0
which can be rewritten as
∇f(x
0
, y
0
) · (x
(t
0
)i + y
(t
0
)j) = 0
That is, ∇f(x
0
, y
0
) is perpendicular to the tangent vector of the level curve at (x
0
, y
0
).
898 Appendix A Numerical Methods
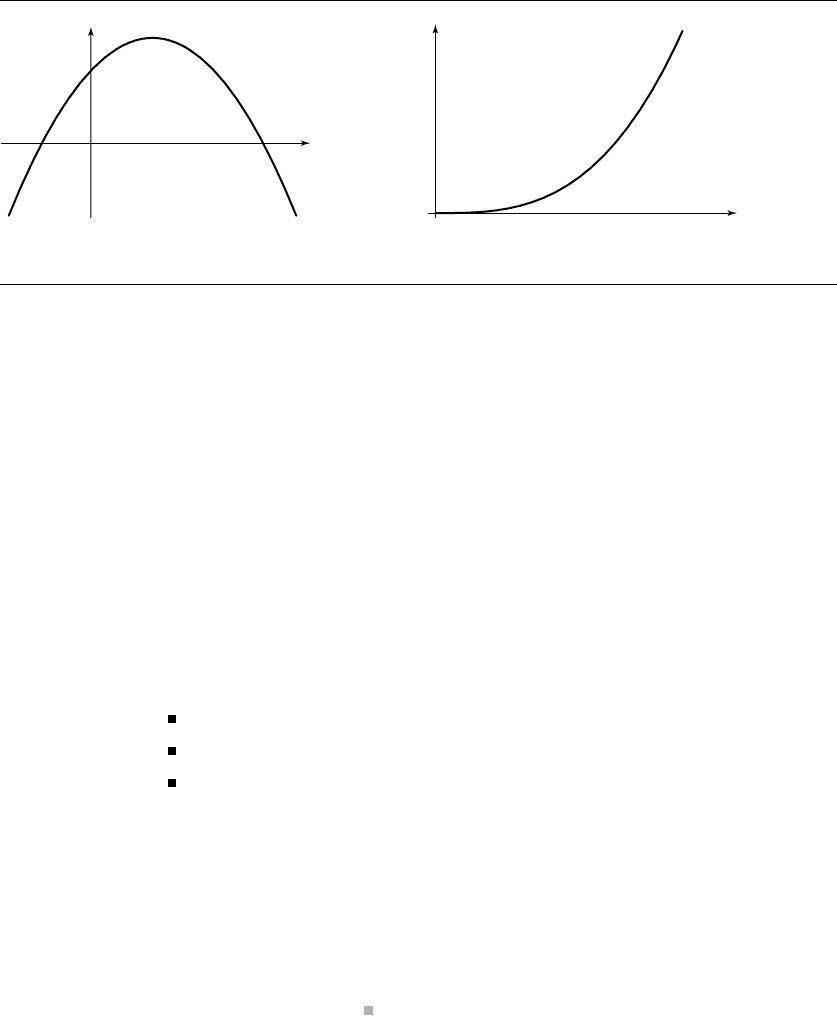
No minimum No maximum
Figure A.5 Two functions lacking either a minimum or maximum value.
A.9.2 Minima and Maxima of Functions
This section addresses the problem of finding the minimum and maximum values of
a function, in both one and two variables. Such problems arise often in the context
of optimization problems—informally, situations in which we want to find the “best”
(or perhaps “worst”) solution.
Functions of One Variable
Given a function f , we might wish to know various facts about minimum or maxi-
mum values (the extrema), such as
Does f(x)have a minimum (maximum) value?
If f(x)has a minimum (maximum), what is it, and where does it occur?
Does f(x)have a minimum (maximum) within an interval [a, b]or [a, b)?
Figure A.5 shows two functions, one of which has no minimum value over its domain,
and the other no maximum value.
We begin with some relevant definitions
Definition
A.1
A number M is called an absolute maximum value for a function f with domain D if
i. f(x)≤ M, ∀x ∈D.
ii. ∃x ∈ D|f(x)= M.
A.9 Topics from Calculus 899
0.5 1 2 2.5 3
–60
–40
–20
20
40
60
–1 1 2 3 4
f(x) = 3x + 2, 1 ≤ x < 3
Not closed on the right
f(x) = tan x, 0 ≤ x < 3
Not continuous
2
4
6
8
10
12
14
1.5
Figure A.6 Two functions that violate the assumptions of the Extreme Value Theorem.
Definition
A.2
A number M is called an absolute minimum value for a function f with domain D if
i. f(x)≥ M, ∀x ∈D.
ii. ∃x ∈ D|f(x)= M.
Often, we are interested in extrema in some restricted portion of the domain of f .
Theorem A.1 Extreme Value Theorem—One-Variable Form: Let f(x)be continuous on the closed
interval [a, b]; then, there are numbers x
0
, x
1
∈ [a, b] such that f(x)≤ f(x
0
) and
f(x)≥ f(x
1
), ∀x ∈ [a, b].
Note that the two conditions—that f be continuous and that the interval be
closed—are both essential for guaranteeing the existence of relative extrema. Two
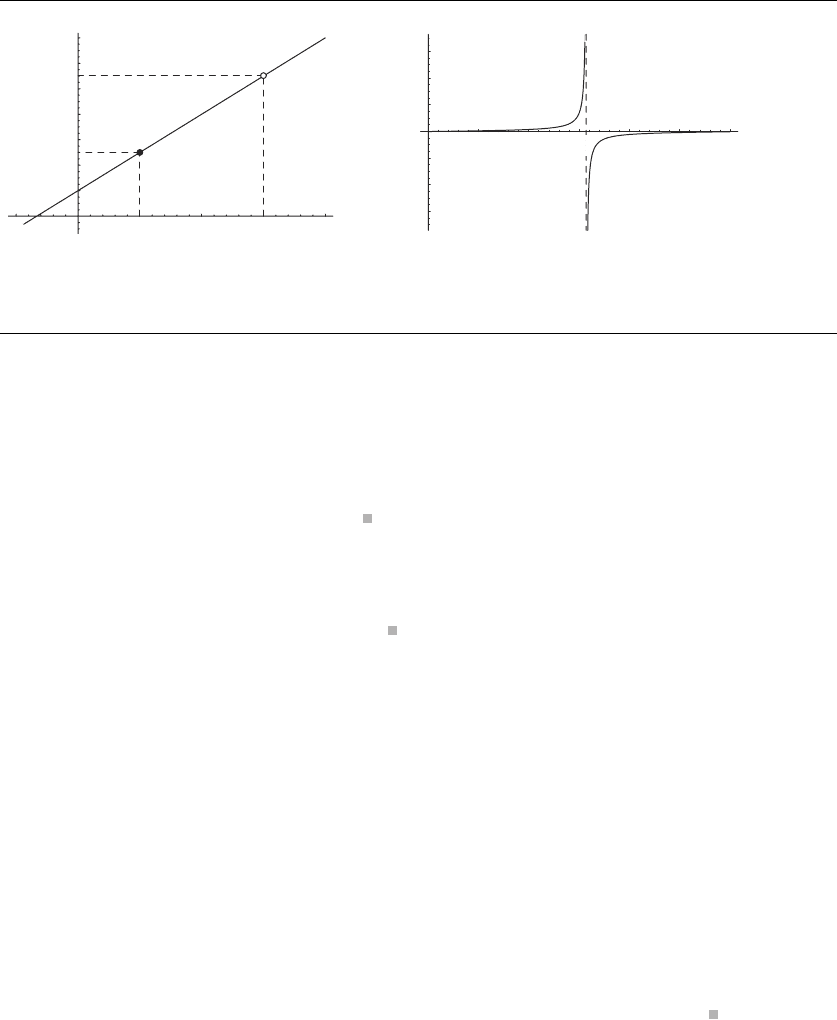
examples, each of which violates one of the conditions, respectively, are tan(x), ∀x ∈
[0, 3], and f(x)= 3x +2, ∀x ∈[2, 6). The tangent function fails to be continuous at
the value 1.5, and the line function fails because it is not closed on the right (there is
no “largest value less than 11”); graphs of these functions are shown in Figure A.6.
The Extreme Value Theorem merely defines the conditions under which extrema
exist—it does nothing directly to help find them. For this, we must turn to the concept
of critical points.
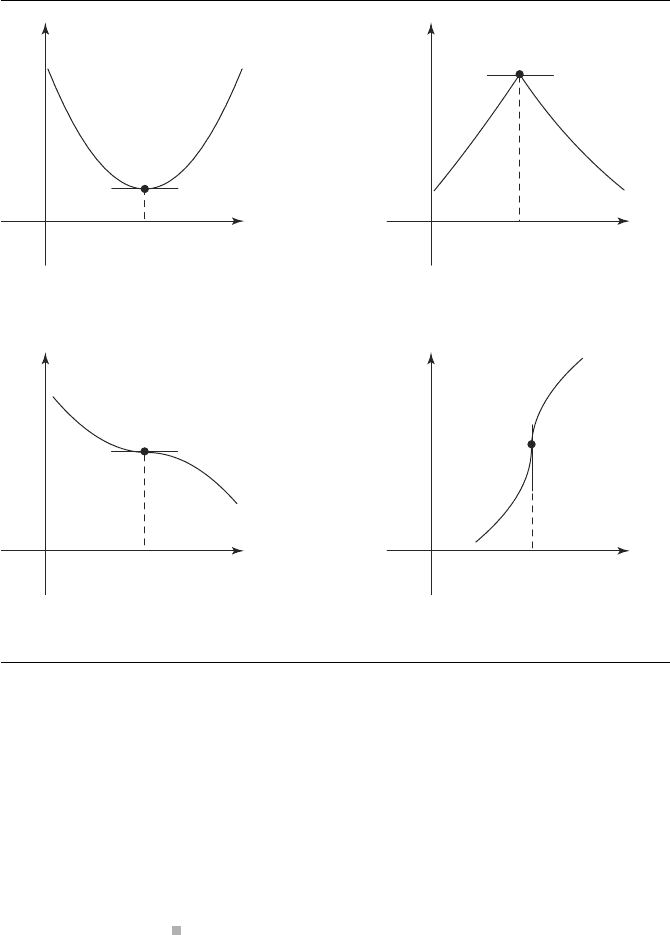
Definition
A.3
For function f ,acritical point is any point x ∈D such that either
i. the first derivative is 0 − f
(x) = 0or
ii. the first derivative does not exist
The critical points where f
(x) = 0 are known as stationary points.
900 Appendix A Numerical Methods
x
0
x
0
x
0
x
0
(a) (b)
(c)
(d)
Figure A.7 A variety of functions, showing critical points—(a) and (b) are stationary points;
(c) and (d) are inflection points.
Figure A.7 shows a variety of critical points. Those in Figure A.7(a), A.7(b),
and A.7(c) are stationary points; the critical points in Figure A.7(c) and A.7(d) are
also called inflection points. Critical points are significant because they are key to
determining the extrema, as the following theorem states.
Theorem A.2 If a function f has an extremum on an interval (a, b), then the extremum occurs at
a critical point of f .
A proof of this theorem can be found in Anton (1980). This theorem can be
usedtolocateanextremumoff on closed intervals as well: the extremum occurs
either within the interval or at one of the boundaries. Figure A.8 shows intervals of
functions at which the maximum occurs at the right end, within the interval at a
A.9 Topics from Calculus 901
x
0
= b x
0
x
0
aa abb
Figure A.8 The maximum of a function may occur at the boundary of an interval or within the
interval.
point at which f is not differentiable, and within the interval at a point at which f
is differentiable. Thus, an effective procedure to find the extrema of a (continuous)
function f on a closed interval [a, b]is
1. Find the critical points in the open interval (a, b).
2. Evaluate f at the interval boundaries a and b.
3. Compare the values of the critical points and the interval boundaries. The small-
est among them is the minimum, and the largest is the maximum.
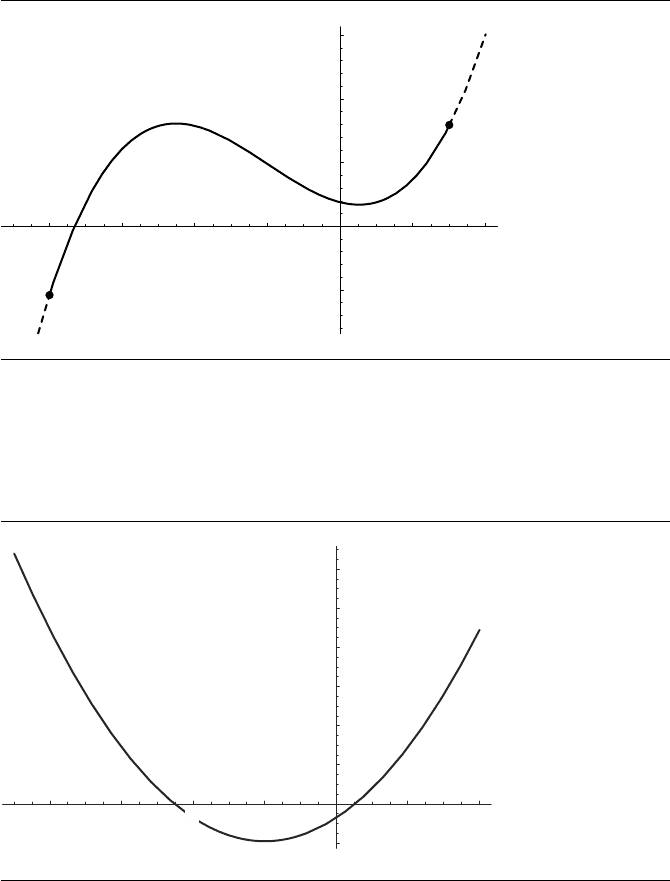
An example should demonstrate this. Consider the equation
f(x)= x
3
+ 6x
2
− 7x + 19 (A.10)
We wish to find the extrema on the interval [−8, 3] (see Figure A.9). First, we must
verify that the function is continuous in order for the Extreme Value Theorem to
apply, but this function is a polynomial and so we know it is continuous. Our theorem
tells us that if there is an extremum in the open interval, it must occur at a critical
point, and as critical points (in this case) must occur where the derivative is zero, we
must solve f
(x) to find these points.
The derivative of f is
f
(x) = 3x
2
+ 12x −7 (A.11)
whose roots are {{x →
−6−
√
57
3
}, {x →
−6+
√
57
3
}}≈{−4.51661, 0.516611} (see Fig-
ure A.10). The values of f at the end points are f(−8) =−53, f(3) = 79. The mini-
mum therefore occurs at the left boundary f(−8) =−53, and the maximum occurs
at the critical point f(
−6−
√
57
3
) ≈ f(−4.51661) ≈ 80.8771.
902 Appendix A Numerical Methods
–8 –6 –4 –2 2 4
–50
50
100
150
Figure A.9 f(x)= x
3
+ 6x
2
− 7x + 19, ∀x ∈[−8, 3].
–8 –6 –2 2 4
–20
20
40
60
80
100
120
–4
Figure A.10 f
(x) = 3x
2
+ 12x −7, ∀x ∈[−8, 3].
A.9 Topics from Calculus 903
Relative maxima
Relative minima
Figure A.11 Relative extrema.
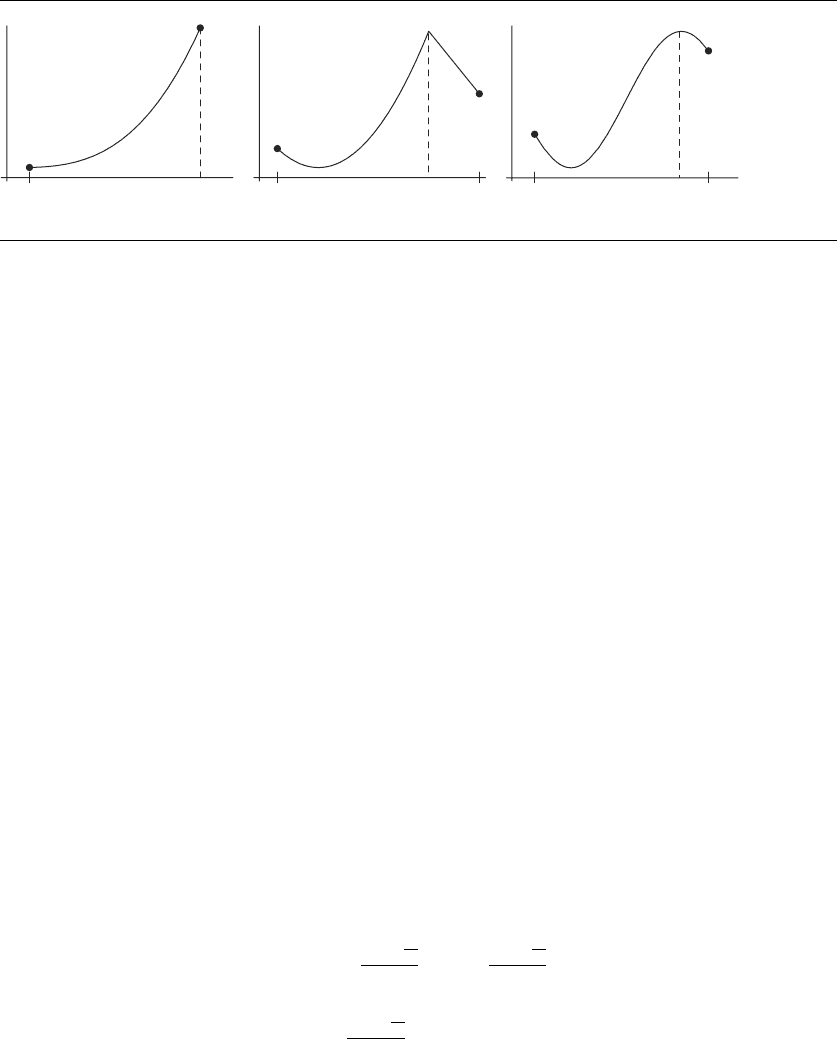
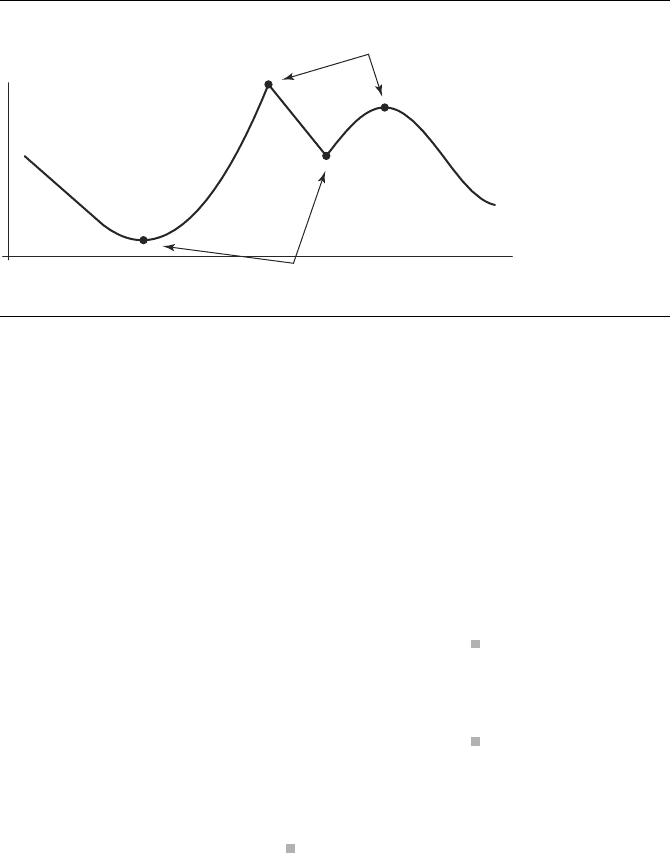
Relative Extrema
The Extreme Value Theorem applies only when the interval is closed and when the
function is continuous. So, there are cases in which it cannot be applied. The graphs
of many functions contain intervals that contain what we may informally refer to
as “hills” and “valleys”—these are called relative extrema; an example is shown in
Figure A.11. These characteristics are defined formally as follows
Definition
A.4
A function f has a relative maximum at x
0
if
∃(a, b)|f(x
0
) ≥ f(x), ∀x ∈(a, b)
Definition
A.5
A function f has a relative minimum at x
0
if
∃(a, b)|f(x
0
) ≤ f(x), ∀x ∈(a, b)
Three theorems allow us to identify relative extrema.
Theorem A.3 Relative Extreme Value Theorem: If a function f hasarelativeextremumatapoint
x
0
, then x
0
is a critical point for f .
Note that this does not work the other way—a critical point may or may not be
an extremum at all; Figure A.7(c) has a critical point that is not a relative extremum.
Theorem A.4 First Derivative Test: If a function f is continuous at a critical point x
0
, then
i. If f
(x) > 0 within an (open) interval extending left from x
0
and f
(x) < 0 within
that interval, extending right from x
0
, then f(x
0
) is a relative maximum.