Seybold J.S. Introduction to RF Propagation
Подождите немного. Документ загружается.

6.2 ATMOSPHERIC REFRACTION
Refractive and scattering effects of the atmosphere include:
•
Refraction on horizontal paths resulting in alteration of the radio horizon
due to ray curvature.
•
Troposcatter, from localized fluctuations in the atmospheric refractive
index, which can scatter electromagnetic waves.
•
Temperature inversion, abrupt changes in the refractive index with height
causing reflection.
•
Ducting, where the refractive index is such that electromagnetic waves
tend to follow the curvature of the earth.
These effects vary widely with altitude, geographic location, and weather con-
ditions. The effects can permit beyond-the-horizon communication (or inter-
ference), or produce blockage and diffraction from terrain that appears to be
below the line of sight and multipath fading. These effects are discussed in the
sections that follow.
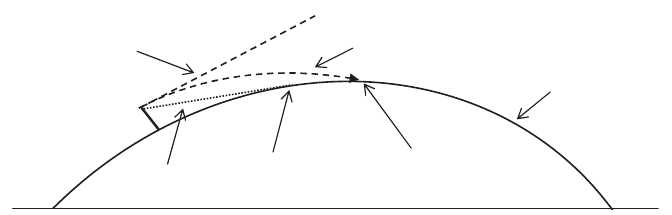
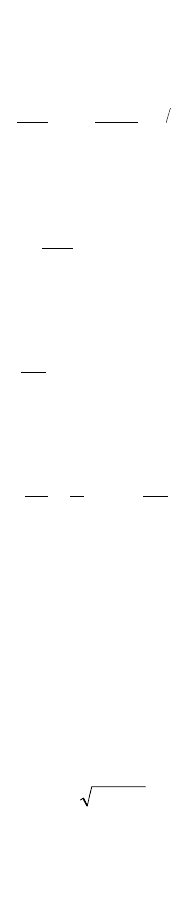
6.2.1 The Radio Horizon
Gradual changes in the refractive index with height cause EM waves to bend
in the atmosphere. If the atmosphere were homogeneous, the waves (rays)
would travel in a straight line and the physical and RF horizons would coin-
cide. The rate of change of the refractive index with height can be approxi-
mated as being constant in the first kilometer above sea level [1].This increases
the apparent distance to the horizon, by bending the nearly horizontal rays
downward. This is illustrated in Figure 6.1, where a horizontal ray is bent
downward and sees a radio horizon that is beyond the straight line-of-sight
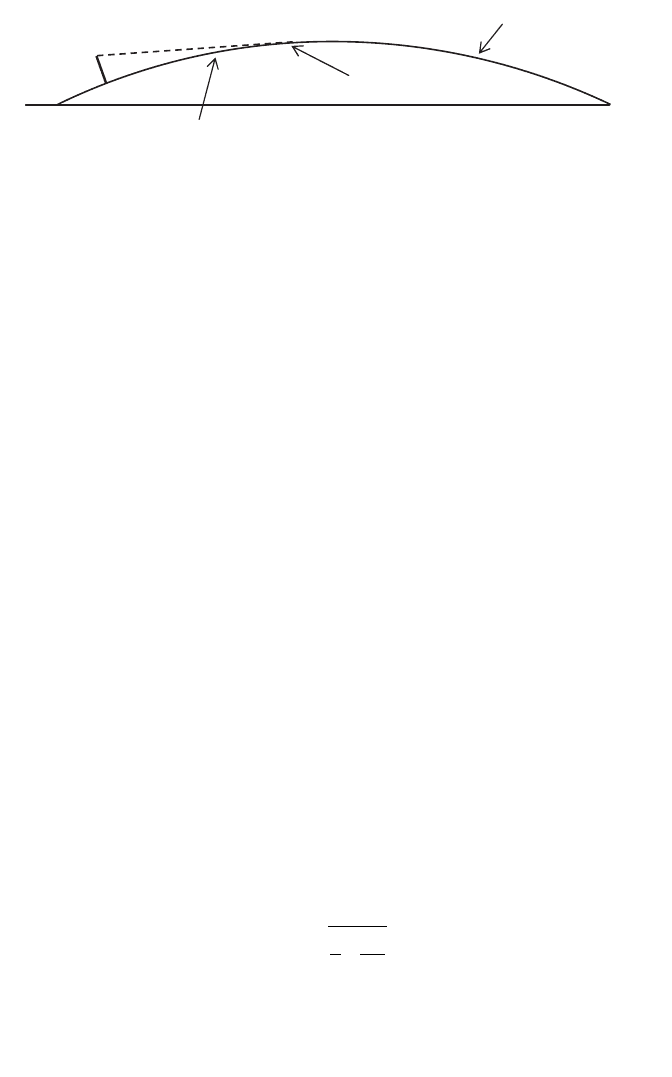
horizon (h is the antenna height). By replacing the model of the earth’s surface
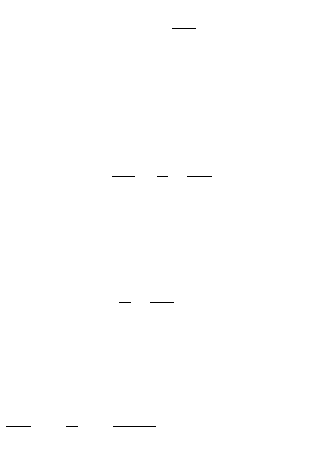
with one that has a radius of 4/3 of the earth’s radius (for a standard reference
atmosphere), the curved ray becomes straight. This is shown in Figure 6.2
where the horizon appears at the point where a straight ray emanating from
112 ATMOSPHERIC EFFECTS
LOS to
Horizon
Local
Horizontal
Refracted Local
Horizontal Ra
y
h
LOS
Horizon
Radio
Horizon
Actual
Earth’s
surface
Figure 6.1 Effect of atmospheric refraction on the distance to the horizon.
the source intersects the 4/3 R
e
spherical surface. The 4/3 earth radius approxi-
mation is derived based on a standard atmosphere at sea level and is there-
fore not universally applicable. Nonetheless, it is very widely used and often
treated as if it were universal.
It is interesting to note that the ray that reaches the radio horizon is not
the same ray that is directed at the LOS horizon, it leaves the source at a
slightly greater elevation angle. In the case of very narrow beamwidth anten-
nas, it is possible that the departure angle of the radio horizon ray is outside
of the beamwidth of the antenna. If this occurs, then the effect of the refrac-
tion can be a reduction in communication distance rather than an increase
since the ray leaving the source at the center of the antenna beamwidth will
be bent toward the ground and the peak of the transmitted signal will not be
directed at the intended receiver.
The energy that reaches the receiver will be a combination of off-axis radia-
tion from the antenna and any diffraction from intervening terrain that blocks
the bore-sight radiation. For this reason, it is important to verify antenna
aiming at different times over a period of days [2, p. 20]. If aiming is only done
once and happens to be done during a period of significant refraction, then
under nominal conditions the link margin will be below the design level, reduc-
ing the link margin and availability.
6.2.2 Equivalent Earth Radius
The radius of the earth and the rate of change of the refractive index can be
used to determine the equivalent radius of the earth based on local conditions
[3]:
(6.1)
The refractive index can be expressed as
(6.2)
nN=+ ¥
()
-
110
6
r
r
dn
dh
eq
=
+
1
1
ATMOSPHERIC REFRACTION 113
h
LOS
Horizon
Radio
Horizon
Surface of imaginary
sphere with 4/3 earth
radius
Figure 6.2 Equivalent radio horizon with 4/3 earth radius model.
where N is called the refractivity:
(6.3)
From ITU-R P.453-8 [1], N can be modeled as
(6.4)
where
P is the total pressure
e is the water vapor pressure
T is the absolute temperature
Using the typical values for a standard atmosphere [4] yields N = 312. The
typical values are
P = 1000 mb
e = 10 mb
T = 290 K
Thus the refractivity of a standard atmosphere is
The refractive index is approximately unity at sea level and drops off nearly
exponentially with height. The refractivity as a function of height can be
modeled as [1, 5]
(6.5)
where H = 7 km. From (6.2), it can be seen that
(6.6)
and from (6.5),
(6.7)
For altitudes below 1km, dN/dh is well-approximated by its value at 1km:
(6.8)
dN
dh
e1
312
7
38 6
17
km N units km
()
=
-
=-
-
.
dN
dh
N
H
e
S
hH
=
-
-
dn
dh
dN
dh
=¥
-
10
6
N units km
NNe
S
hH
=
-
N
S
= 312
N
T
P
e
T
=+
Ê
Ë
ˆ
¯
77 6 4810.
N units
Nn=-
()
¥110
6
114 ATMOSPHERIC EFFECTS
Therefore when h < 1 km, the expression for the refractivity gradient is
(6.9)
Using the preceding expression, one can determine the required adjustment
to make the local horizontal ray straight:
(6.10)
Thus
(6.11)
where r is the earth’s radius (6370km) and
So
as expected for the standard atmosphere conditions that were used.
Example 6.1. Find the distance to the radio horizon from a 50-m tower
installed at 2 km above sea level, given the following atmospheric conditions
at sea level:
P = 1100 mb
e = 12 mb
T = 260 K
The expression for the refractivity is obtained by applying (6.4) with the pre-
coding parameter values,
yields
N
T
P
e
T
=+
Ê
Ë
ˆ
¯
77 6 4810.
N units
k =
-¥¥
==
-
1
1 6370 39 10
1
075
4
3
6
.
dn
dh
=- =- ¥
--
39 39 10
61
N units km km
r
rk
r
dn
dh
eq
==+
1
1
11
rr
dn
dh
eq
=+
dN
dh
ª-39 N units km
ATMOSPHERIC REFRACTION 115
Using the expression for the refractivity gradient and the 2-km height yields
Thus
and
The value of k can be found from
Using
for the actual earth’s radius yields
The distance to the horizon is then given by
The distance to the horizon is
䊐
6.2.3 Ducting
Ducting occurs when the curvature of the refraction is identical (or nearly
identical) to the curvature of the earth. Another way to look at it is that under
ducting conditions, the equivalent earth radius is infinite. There are two
primary types of ducts: surface ducts, where the wave is trapped between the
d = 29 5.km
d krh
T
@ 2
k = 1 370.
r = 6370 km
r
rk
r
dn
dh
eq
==+
1
1
dn
dh
=-0 00004236.
dN
dh
=-42 36.
dN
dh
h
N
e
S
h
()
=
-
-
7
7
N
S
= 394 57. N units
116 ATMOSPHERIC EFFECTS
earth’s surface and an inversion layer, and elevated ducts, where the layers of
the atmopshere trap the wave from both above and below. Elevated ducts may
occur up to about 1500 m above the surface. In either case, both ends of the
communication link must be located within the same duct for a signal enhance-
ment to be observed. The case of surface ducting is more common and usually
of much greater practical concern. According to Parsons [6], ducting tends to
be primarily an effect due to water vapor content, but it can also be caused
by a mass of warm air moving in over cooler ground or the sea or by night
frost.
The radius of curvature of an electromagnetic wave can be written as
If r is equal to the radius of the earth, then the electromagnetic wave will
follow the curvature of the earth:
This case corresponds to r
eq
=•,or
Therefore, an EM wave will follow the curvature of the earth when
This creates a surface duct condition where RF can propagate well beyond
the physical horizon. The path loss can be considerably less than free space,
analogous to a waveguide. A duct may only be 1–2 m high, resulting in a sig-
nificant concentration of the wave. This can be a limitation for frequency reuse
(interference), but it also serves to increase the range of terrestrial line-of-
sight communications.
6.2.4 Atmospheric Multipath
Signal enhancement is not the only effect of refraction or ducting. When suf-
ficient refraction occurs, it can appear like a reflection, similar to ionospheric
propagation. If this occurs while there is still a direct line-of-sight path, or if
several paths exist, the resulting atmospheric multipath can create signal
enhancement and/or signal attenuation. Fades due to atmospheric multipath
dn
dh r
=- =- =- ¥
--
11
6370
157 10
61
km
1
0
r
dn
dh
+=
11
rr
dn
dh
eq
=+
r=-
dh
dn
ATMOSPHERIC REFRACTION 117
are a significant consideration, particularly for point-to-point microwave links.
The effect occurs predominantly in higher-humidity areas during nighttime
hours, with coastal areas being particularly susceptible. Like refraction, atmos-
pheric multipath only affects paths that are very nearly horizontal. Atmos-
pheric multipath is primarily observed over very flat terrain; irregular terrain
makes formation of a uniform atmospheric layer unlikely.
The impact of this kind of multipath on terrestrial point-to-point microwave
links was studied by Bell Laboratories in the 1960s and 1970s. Barnett [7] pro-
duced a model to characterize the observed multipath effects, which has been
widely used in the United States. About the same time, Morita [8] developed
a model based on measurements made in Japan. Later, Olson and Segal [9]
performed a similar study in Canada and developed a model for the observed
effects in Canada. A recent article by Olsen et al. [10] compared several
models to measured data and concluded that the ITU model [11] slightly out-
performed the other models. Application of the latest ITU model [2] is pre-
sented here.
The ITU model for atmospheric multipath has two different formulations
for low probability of fade and another formulation for all fade probabilities.
For most applications the lower fade probability are suitable. In addition to
providing multipath fade depth predictions, the ITU also provides a model for
multipath signal enhancement. The enhancement model is not presented
herein, but it may be of interest in assessing the potential for interference in
frequency re-use applications.
The first step in applying the ITU model for small percentages is to deter-
mine the appropriate geoclimatic factor, K, for the average worst month for
the region of operation. Appendix 1 of Ref. 2 gives the procedure for deter-
mining the geoclimatic factor based on fade measurements. In the absence of
such measurements, the geoclimatic factor can be estimated using the ITU
refractivity gradient data for the lowest 65 m of the atmosphere given in Ref.
1. The ITU refractivity data are available for 1%, 10%, 50%, 90%, and 99%,
where the percentage is the percent of time that the value is not exceeded.
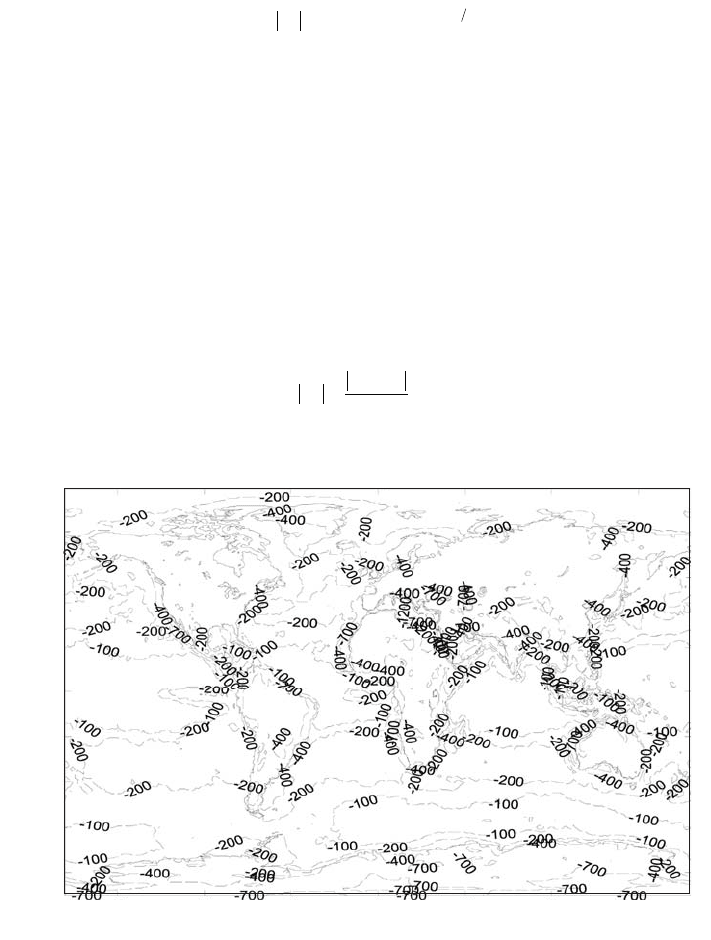
The 1% map, shown in Figure 6.1, is used for determining K. Note that the
data are concentrated in coastal areas as expected.
For reasonably accurate estimates of the probability of a multipath fade as
a function of fade depth, the following procedure is used. First, estimate the
geoclimatic factor from
(6.12)
where dN
1
is read from Figure 6.3. The second step is to determine the path
inclination in milliradians using
(6.13)
e
p
re
hh
d
=
-
mrad
K
dN
=
--
10
4 2 0 0029
1
..
118 ATMOSPHERIC EFFECTS
where h
e
and h
r
are the antenna heights above sea level in meters and d is the
distance between the antennas in kilometers. The probability (in percent) of
a fade of depth, A (dB), is then given by
(6.14)
where h
L
is the minimum of h
r
and h
e
, f is the frequency in GHz, and K is from
the prior equation.
For a somewhat more precise estimate, the characteristics of the local
terrain are taken into account. For this method, the value of K is again com-
puted using data from Figure 6.3, but a different equation is used:
(6.15)
where s
a
is the standard deviation of the terrain heights in meters within a
110- ¥ 110-km area with 30-s (arc-seconds, or ~1-km) resolution. The ITU [2,
p. 8] gives details on finding these data and how to apply it. The computation
of the path inclination is the same as before:
e
p
re
hh
d
=
-
Ks
dN
a
=
--
()
-
10
39 0003
042
1
..
.
pKd
p
fhA
L
=+
()
-
--
()
30
12
0 033 0 001 10
110
.
.
..
%e
ATMOSPHERIC REFRACTION 119
80
60
40
20
–20
–40
–60
–80
–150 –100 –50 0 50 100 150
0
Longitude (degrees)
Latitude (degrees)
Refractivity gradient not exceeded for 1% of the average year in the lowest 65 m
(This is the parameter referred to as dN
1
in Recommendation ITU-R P.530)
Figure 6.3 Refractivity gradient data for estimating the geoclimatic factor. (Figure 12
from Ref. 1, courtesy of the ITU.)
The third and final step is again slightly different from the first method. The
expression for the probability of exceeding a fade depth of A (dB) is
(6.16)
These models for atmospheric multipath fade probabilities are valid up to
45 GHz and down to
where d is the link distance in km.
Example 6.2. What is the probability of a 4-dB or greater fade on a 15-km,
horizontal link operating at 35 GHz on the U.S. gulf coast? Assume that the
antennas are mounted on 20-m towers.
First the value of K must be determined:
From Figure 6.3 the refractivity gradient (dN
1
) is -200, so
Since the path is horizontal, e
p
= 0 mrad. The expression for the probability of
a fade is
The probability of a 4-dB fade is then readily computed:
So if a 4-dB fade margin were used, the link would be expected to drop out
about 4.4% of the time. It is important to note that the multipath requires a
calm, clear atmosphere and will not occur during rain. Thus a single fade
margin for rain and/or multipath should be used. 䊐
The remedies for atmospheric multipath include maintaining sufficient
margins on the link or using antenna diversity to mitigate the fades. Using
margin can be very costly because 30 dB or more may be required. Antenna
diversity using two antennas is the preferred method for fixed links. For mobile
links, either margin or tolerating a certain amount of outage time is usually
used. It is worth noting that atmospheric multipath is not observed during
moderate to heavy precipitation, so the link designer need only consider the
larger of the two fade margins (rain or multipath), not both. Careful selection
P
4
44
dB
= .%
pKd
p
fhA
L
=+
()
-
--
()
30
12
0 033 0 001 10
110
.
.
..
%e
K =¥
-
239 9 10
6
.
K
dN
=
--
10
4 2 0 0029
1
..
fd
min
= 15 GHz
pKd
p
fhA
L
=+
()
-
--
()
32
097
0 32 0 00085 10
110
.
.
..
%e
120 ATMOSPHERIC EFFECTS

of the link path can also help mitigate multipath. Not straddling or parallel-
ing bodies of water, running shorter links, and increasing the inclination angle
all help to reduce the frequency and severity of multipath fades.
6.3 ATMOSPHERIC ATTENUATION
The atmosphere is comprised of gases, which absorb electromagnetic energy
at various frequencies. Atmospheric attenuation due to gaseous absorption
should not be confused with multipath or rain fades; it is a different mecha-
nism.The gases of primary concern for microwave and millimeterwave systems
are oxygen and water vapor. Similar to refraction, atmospheric losses also
depend upon pressure, temperature, and water vapor content [12, 13]. For this
reason, the effects can vary considerably with location, altitude, and the path
slant angle. The atmosphere can be thought of as being comprised of hori-
zontal layers at different altitudes, each having different water vapor and
oxygen densities. Therefore, terrestrial links and earth-to-space/air links expe-
rience different atmospheric effects and must be modeled differently [12].
Modeling the attenuation of RF signals by atmospheric gases is a well-
established process that is outlined in Refs. 1 and 12. The recommended ap-
proach is to use local atmospheric measurements along with the ITU models
to predict the expected amount of absorption. Rather than using measured
atmospheric data for a given location, the standard atmosphere parameters
given in Ref. 1 are used throughout this chapter and indeed in most practical
applications. For the frequencies in the range of 2–40 GHz, oxygen and water
vapor are the dominant attenuation factors in the atmosphere.
For terrestrial links where both terminals are at or near the same altitude,
the atmosphere can be treated as constant over the path. In this case it makes
sense to characterize the absorption as a specific attenuation value in dB/km,
which can be applied to the path distance to determine the total attenuation.
The expression for the total loss due to atmospheric absorption on a terres-
trial path is [2, equation (1)]
(6.17)
where d is the line-of-sight distance between the terminals in km and g
a
is the
specific attenuation of the atmosphere in dB/km. The specific attenuation of
the atmosphere is given by the sum of the specific attenuation due to water
vapor and that due to oxygen [12]:
(6.18)
While the ITU gives formulas for these parameters [12], they are very long
and tedious to evaluate. Instead of calculating the specific attenuation, it is
common practice to use values extracted from a plot like Figure 6.4. The plot
ggg
aow
=+
Ad
a
=g dB
ATMOSPHERIC ATTENUATION 121