Smith G.T. Cutting Tool Technology: Industrial Handbook
Подождите немного. Документ загружается.


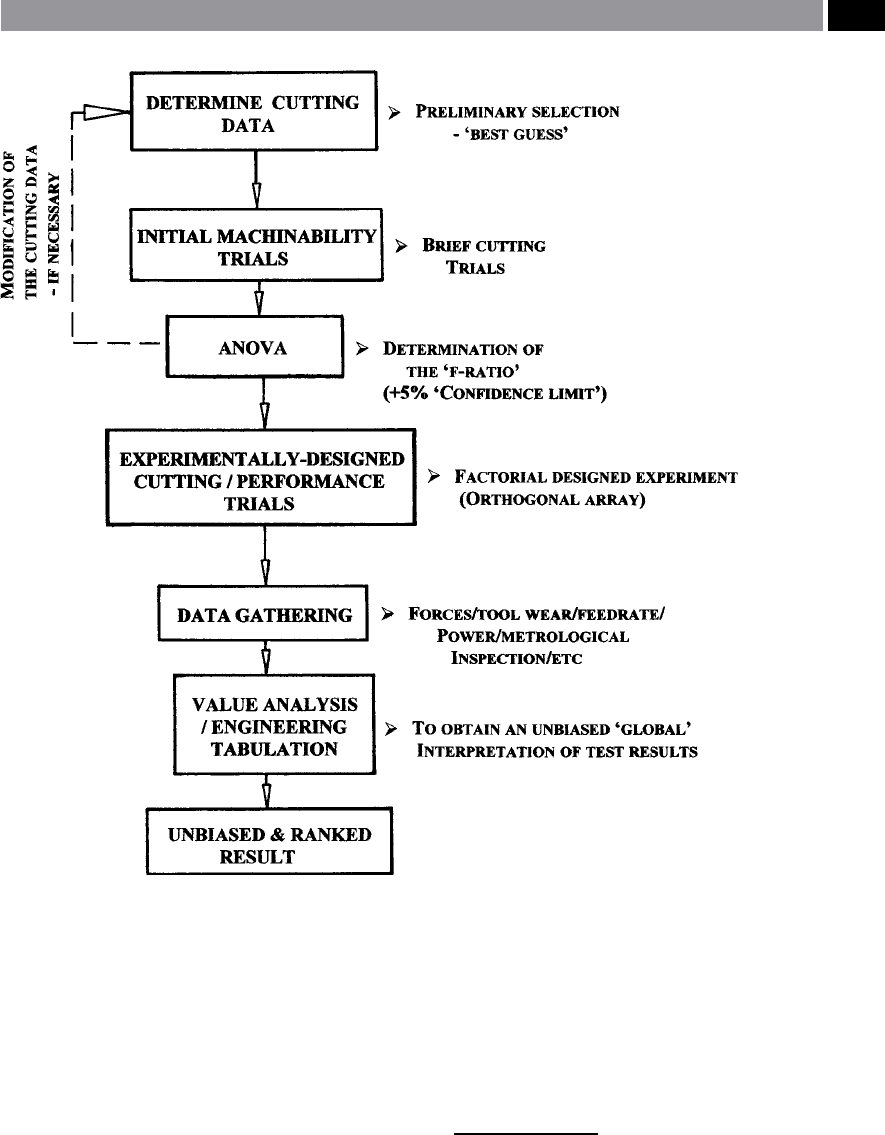
tions. For a practical machinability trial employing a
‘Latin square’ , it uses a two-way ANOVA
13
table, with a
limited amount of ‘degrees of freedom’ , typically: fee-
drate, cutting speed, D
OC
, plus surface nish – these
parameters can be changed/modied to suit the ‘pro-
gramme of machining’ in hand. By using a very lim-
ited group of cutting trials, a two-way ANOVA table
can be constructed and their respective ‘F-ratio’ for
each interaction can be determined. is calculated ‘F-
ratio’ should be greater than the 5% ‘condence limit’
of the statistical distribution to be signicant. If the F-
ratio falls below –5% (i.e. for the calculated F-ratio),
then the interactions are not signicant, which ne-
cessitates increasing the ‘factor strength’ (e.g. increas-
ing the: cutting speed, feedrate, etc.), to generate data
which is >5% condence limit – as shown by the ‘feed-
back loop’ in Fig. 149, or alternatively, using a dierent
factor. By such means, ANOVA tests for signicance of
machining data, ensures that the processing parameters
utilised for the prospective machinability trial are both
valid and the correct ones to use in the proposed ma-
chining programme.
13 ‘Analysis of variance’ (ANOVA), or as it should be more ap-
propriately termed the ‘analysis of variation about the means’ ,
consists of portioning the total variation present in a data set
into ‘components’. Each ‘component’ is attributed to an iden-
tiable cause, or source of variation; in addition, one ‘com-
ponent’ represents the variation due to uncontrolled factors
and random errors associated with the response measure-
ments.Specically, if the data set consists of ‘n’ measurements
‘y
1
.…,y
n
’ and their mean is denoted by: ‘y ’ , the total varia-
tion about the mean is embodied in the ‘sum of squared de-
viations’ , as following diagram depicts, for the ‘partitioning
scheme’ for ANOVA:
Total Sum of Squares about the mean:
n
�
i=
(y
−
¯
y)
↓ ↓ ↓ ↓ ↓
Sum of
squares
– due to
Source1
Sum of
squares
– due to
Source2
Sum of
squares
– due to
Source3
Sum of
squares
– due to
Source4
Error, or
residual
Sum of
Squares
e technique of analysis of variance decomposes this total
‘sum of squares’ into the parts shown above, for a case in
which four identiable sources of variation are present – in
addition to the ‘error component’. e number of identiable
causes of variation and the formulae for the ‘component sums
of squares’ are intrinsically connected to the specic experi-
mental design utilised, in the data collection and to the statis-
tical model deemed appropriate for this analysis.
Rather than spending considerable time, eort
and indeed exorbitant expense, on a large and com-
plex machining testing programme, which more oen
than not, produces numerous machined components
that are almost indistinguishable from each other. It
might be more prudent, to conduct a ‘condensed’ series
of trials, based upon a rigorous statistically-designed
methodology. erefore, experiments based on the so-
called ‘orthogonal arrays’ can be benecially engaged
in this regard. Many applied researchers and engineers
have utilised a range of factorial-designed experi-
ments, typied by the ‘Taguchi-approach’.
e main problem with these ‘arrays’ is that in many
situations the large number of ‘interactions’ (i.e. fac-
tors) have been shown to interfere with the overall re-
sults – introducing ‘secondary eects’ , which will not
have been anticipated for, when the original strategic
programme was devised
14
. Such spurious data, could
seriously aect future machining recommendations
and inuence the outcome in a negative manner. e
‘interaction problem’ can have these aects consider-
ably reduced by incorporating a more ‘truncated-ap-
proach’ to the experimental design strategy for the
machinability trials, rather than using a ‘full’ Taguchi
orthogonal array (Fig. 150). For example, if all of the
experiments are conducted in for example one of ‘stan-
dard’ the Taguchi L
8
(2
7
) orthogonal array, depicted in
Fig. 150, then the ‘total outcomes’ (i.e. components
machined), would be: 2
7
= 128 × 8 = 1,024 individual
components machined. Here, in the Taguchi orthogo-
nal array seven factors have been employed and with
the vast amount of components produced from such a
long-running and very costly machining programme,
many of the pertinent details will be lost on those en-
gineers/researchers attempting to de-code the vast as-
sortment of machinability data collated. However, it
is possible to utilise a much simpler-approach to the
overall massive data-collection and analysis problem,
yet still providing statistical signicance, this can be
achieved by adopting a ‘Fractional factorial-designed
experiment’. Here, instead of the virtually ‘mindless
task’ of producing 1,024 almost identical components,
14 ‘Orthogonal array factors’ – when utilising a ‘full’ Taguchi-
designed orthogonal array for a complete picture of all of the
interactions, then it has been shown (Shainin, 1985 – see refer-
ences), that if many factors are employed (i.e. normally >5),
this results in unwanted ‘secondary eects’ which cannot be
accounted for, leading to spurious results from any machin-
ability trials.
282 Chapter 7
by using a ‘Fractional factorial-designed experiment’
with an identical matrix to that given in Fig. 150,
only 8 components are produced! is testing regime
is both signicantly quicker and much less costly to
perform, obtaining a ‘snap-shot’ of the overall ma-
chinability problem, but because considerably less tes-
tpieces are produced, the ‘interaction-problem’ and its
‘secondary eects’ are not an issue, even when seven
factors are utilised. Obviously, this machinability data
has to be collated and investigated in a disciplined and
controlled fashion. One tried-and-tested method of
establishing an unbiased and ranked interpretation of
these results, is to use the much misunderstood and
maligned technique of ‘Value Analysis’
15
(VA). is VA
when used to show trends in competitive functions
15 ‘Value Engineering and Analysis’ (VE/VA), with VE being
principally concerned with an overall improvement of design-
based details on engineering components, while a more lim-
ited form of this technique is termed VA – being particularly
relevant for detailed interpretation of recorded data from ex-
perimentation. Here, in this case, from the wide-ranging and
oen seemingly unrelated output of machinability trials.
Figure 149. Flow chart indicating the desigh philosophy for unbiased and ranked machinability trials.
Machinability and Surface Integrity 283
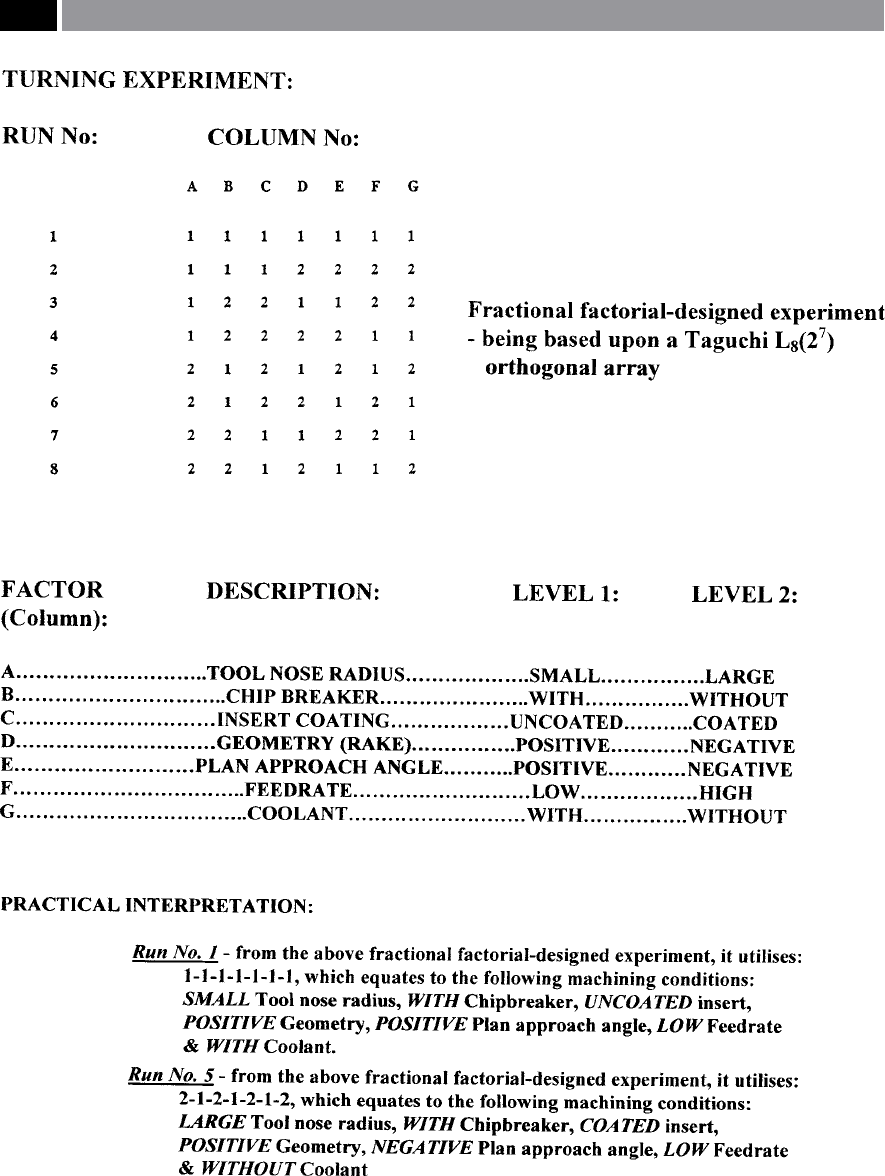
Figure 150. A fractional factorial-designed experiment, based upon a Taguchi L
8
(2
7
) – orthogonal array.
284 Chapter 7

and operations, can be successfully utilised from the
comparisons of cutting uids, through to complex and
dicult-to-machine aerospace machinability trials. If
a more sophisticated technique is required, then it is
also possible to utilise ‘Quality Function Deployment’
16
(QFD), to obtain a complete picture of the outcomes
from machining trials. QFD is oen used by indus-
try as a means for its ‘Continuous-improvement pro-
grammes’
17
. Here for ‘simplicity’s-sake’ , the more basic
and somewhat less complex VA tabulated data-colla-
tion approach, will be briey reviewed.
e application of VA to a series of collated and
compiled massed-data is not new. In fact, it was
widely-used during the 1960’s, but fell into disfavour,
partly because its function and operation were oen
not well-dened – this being exacerbated by poor im-
plementation of its recommendations. However, VA
techniques are useful, allowing one to interpret data
trends both quickly and objectively – without undue
bias – at a glance of a spreadsheet. Not only can signi-
cant trends be readily seen, but the spreadsheet shown
in Fig. 151 – shows a typical machinability data for P/
M compacts drilled by two diering drill-point geom-
etries. By using the spreadsheet, not only can overall
trends be readily seen, it also can depict sub-set trends
as well, giving a complete picture (i.e. globally) of the
important criteria in assessing machining data. As a
simple ranking system is used, considerable objectiv-
ity can be gained and with little undue inuence – bias,
aecting the outcome from these tabulated results. In
employing the ranking of the results, it is normal prac-
tice to decrement down and if two values are ranked
identically, then they are given the same rankings, fol-
lowed by the next lower ranking, being two numbers
lower, as following example shows:
16 ‘Quality Function Deployment’ (QFD), is a general term that
means the: ‘Deployment of quality through deployment of qual-
ity functions’ (Akao, 1988). It is oen known as the ‘House of
Quality’ , because the tabulated graphical representation looks
similar to that of a house – when all the interacting factors
for subsequent analysis have been included on the chart. is
QFD technique, is a wide-ranging philosophy for the com-
plete analysis of both simple and intricate designs and can be
successfully exploited for machinability trials.
17 ‘Continuous-improvement programmes’ ,
can be dened as
an: ‘Operational philosophy that makes the best use of resources
in order to increase product, or service quality and result in
more eective satisfaction of customers’ (Swanson, 1995).
For example, in Fig. 151 – for the values shown in
column two (i.e. le-hand side: Jobber drill, rust
F
orce 0.254 N):
Compact type: 1 2 3 4 5 6 7 8
Ranking: 6 8 5 1 5 7 3 2
NB Here, two 5’s were ranked, meaning that the next
decremented value would rank as 3. Hence, in this case
the Low compaction Compact type No. 2 this was best
and Low compaction No. 4 worst – as jobber drilled.
is ‘truncated approach’ the elementary and easily
comprehended VA tabulation (Fig. 151) , enables non-
specialists, together with knowlegdible experimenter,
to recognize the inuence various machining param-
eters have on the potential performance of the trials
undertaken. By judicious use, the VA technique in
conjunction with a strictly controlled and limited ma-
chining strategy – based upon some form of ‘orthogo-
n
al array’ , in combination with the ‘strength’ (i.e >5%
‘F-ratio’) of parameters by ANOVA, this will enable a
researcher to conduct a speedy, compact, realistic, yet
meaningful machinability assessment.
7.2 Machined Roundness
Roundness is a condition of a ‘surface of revolution’ ,
which can take the form of a: cylinder, cone, or sphere,
where all the peripheral data points (i.e. measure-
ments) intersect. In reality, the radius of say, a nomi-
nally round workpiece tends to deviate – from the
‘true circle’ – around the periphery of the part, making
these variations the theme to subjective interpretation
of the measured results. In fact, in the past, the sim-
plistic technique for the assessment of roundness was
usually measuring three diameters on a workpiece, to
determine the diametrical variations, then ‘averaging’
to give its overall dimensional size. Moreover, for vari-
ations in a workpiece’s radius about an axis of rotation,
this was oen found by positioning the part between a
‘
bench-’ , or sine-centres’ – the latter equipment is em-
ployed for turned tapered features, then rotating and
monitoring it with dial gauges both at and along its
length. In the past, this rather supercial metrologi-
cal workpiece assessment was supposed to inform the
inspector as to its potential in-service performance.
If some radial variations occurred, this geometrical
Machinability and Surface Integrity 285
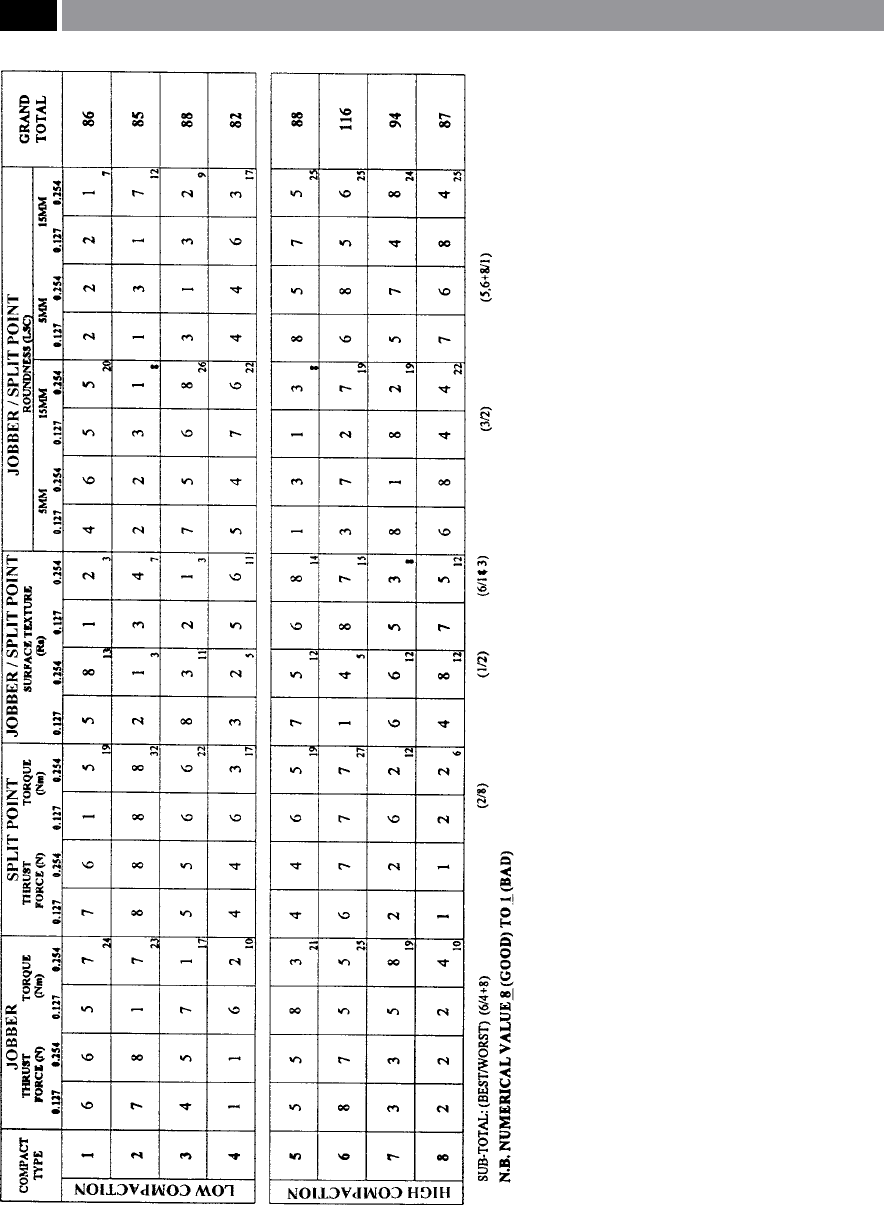
Figure 151. Value analysis – tabulation of the performance of two drilling
points and a typical range of drilling data, when machining powder metal-
lurgy compacts
.
286 Chapter 7

lobing
18
, or elliptical state, may have not have proven
to be detrimental to its prospective overall in-service
performance.
In reality, there might be a whole host of reasons
for a machined part to vary in its radius – for a stated
cross-sectional plane. e following list attempts to
show where and why radial dierences occur:
•
Machine tool and its production processes – induc-
ing some form of rotational imperfections from ei-
ther the machine/tool/workpiece system,
•
Release of strain, or that induced into a workpiece –
the former case may be the result of releasing the
part from its clamping pressure, while the latter
may result from plastic deformation promoting lo-
calised surface residual ‘hoop-stresses’
19
,
•
Induced radial vibration – potentially resulting
from cutting forces and its eect on rigidity, in as-
sociation with both tool geometry and cutting edge
displacement (i.e. see Fig. 152),
•
Circumferential surface texture – created by the
lasting eect resulting from the recent production
process.
It has been alluded to above that the machine tool and
particularly its spindle, can create machine-induced
inaccuracies of various kinds onto the machined
18 ‘Lobing’ , has a constant diameter if measured in a single plane.
When attempting to measure lobing with a ubiquitous mi-
crometer calliper, this is not possible, as a constant micrometer
reading will result. Conversely, an ‘elliptical’ workpiece has
both a major and minor diameters, allowing this diametral-
dierence to be determined using a micrometer calliper.
NB A ‘lobed-shape’ can be established, by either placing the
workpiece in a Vee-block, then carefully rotating the part and,
if any pointer motion appears on the touching dial gauge, this
represents the lobed-harmonic dierence. To obtain much
more detailed information on a ‘lobed’ workpiece, it is neces-
sary to inspect the part on a roundness measuring machine.
19 ‘Hoop-stress’ , this can be dened as: ‘e circumferential stress
in a cylinder wall under pressure, or in a rotating wheel [i.e.
mass]’ (Carvill, 1997). e maximum hoop stress can be found
using the following expression:
σ
hmax
= p
(r
b
+ r
a
)
(r
b
− r
a
)
i.e. at the inner radius: σ
L
= 0) (r
b
2
– r
a
2
)
Where: r = radius, p = pressure.
workpiece’s ‘harmonic roundness’
20
, some of these fac-
tors include:
•
Spindle imbalance – introducing dynamic lower-
frequency harmonics on the part,
•
Cutting forces – can dynamically aect the machin-
ing process, causing a series of high-frequency har-
monics to be superimposed on the lower-frequency
harmonic, resulting from imbalance (Fig. 152),
•
ermal growth eects – changing both the spin-
dle’s growth (axially) and causing modications of
an elastic nature to the relative ‘axis-orthogonali-
ties’
21
of the machine tool – which in turn, creates
harmonics on the machined part,
•
Working clearances and motor-drive congura-
tions – this is necessary to allow for relative ther-
mal growth and beaing component ‘running-ts’ –
within the spindle/headstock assembly, which are
exacerbated by the type of motor drive system, spe-
cically belt-driven systems (see Fig. 153).
is latter feature of spindle inaccuracy, is present
in many belt-driven CNC Lathes and turning centre
headstocks being minimised by having a machine tool
with a direct-drive spindle. In the case of these belt-
driven headstocks, the working clearances and belt-
drive, have the belts-tensioned on one side only. is
arrangement, causes an irregular harmonic rotational
motion to the spindle and hence, its work-holding
equipment – chuck, etc., which when translated onto
the resultant machined roundness and to a lesser ex-
tent the surface texture, creates harmonic problems
20 ‘Harmonic roundness’ , refers to the departures from roundness
of a workpiece, with harmonic eects – oen termed ‘undula-
tions per revolution’ (upr) – being instigated by any number
of external sources, such as those described in Table 10.
NB On Roundness testing machines, the various harmon-
ics are superimposed onto each other. For example, the 1
st
harmonic of the workpiece, may have say, the 5
th
harmonics
superimposed onto it, followed in a similar fashion by 60
th
harmonics. is composite harmonic behaviour can be ‘l-
tered-out’ by the judicious use of double Gaussian lters, in
order to see the eects of individual harmonic behaviour on
the machined part.
21 Machine tool ‘axis-orthogonalities’ , relate to the fact that
most of today’s 3-axes machine tools have each axis posi-
tioned either on top of each other and at 90° with respect to
each other (i.e. X- and Y-axes), or normal/right angles to these
axes (i.e. with respect to the Z-axis) – hence the term ‘orthog-
onality’.
Machinability and Surface Integrity 287
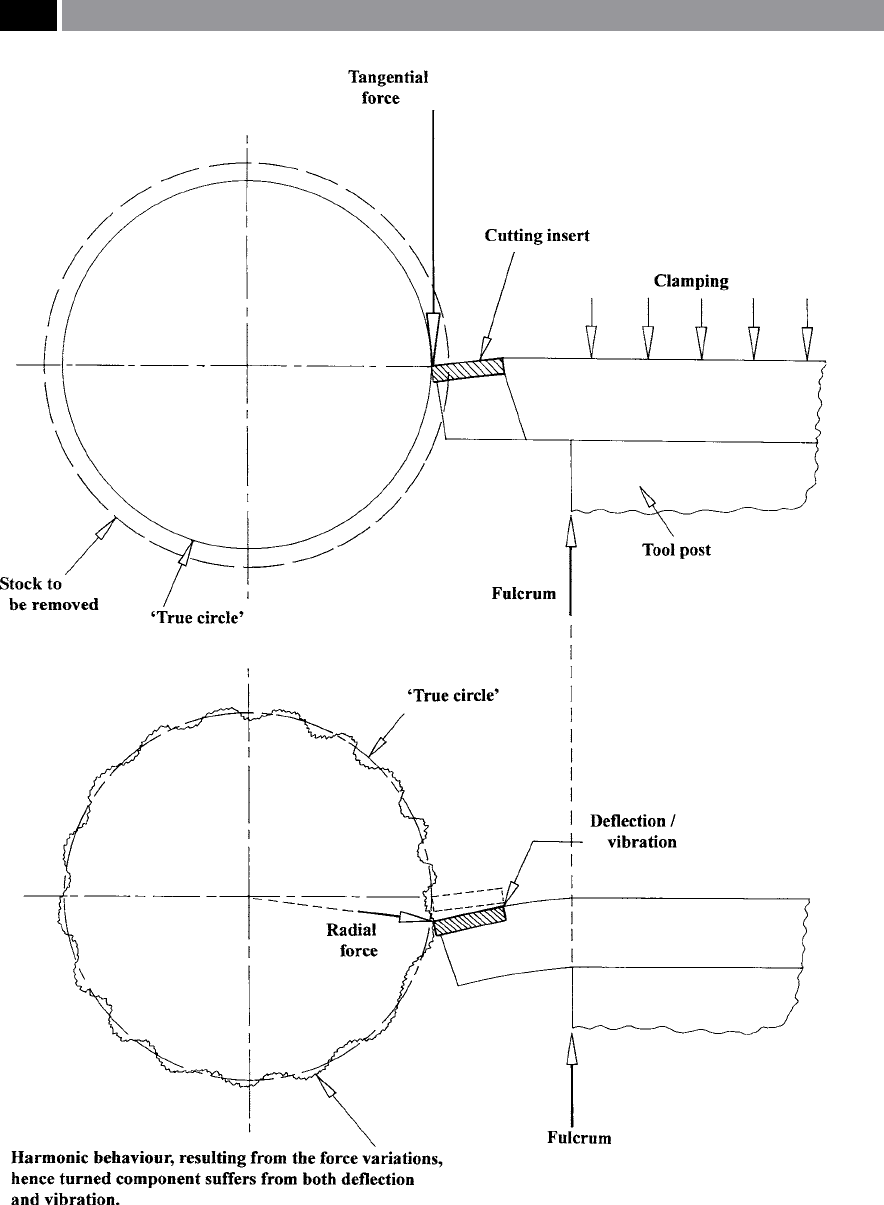
Figure 152. The harmonic departures from roundness of a component, resulting from a lack of rigidity/damping eects
whilst turning
.
288 Chapter 7

(Fig. 153a–c). e inuence of this irregular harmonic
rotational belt-driven rotation can be gained from the
schematic representation shown in Fig. 153d, where
a repeating-series of ‘tumbling three-lobed harmonic’
geometric shapes are reproduced on the workpiece.
e irregular, but periodic nature of the rotational
action of the belt-driven headstock is reproduced on
the workpiece by a series of kinematic combinations
of headstock rotation and linear motion supplied by
the longitudinal feed of the cutting tool along the part
(Fig. 153d). If a direct-drive headstock conguration
is utilised (Fig. 153e), then there is virtually no har-
monic inuence associated from the machine, so more
consistent turned components result.
Returning to Fig. 152, the overall machine-tool-
workpiece system, can be isolated to consider the
simple eect of a cantilevered cutting tool that is in-
adequately supported, or the unlikely occurrence of
too small a cross-sectional area – making it somewhat
‘u
nder-strength’. e main cutting force in turning op-
erations is the tangential force (i.e. see Fig. 19), it re-
sults from several factors, such as:
•
Resistance to rotation – caused by the workpiece
material’s inherent shear strength,
•
Undeformed chip thickness – resulting from the ra-
dial D
OC
selected,
•
Orientation of cutter rake angle geometry – this
being a combination of either a positive, neutral, or
negative rakes, plus to a lesser degree, the eect of
shape and size of the tool nose radius,
•
Feedrate – in combination with D
OC
, will heavily
inuence the size of the eective chip thickness and
play a dominant role in the resulting surface tex-
ture.
In the upper diagram in Fig. 152, the tangential force
is simplistically shown contacting the cutting insert
at the point. e application of the cutting force here,
causes a large bending moment to occur at the pivot
point – as shown. e resultant dynamic action of this
eect, is depicted in the lower diagram of Fig. 152,
where the tool has been elastically deected in a down-
ward manner by this bending moment. Moreover, as
the resistance to deection increases with the tool’s
downward direction, this intensies the pressure from
the inherent tool-body mechanical strength, enabling
a certain degree of recovery, therefore there is a partial
upward motion of the tool. is cyclical upward, then
downward tool point motion is repeated at a periodic
medium-frequency, causing a sinusoidal motional ef-
fect with this being harmonically reproduced on the
turned surface. High-frequency harmonics can also be
Table 10. The harmonic behaviour related to either the component manufacturing process, or its measurement
Harmonic: Cause:
1
st
(1 upr) Function of measurement – only caused by the setting-up error on the instrument being used to measure the
departures from roundness. The amplitude of this harmonic is equal to the eccentricity of the part, relative to the
spindle axis of the roundness instrument.
2
nd
(2 upr) Function of measurement, or manufacture – this aspect of harmonics is generally termed ovality and can be
caused either by a setting-up error of the roundness instrument, or the part being machined out-of-square to its
axis of rotation.
3
rd
–7
th
Function of manufacture – these harmonics are normally introduced by the work-holding technique during
manufacture. By way of illustration, if a three-jaw chuck were used to hold a relatively delicate part and excessive
clamping force was employed, then upon machining and subsequent workpiece removal a three-lobed part
would be the result.
15
th
-upwards Function of material and manufacture – this aspect of harmonic behaviour is usually introduced to the part by
either machine tool instability (i.e. self-excited vibration – chatter), or by the reaction of the materials used in the
component’s manufacture – cutting insert/toolholder, lubricant – if any used.
Upr: undulations per revolution
NB H
igher harmonics may be the result of instrument noise, or vibration.
[Courtesy of Taylor Hobson]
.
Machinability and Surface Integrity 289
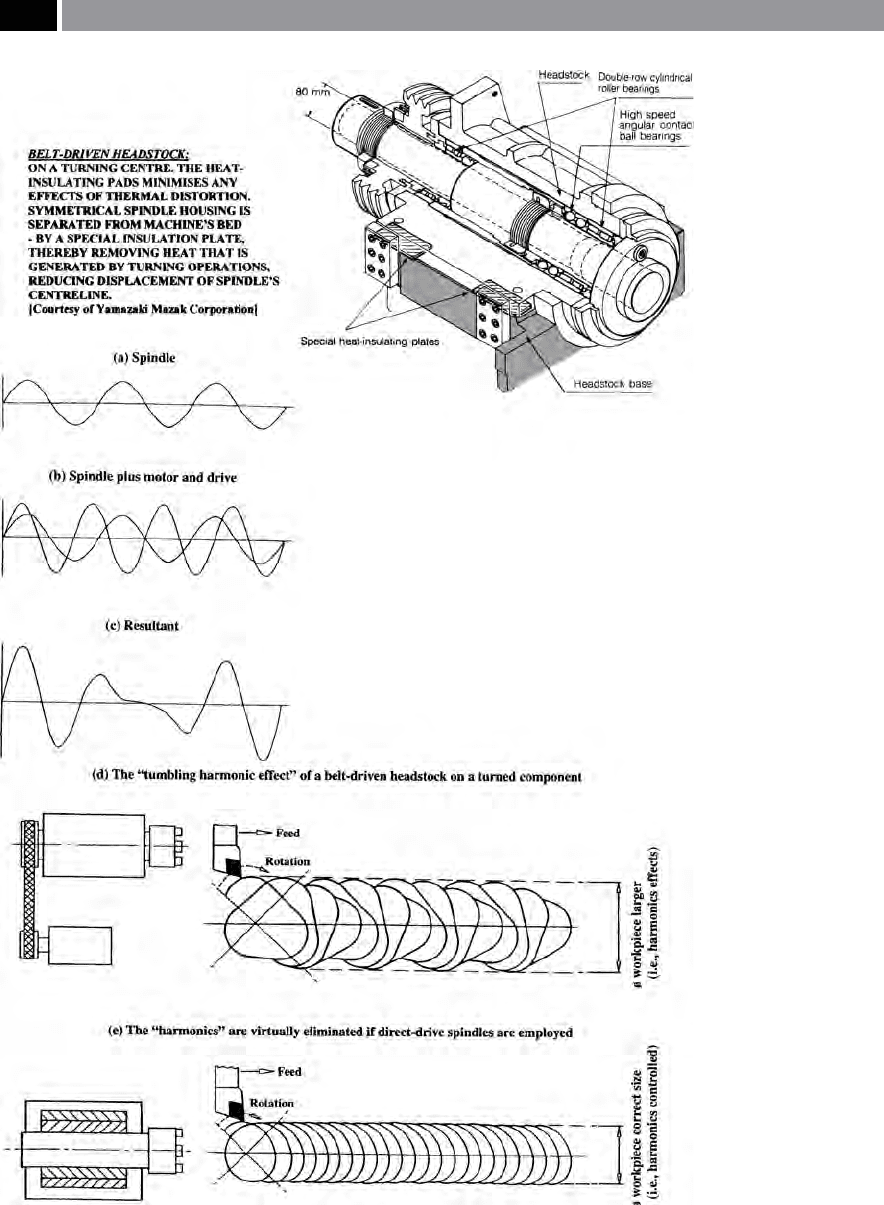
Figure 153. By utilising turning centre headstocks with direct-drive spindles – for ‘harmonic supres-
sion’, a signicant improvement in machined roundness will result. [Courtesy of Yamazaki Mazak]
.
290 Chapter 7

superimposed onto the medium-frequency harmon-
ics, this aspect can be shown to good eect by a ‘power
s
pectrum analysis’
22
of the harmonic behaviour during
machining.
For a simple turning operation, the resultant cutting
forces occur from the consequential combination of:
a workpiece material’s shear strength, its undeformed
chip thickness, the cutting insert geometry and ac-
companying nose radius, which has a signicant aect
on the harmonic ‘departures from roundness’ of the
turned part. So that the eect of these variables in the
cutting generation process can be seen, while simplify-
ing the discussion, only external-diameter operations
will be mentioned concerning these process-based
roundness relationships – in the following section.
7.2.1 Turned Roundness – Harmonics
and Geometrics
A typical operation on a either an engine-/centre-lathe,
or a turning centre, is schematically illustrated in Fig.
154. is involves a longitudinal turning process – the
workpiece being shown as partially completed – us-
i
ng a ‘light-turning and nishing cutting insert’ , as
it progresses along the turned part. Here, the turning
application has a long and slender workpiece this be-
ing held in a work-holding device: chuck, or collet – at
the headstock end, with further support
23
supplied by
22 ‘Power spectrum analysis’ , is a useful aid in process monitor-
ing of the cutting capabilities – giving a good interpretation
of the anticipated surface topography (i.e its ‘micro-terrain’).
A major advantage of utilising the ‘power spectrum’ as a diag-
nostic aid, is that it can separate-out any process-related tool
problems.
NB More details concerning the application of ‘power spec-
trum analysis’ can be obtained from the References by either
Whitehouse (1997), or Smith (2002).
23 ‘Programmable and xed steadies’ are oen used to give addi-
tional support to the long and slender parts, to minimise ‘bar-
relling eects’ – created by increased tool push-o the further
away the tool’s longitudinal distance becomes from the inu-
ence of the tailstock/headstock. Hence, the part has smaller
turned diameters toward its ‘supports’ steadily increasing in
diameter toward its centre, then reducing again – creating a
‘barrel-like prole’ along the entire turned bar’s length.
either a ‘dead-’ , or ‘rotating-centre’
24
– at the tailstock
end. As the orthogonally-oriented cutting insert (i.e.
having a zero-plan approach angle) turns along the
workpiece, a ‘moving step’ is seen to be present as the
‘emerging diameter’ occurs – to its set dimensional size
(Fig. 154). If a very high quality toleranced part is to
be turned, then it is desirable to review the operation
more critically, as some unexpected and unwanted
f
eatures may be present in the nal machined com-
ponent. As the turning insert has an orthogonal ori-
entation to the axis of rotation of the part (Fig. 154),
it might be thought that no radial force component
occurs, but this is not the case, as the tool nose radius
can create a radial force aecting the turned surface.
e radial force has little eect on the part’s harmon-
ics when close to the tailstock as shown by the cross-
sectional harmonic eect indicated in section ‘C-C’
(Fig. 154). Once the cutting insert has progressed
some distance along the workpiece, the contributing
and supporting inuence by the tailstock is lessened
and the eect of this radial force component increases,
a
s exhibited by section ‘B-B’ , this being amplied still
further in section ‘A-A’. Here (i.e. section ‘A-A’), the
harmonic departures from roundness are signicant,
a fact that has been recognised by precision turners
for many years. Experienced machinists when turn-
ing parts having long length-to-diameter ratios, will t
e
ither a ‘xed-steady’ , or more preferably a ‘moving-
steady’ close to the tool cutting zone – on the opposite
side of the workpiece – to counteract ‘push-o’ by the
radial force, while minimising component eccentric-
ity/run-out. If twin-turrets (i.e. upper and lower) are
tted to turning centres, then ‘
balanced turning’
25
can
be utilised as an alternative machining strategy.
ere is a direct link between cutting forces and the
geometric shape of the insert, this eect being illus-
24 ‘Rotating centres’ , can introduce their own eccentric error into
the turning process, as they are less rigid than their ‘dead-cen-
tre’ counterparts, but the latter, has a rotational speed restric-
tion – otherwise ‘dead-centre burn-out’ is likely and is there-
fore not practicable for high-production volume demands.
25 ‘Balanced turning’ ,
situates one cutting edge slightly ahead of
the other in their respective opposing turrets. In this manner,
the radial force components for each cutting insert have the
eect of ‘virtually’ cancelling each other out, allowing long
and slender workpieces to be successfully turned. A produc-
tion bonus being the removal of greater workpiece material
stock per pass.
Machinability and Surface Integrity 291