Smith R., Minton R. Calculus
Подождите немного. Документ загружается.


P1: OSO/OVY P2: OSO/OVY QC: OSO/OVY T1: OSO
MHDQ256-Ch00 MHDQ256-Smith-v1.cls December 8, 2010 15:25
LT (Late Transcendental)
CONFIRMING PAGES
0-43 CHAPTER 0
..
Review Exercises 43
EXPLORATORY EXERCISES
1. You have explored how completing the square can transform
any quadratic function into the form y = a(x − d)
2
+ e.We
concluded that all parabolas with a > 0 look alike. To see that
the same statement is not true of cubic polynomials, graph
y = x
3
and y = x
3
− 3x. In this exercise, you will use com-
pleting the cube todetermine how many differentcubic graphs
there are. To see what “completing the cube” would look like,
first show that (x + a)
3
= x
3
+ 3ax
2
+ 3a
2
x +a
3
. Use this
result to transform the graph of y = x
3
into the graphs of
(a) y = x
3
− 3x
2
+ 3x − 1 and (b) y = x
3
− 3x
2
+ 3x + 2.
Show that you can’t get a simple transformation to y = x
3
−
3x
2
+ 4x − 2. However, show that y = x
3
− 3x
2
+ 4x − 2
can be obtained from y = x
3
+ x by basic transforma-
tions. Show that the following statement is true: any cubic
function (y = ax
3
+ bx
2
+ cx +d) can be obtained with ba-
sic transformations from y = ax
3
+ kx for some constant k.
2. In many applications, it is important to take a section of a
graph (e.g., some data) and extend it for predictions or other
analysis. For example, suppose you have an electronic signal
equal to f (x) = 2x for 0 ≤ x ≤ 2. To predict the value of the
signal at x =−1, you would want to know whether the signal
was periodic. If the signal is periodic, explain why f (−1) = 2
would be a good prediction. In some applications, you would
assume that the function iseven. That is, f (x) = f (−x) forall
x.Inthiscase,you want f (x) = 2(−x) =−2x for−2 ≤x ≤0.
Graph the even extension f (x) =
−2x if −2 ≤ x ≤ 0
2x if 0 ≤ x ≤ 2
.
Findtheevenextensionfor(a) f (x) = x
2
+ 2x + 1,0 ≤ x ≤ 2
and (b) f (x) = sin x,0≤ x ≤ 2.
3. Similar to the even extension discussed in exploratory ex-
ercise 2, applications sometimes require a function to be
odd; that is, f (−x) =−f (x). For f (x) = x
2
,0≤ x ≤ 2,
the odd extension requires that for −2 ≤ x ≤ 0,
f (x) =−f (−x) =−(−x)
2
=−x
2
, so that
f (x) =
−x
2
if −2 ≤ x ≤ 0
x
2
if 0 ≤ x ≤ 2
. Graph y = f (x) and dis-
cuss how to graphically rotate the right half of the graph
to get the left half of the graph. Find the odd extension for
(a) f (x) = x
2
+ 2x,0≤ x ≤ 2 and (b) f (x) = 1 −cos x,
0 ≤ x ≤ 2.
Review Exercises
WRITING EXERCISES
The following list includes terms that are defined and theorems that
arestatedinthis chapter.Foreachterm or theorem, (1)givea precise
definition or statement, (2) state in general terms what it means and
(3) describe the types of problems with which it is associated.
Slope of a line Parallel lines Perpendicular lines
Domain Rational function Zero of a function
Quadratic formula Intercepts Factor Theorem
Graphing window Vertical Asymptote Sine function
Cosine function Periodic function Composition
TRUE OR FALSE
State whether each statement is true or false and briefly explain
why. If the statement is false, try to “fix it” by modifying the given
statement to a new statement that is true.
1. For a graph, you can compute the slope using any two points
and get the same value.
2. All graphs must pass the vertical line test.
3. A cubic function has a graphwith one local maximum andone
local minimum.
4. If f is a trigonometric function, then there is exactly one solu-
tion of the equation f (x) = 1.
5. The period of the function f (x) = sin(kx)is
2π
k
.
6. All quadratic functions have graphs that look like the parabola
y = x
2
.
In exercises 1 and 2, find the slope of the line through the given
points.
1. (2, 3), (0, 7) 2. (1, 4), (3, 1)
............................................................
In exercises 3 and 4, determine whether the lines are parallel,
perpendicular or neither.
3. y = 3x + 1 and y = 3(x − 2) +4
4. y =−2(x + 1) −1 and y =
1
2
x + 2
............................................................
5. Determine whether the points (1, 2), (2, 4) and (0, 6) form the
vertices of a right triangle.
6. Thedatarepresentpopulationsatvarioustimes. Plot thepoints,
discussanypatternsand predict the populationat the nexttime:
(0, 2100), (1, 3050), (2, 4100) and (3, 5050).
7. Find an equation of the line through the points indicated in the
graph that follows and compute the y-coordinate correspond-
ing to x = 4.
y
x
2 4 6
2
4
P1: OSO/OVY P2: OSO/OVY QC: OSO/OVY T1: OSO
MHDQ256-Ch00 MHDQ256-Smith-v1.cls December 8, 2010 15:25
LT (Late Transcendental)
CONFIRMING PAGES
44 CHAPTER 0
..
Preliminaries 0-44
Review Exercises
8. For f (x) = x
2
− 3x − 4, compute f (0), f (2) and f (4).
............................................................
In exercises 9 and 10, find an equation of the line with given
slope and point.
9. m =−
1
3
, (−1, −1) 10. m =
1
4
, (0, 2)
............................................................
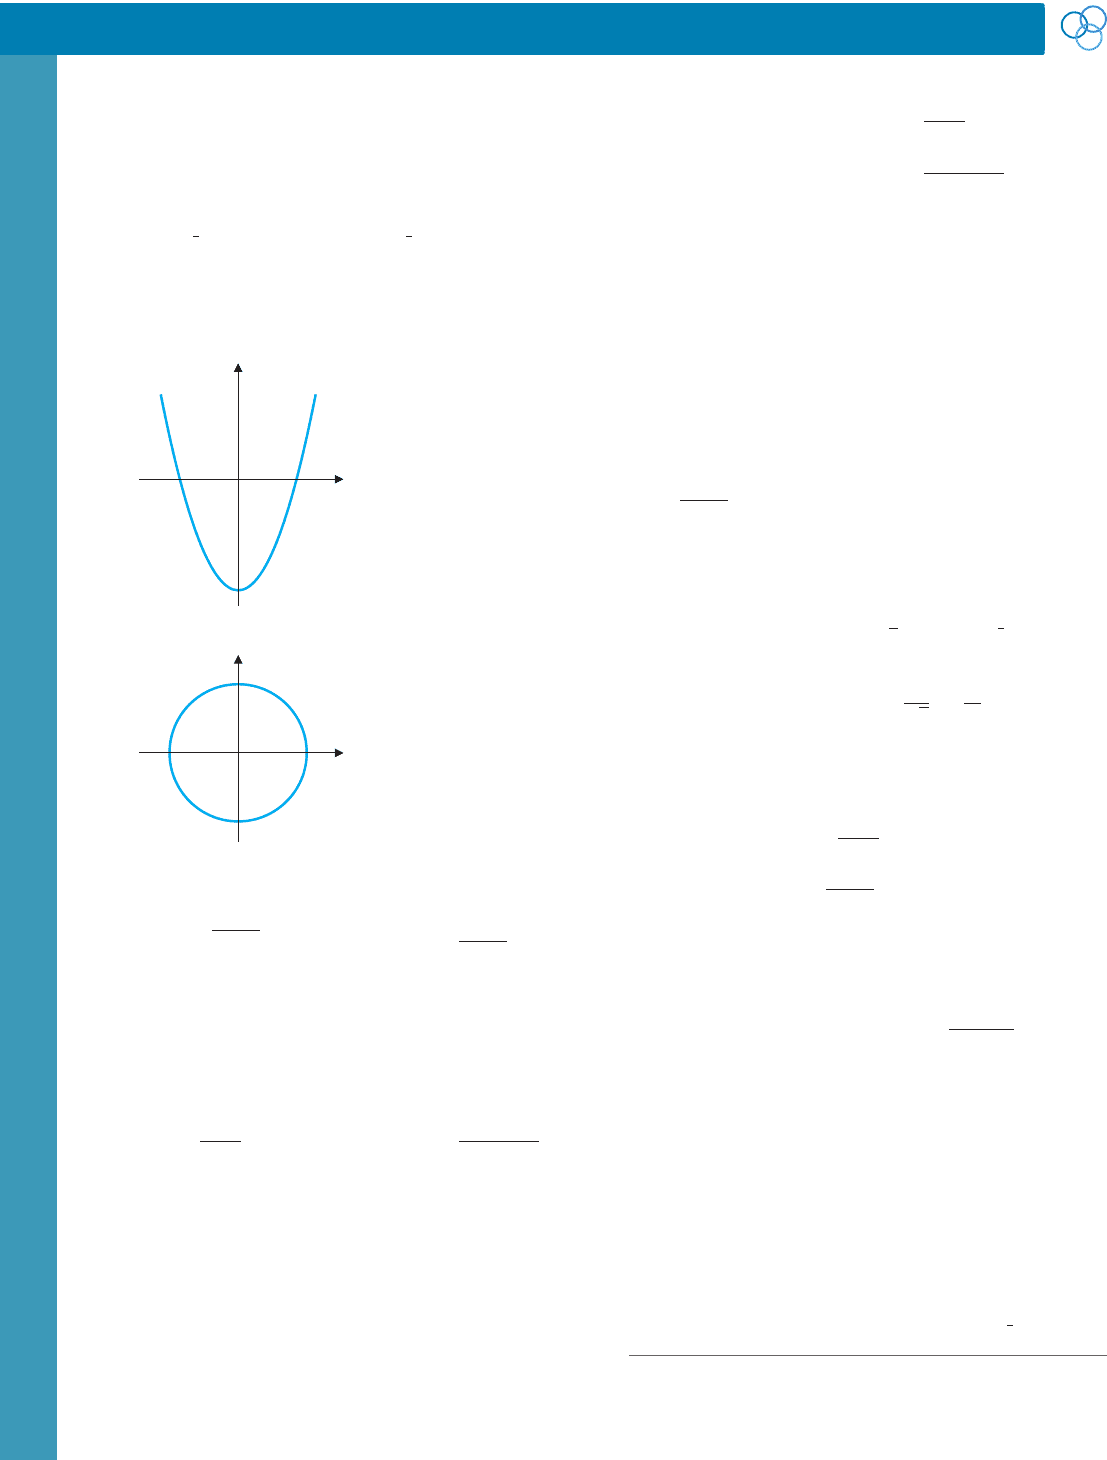
In exercises 11 and 12, use the vertical line test to determine
whether the curve is the graph of a function.
11.
y
x
12.
y
x
............................................................
In exercises 13 and 14, find the domain of the given function.
13. f (x) =
√
4 − x
2
14. f (x) =
x − 2
x
2
− 2
............................................................
In exercises 15–26, sketch a graph of the function showing ex-
trema, intercepts and vertical asymptotes.
15. f (x) = x
2
+ 2x − 8 16. f (x) = x
3
− 6x + 1
17. f (x) = x
4
− 2x
2
+ 1 18. f (x) = x
5
− 4x
3
+ x − 1
19. f (x) =
4x
x + 2
20. f (x) =
x − 2
x
2
− x − 2
21. f (x) = sin3x 22. f (x) = tan4x
23. f (x) = sinx + 2cos x 24. f (x) = sinx + cos2x
25. f (x) = sec2x 26. f (x) = 3tan 2x
............................................................
27. Determineallinterceptsof y = x
2
+2x −8. (Seeexercise15.)
28. Determineallinterceptsof y = x
4
−2x
2
+1. (Seeexercise17.)
29. Find all vertical asymptotes of y =
4x
x + 2
.
30. Find all vertical asymptotes of y =
x − 2
x
2
− x − 2
.
............................................................
In exercises 31–34, find or estimate all zeros of the given
function.
31. f (x) = x
2
− 3x − 10 32. f (x) = x
3
+ 4x
2
+ 3x
33. f (x) = x
3
− 3x
2
+ 2 34. f (x) = x
4
− 3x − 2
............................................................
In exercises 35 and 36, determine the number of solutions.
35. sin x = x
3
36.
√
x
2
+ 1 = x
2
− 1
............................................................
37. A surveyor stands 50 feet from a telephone pole and measures
an angle of 34
◦
to the top. How tall is the pole?
38. Find sinθ, given that 0 <θ<
π
2
and cosθ =
1
5
.
39. Convert to fractional or root form: (a) 5
−1/2
(b) 3
−2
.
40. Convert to exponential form: (a)
2
√
x
(b)
3
x
2
.
............................................................
In exercises 41 and 42, find f ◦ g and g ◦ f , and identify their
respective domains.
41. f (x) = x
2
, g(x) =
√
x − 1
42. f (x) = x
2
, g(x) =
1
x
2
− 1
............................................................
In exercises 43 and 44, identify functions f (x) and g(x) such
that ( f ◦ g)(x) equals the given function.
43. cos(3x
2
+ 2) 44.
√
sin x + 2
............................................................
In exercises 45 and 46, complete the square and explain how
to transform the graph of y x
2
into the graph of the given
function.
45. f (x) = x
2
− 4x + 1 46. f (x) = x
2
+ 4x + 6
............................................................
In exercises 47 and 48, find all solutions of the equation.
47. sin2x = 1 48. cos3x =
1
2

P1: OSO/OVY P2: OSO/OVY QC: OSO/OVY T1: OSO
MHDQ256-Ch00 MHDQ256-Smith-v1.cls December 8, 2010 15:25
LT (Late Transcendental)
CONFIRMING PAGES
0-45 CHAPTER 0
..
Review Exercises 45
Review Exercises
EXPLORATORY EXERCISES
1. In this exercise you will explore polynomials of degree four.
Start by graphing y = x
4
, y = x
4
+ 1, y = x
4
− 1 and other
graphs of the form y = x
4
+C
0
. What effect does the co-
efficient C
0
have on the graph? Continue with graphs of
y = x
4
+ x
2
, y = x
4
− x
2
and other graphs of the form
y = x
4
+C
2
x
2
. What effect does the coefficient C
2
have
on the graph? Try other graphs to determine the ef-
fects of the coefficients C
1
and C
3
on the graph of
y = x
4
+C
3
x
3
+C
2
x
2
+C
1
x +C
0
.
2. Baseball players often say that an unusually fast pitch rises
or even hops up as it reaches the plate. One explanation of
this illusion involves the players’ inability to track the ball
all the way to the plate. The player must compensate by
predicting where the ball will be when it reaches the plate.
Suppose the height of a pitch when it reaches home plate is
h =−(240/v)
2
+ 6 feet, for a pitch with velocity v ft/s. (This
equation takes into consideration gravity but not air resis-
tance.) Halfway to the plate, the height would be h =
−(120/v)
2
+ 6 feet. Compare the halfway heights for pitches
withv = 132andv = 139(about90and95mph,respectively).
Would a batter be able to tell much difference between them?
Now compare the heights at the plate. Why might the batter
think that the faster pitch hopped up right at the plate? How
many inches did the faster pitch hop?
This page intentionally left blank
P1: OSO/OVY P2: OSO/OVY QC: OSO/OVY T1: OSO
MHDQ256-Ch01 MHDQ256-Smith-v1.cls December 6, 2010 20:21
LT (Late Transcendental)
CONFIRMING PAGES
CHAPTER
1
Limits and Continuity
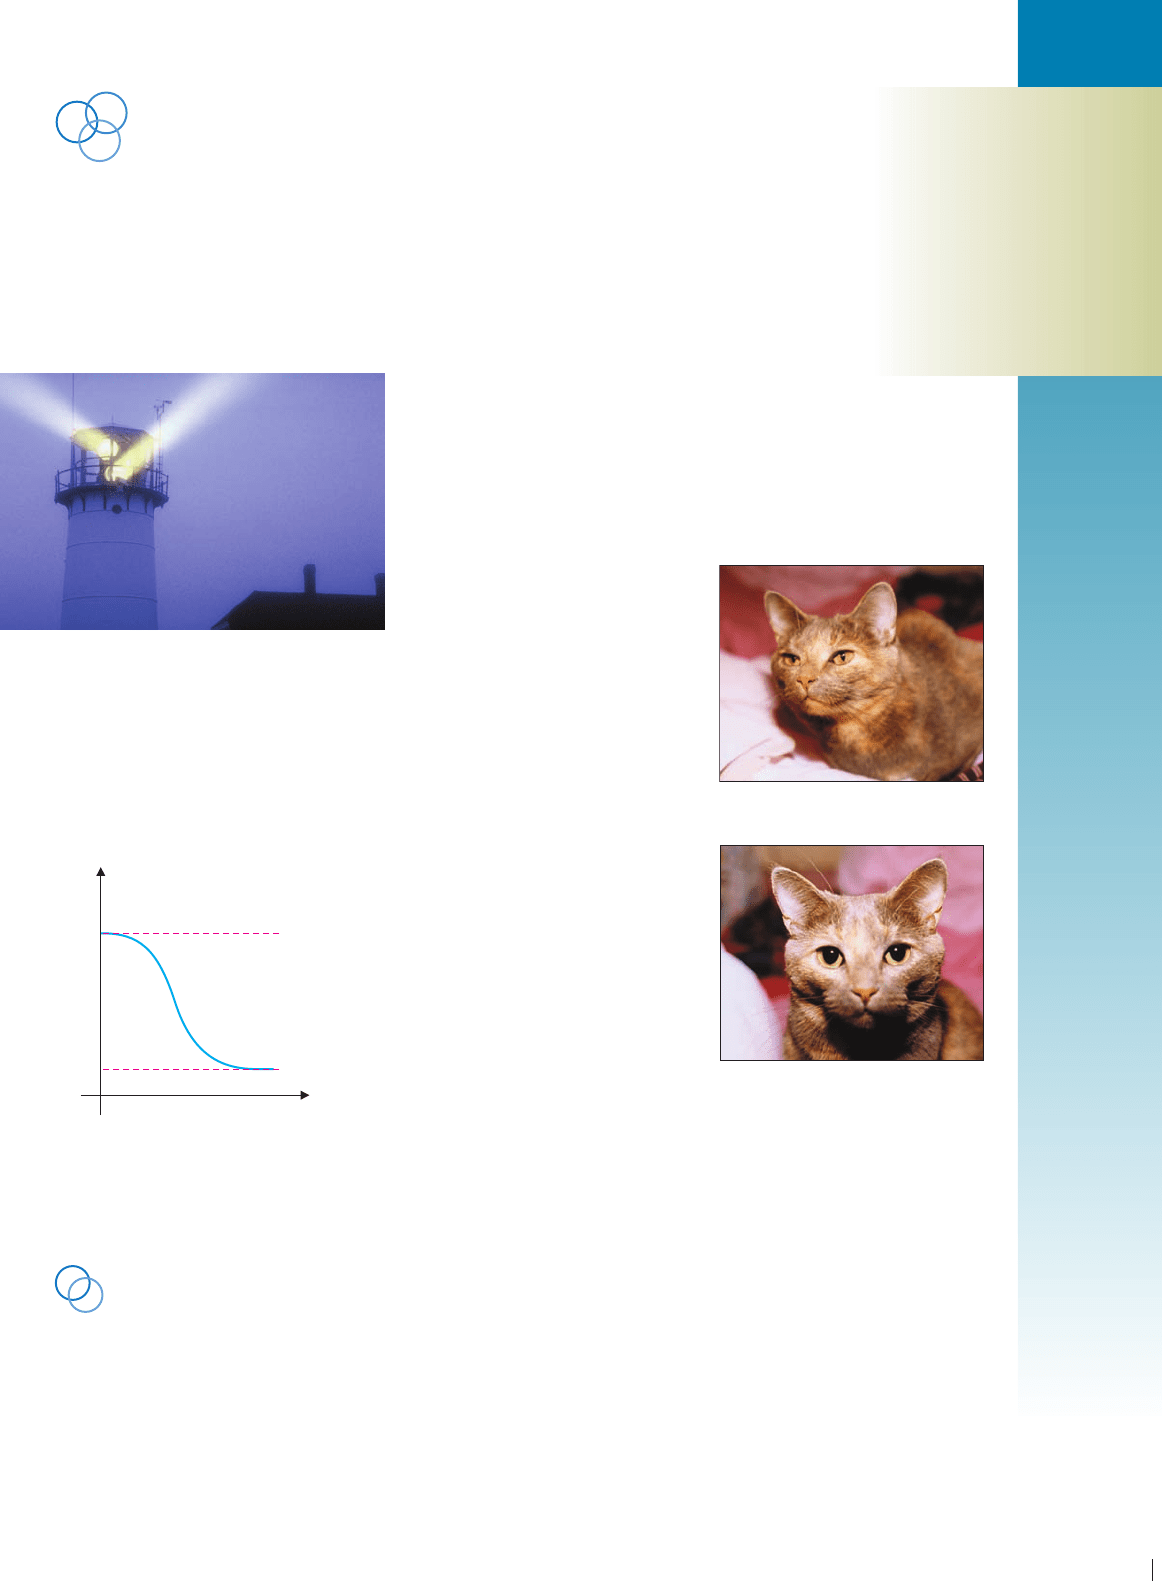
When you enter a darkened room, your eyes adjust to the reduced level
of light by increasing the size of your pupils, allowing more light to enter
the eyes and making objects around you easier to see. By contrast, when
you enter a brightly lit room, your pupils contract, reducing the amount
of light entering the eyes, as too much light would overload your visual
system.
Researchers study such mech-
anisms by performing experiments
and trying to find a mathematical de-
scription of the results. In this case,
you might want to represent the size of the
pupils as a function of the amount of light
present. Two basic characteristics of such a
mathematical model would be
Small pupils
Large pupils
1. As the amount of light (x) increases, the
pupil size (y) decreases down to some
minimum value p; and
2. As the amount of light (x) decreases, the
pupil size (y) increases up to some maxi-
mum value P.
There are many functions with these
two properties, but one possible graph of
such a function is shown in Figure 1.1. (See
example 5.9 for more.) In this chapter, we
develop the concept of limit, which can be
used to describe properties such as those
listed above. The limit is the fundamental
notion of calculus and serves as the thread
thatbindstogethervirtuallyallofthecalculusyouareabouttostudy.Aninvestment
in carefully studying limits now will have very significant payoffs throughout the
remainder of your calculus experience and beyond.
p
P
Pupil diameter
Intensity of light
FIGURE 1.1
Size of pupils
1.1 A BRIEF PREVIEW OF CALCULUS: TANGENT LINES
AND THE LENGTH OF A CURVE
Inthissection,weapproachtheboundarybetweenprecalculusmathematicsandthe
calculus by investigating severalimportant problems requiring the use of calculus.
Recall that the slope of a straight line is the change in y divided by the change
47
P1: OSO/OVY P2: OSO/OVY QC: OSO/OVY T1: OSO
MHDQ256-Ch01 MHDQ256-Smith-v1.cls December 6, 2010 20:21
LT (Late Transcendental)
CONFIRMING PAGES
48 CHAPTER 1
..
Limits and Continuity 1-2
in x. This fraction is the same regardless of which two points you use to compute the slope.
For example, the points (0, 1), (1, 4) and (3, 10) all lie on the line y = 3x + 1. The slope of
3 can be obtained from any two of the points. For instance,
m =
4 − 1
1 − 0
= 3orm =
10 − 1
3 − 0
= 3.
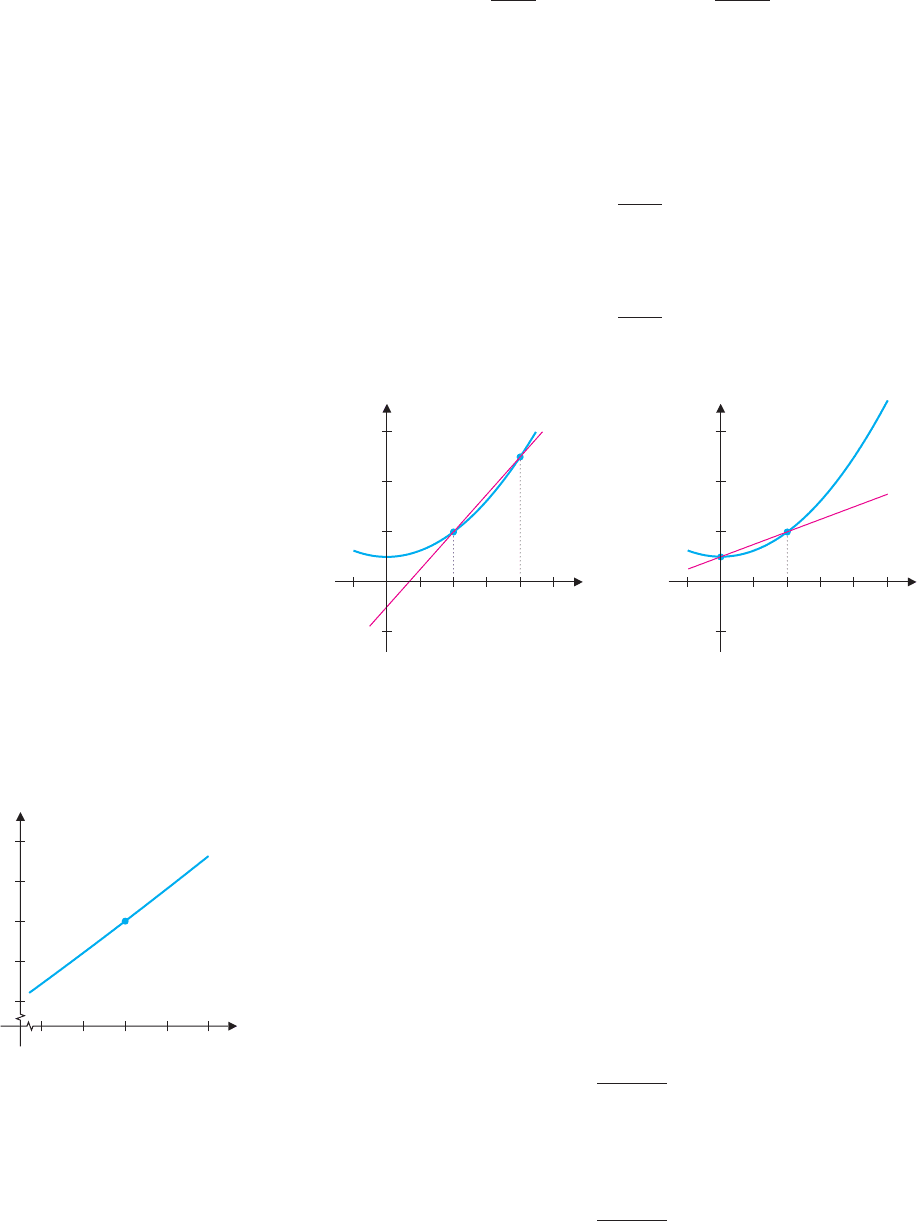
In the calculus, we generalize this problem to find the slope of a curve at a point. For
instance, suppose we wanted to find the slope of the curve y = x
2
+ 1 at the point (1, 2).
You might think of picking a second point on the parabola, say (2, 5). The slope of the line
through these two points (called a secant line; see Figure 1.2a) is easy enough to compute.
We have
m
sec
=
5 − 2
2 − 1
= 3.
However, using the points (0, 1) and (1, 2), we get a different slope (see Figure 1.2b):
m
sec
=
2 − 1
1 − 0
= 1.
y
0.5 1 1.5 2 2.50.5
2
2
4
6
x
y
0.5 1 1.5 2 2.50.5
2
2
4
6
x
FIGURE 1.2a
Secant line, slope = 3
FIGURE 1.2b
Secant line, slope = 1
In general, the slopes of secant lines joining different points on a curve are not the same, as
seen in Figures 1.2a and 1.2b.
0.96 0.98 1.00 1.02 1.04
1.90
1.95
2.00
2.05
2.10
y
x
FIGURE 1.3
y = x
2
+ 1
So, what do we mean by the slope of a curve at a point? The answer can be visualized
by graphically zooming in on the specified point. In the present case, zooming in tight on
the point (1, 2), you should get a graph something like the one in Figure 1.3, which looks
verymuch like a straight line. In fact, the more you zoom in, the straighter the curve appears
to be. So, here’s the strategy: pick several points on the parabola, each closer to the point
(1, 2) than the previous one. Compute the slopes of the lines through (1, 2) and each of the
points. The closer the second point gets to (1, 2), the closer the computed slope is to the
answer you seek.
For example, the point (1.5, 3.25) is on the parabola fairly close to (1, 2). The slope of
the line joining these points is
m
sec
=
3.25 − 2
1.5 − 1
= 2.5.
The point (1.1, 2.21) is even closer to (1, 2). The slope of the secant line joining these two
points is
m
sec
=
2.21 − 2
1.1 − 1
= 2.1.
P1: OSO/OVY P2: OSO/OVY QC: OSO/OVY T1: OSO
MHDQ256-Ch01 MHDQ256-Smith-v1.cls December 6, 2010 20:21
LT (Late Transcendental)
CONFIRMING PAGES
1-3 SECTION 1.1
..
A Brief Preview of Calculus 49
Continuing in this way, we obtain successively better estimates of the slope, as illustrated
in example 1.1.
EXAMPLE 1.1 Estimating the Slope of a Curve
Estimate the slope of y = x
2
+ 1atx = 1.
Solution We focus on the point whose coordinates are x = 1 and y = 1
2
+ 1 = 2. To
estimate the slope, choose a sequence of points near (1, 2) and compute the slopes of
the secant lines joining those points with (1, 2). (We showed sample secant lines in
Figures 1.2a and 1.2b.) Choosing points with x > 1(x-values of 2, 1.1 and 1.01) and
points with x < 1(x-values of 0, 0.9 and 0.99), we compute the corresponding y-values
using y = x
2
+ 1 and get the slopes shown in the following table.
Second Point m
sec
(2, 5)
5 − 2
2 − 1
= 3
(1.1, 2.21)
2.21 − 2
1.1 − 1
= 2.1
(1.01, 2.0201)
2.0201 − 2
1.01 − 1
= 2.01
Second Point m
sec
(0, 1)
1 − 2
0 − 1
= 1
(0.9, 1.81)
1.81 − 2
0.9 − 1
= 1.9
(0.99, 1.9801)
1.9801 − 2
0.99 − 1
= 1.99
Observe that in both columns, as the second point gets closer to (1, 2), the slope of
the secant line gets closer to 2. A reasonable estimate of the slope of the curve at the
point (1, 2) is then 2.
In Chapter 2, we develop a powerful yet simple technique for computing such slopes
exactly. We’ll see that (under certain circumstances) the secant lines approach a line (the
tangent line) with the same slope as the curve at that point. Note what distinguishes the
calculus problem from the corresponding algebra problem. The calculus problem involves
something we call a limit. While we presently can only estimate the slope of a curve using
a sequence of approximations, the limit allows us to compute the slope exactly.
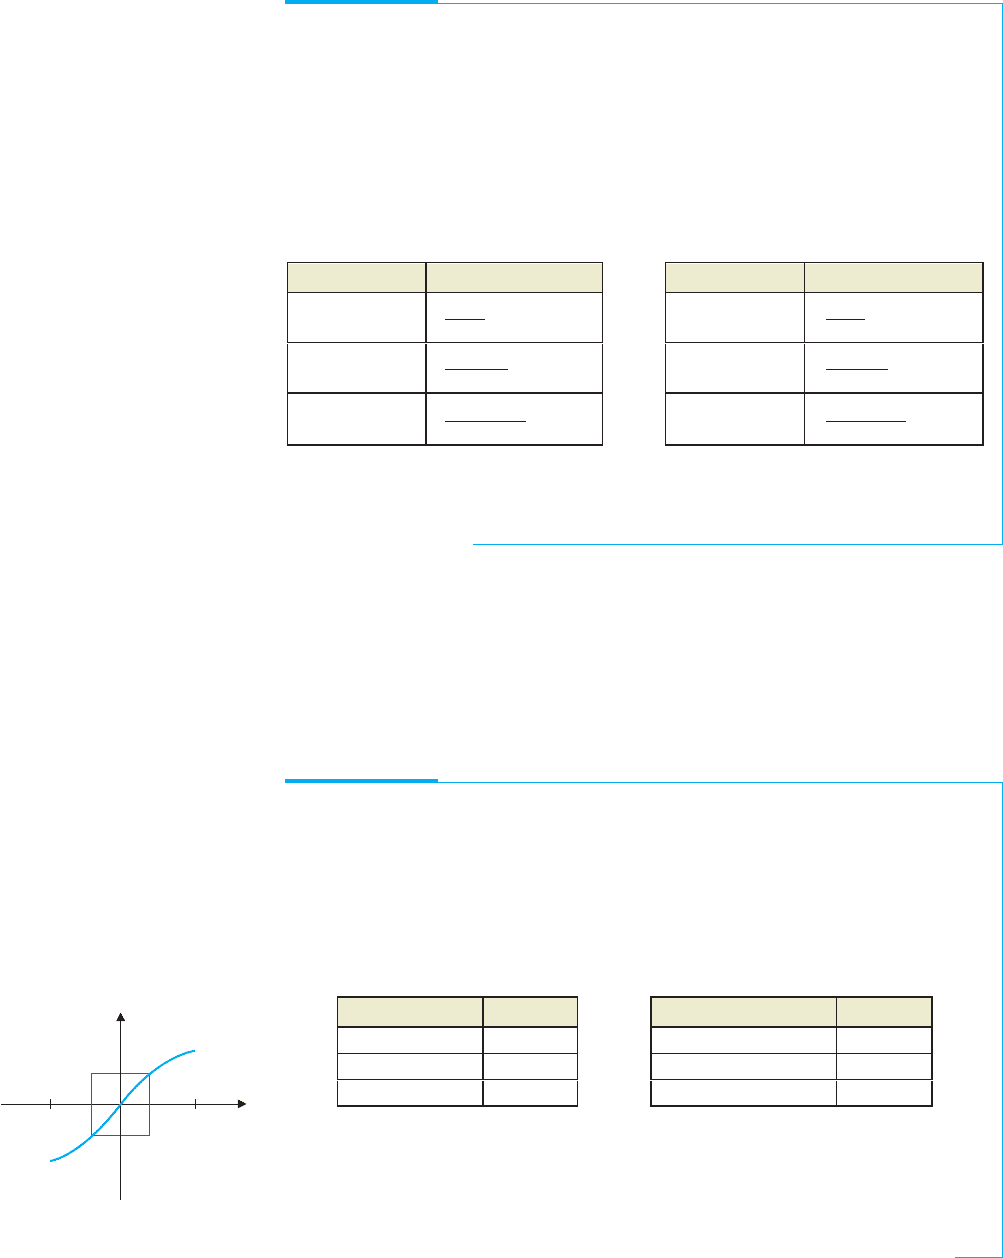
EXAMPLE 1.2 Estimating the Slope of a Curve
Estimate the slope of y = sin x at x = 0.
y
x
q
q
FIGURE 1.4
y = sin x
Solution This turns out to be a very important problem, one that we will return to
later. For now, choose a sequence of points on the graph of y = sin x near (0, 0) and
compute the slopes of the secant lines joining those points with (0, 0). The following
tables show one set of choices.
Second Point m
sec
(1, sin1) 0.84147
(0.1, sin0.1) 0.99833
(0.01, sin0.01) 0.99998
Second Point m
sec
(−1, sin(−1)) 0.84147
(−0.1, sin(−0.1)) 0.99833
(−0.01, sin(−0.01)) 0.99998
Note that as the second point gets closer and closer to (0, 0), the slope of the secant line
(m
sec
) appears to get closer and closer to 1. A good estimate of the slope of the curve at
the point (0, 0) would then appear to be 1. Although we presently have no way of
computing the slope exactly, this is consistent with the graph of y = sin x in Figure 1.4.
Note that near (0, 0), the graph resembles that of y = x, a straight line of slope 1.
P1: OSO/OVY P2: OSO/OVY QC: OSO/OVY T1: OSO
MHDQ256-Ch01 MHDQ256-Smith-v1.cls December 6, 2010 20:21
LT (Late Transcendental)
CONFIRMING PAGES
50 CHAPTER 1
..
Limits and Continuity 1-4
A second problem requiring the power of calculus is that of computing distance along
a curved path. While this problem is of less significance than our first example (both
historicallyandinthe development of the calculus), it provides a good indication of the need
for mathematics beyond simple algebra. You should pay special attention to the similarities
between the development of this problem and our earlier work with slope.
Recall that the (straight-line) distance between two points (x
1
, y
1
) and (x
2
, y
2
)is
d{(x
1
, y
1
), (x
2
, y
2
)}=
(x
2
− x
1
)
2
+ (y
2
− y
1
)
2
.
For instance, the distance between the points (0, 1) and (3, 4) is
d{(0, 1), (3, 4)}=
(3 − 0)
2
+ (4 −1)
2
= 3
√
2 ≈ 4.24264.
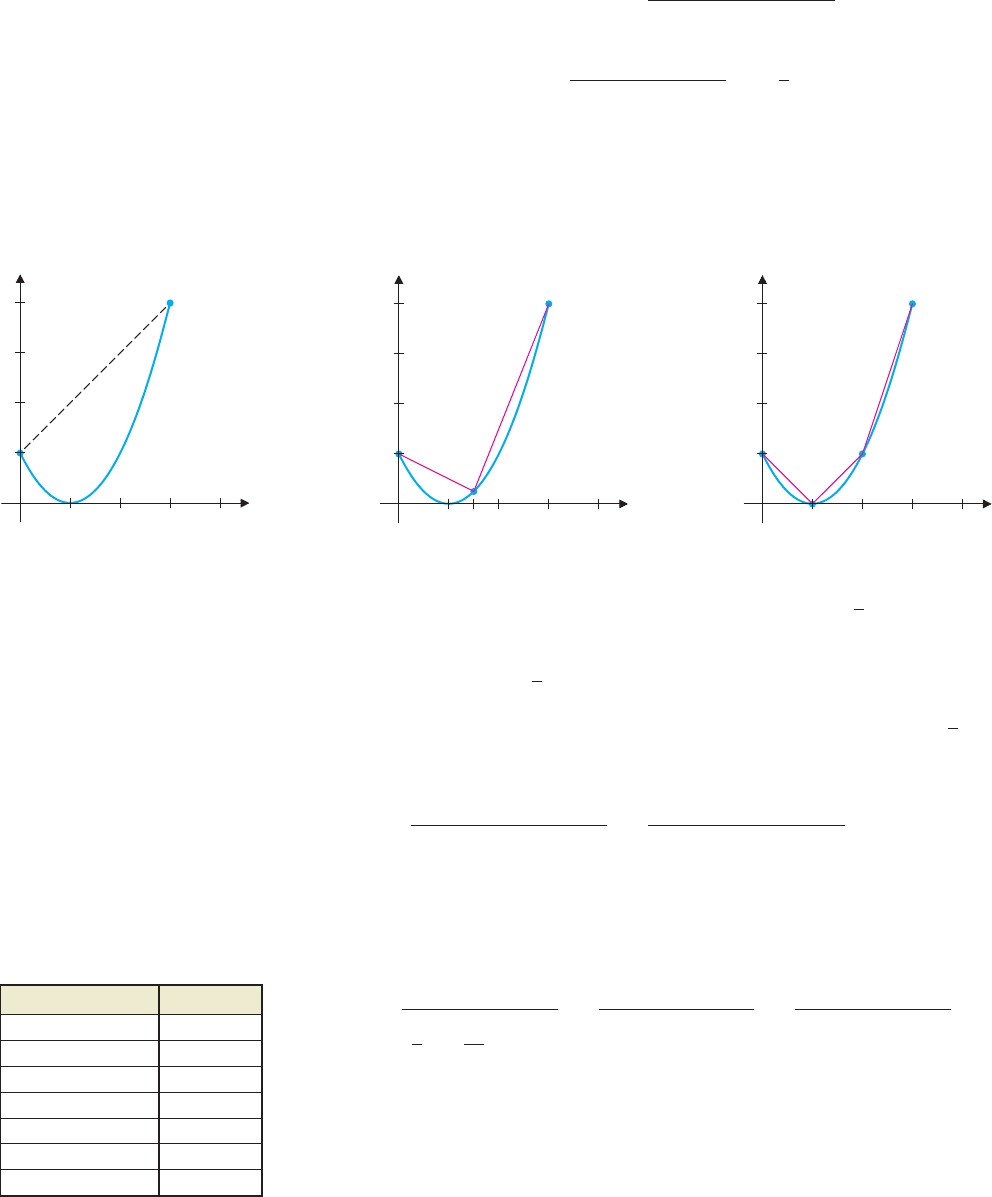
However, this is not the only way we might want to compute the distance between these
two points. For example, suppose that you needed to drive a car from (0, 1) to (3, 4) along
a road that follows the curve y = (x − 1)
2
. (See Figure 1.5a.) In this case, you don’t care
about the straight-line distance connecting the two points, but only about how far you must
drive along the curve (the length of the curve or arc length).
y
x
1 2 3 4
1
2
3
4
(3, 4)
(0, 1)
FIGURE 1.5a
y = (x − 1)
2
y
x
1 21.5 3 4
1
2
3
4
(3, 4)
(0, 1)
y
x
1 2 3 4
1
2
3
4
(3, 4)
(0, 1) (2, 1)
FIGURE 1.5b
Two line segments
FIGURE 1.5c
Three line segments
Notice that the distance along the curve must be greater than 3
√
2 (the straight-line
distance). Taking a cue from the slope problem, we can formulate a strategy for obtaining
a sequence of increasingly accurate approximations. Instead of using just one line segment
to get the approximation of 3
√
2, we could use two line segments, as in Figure 1.5b. Notice
that the sum of the lengths of the two line segments appears to be a much better ap-
proximation to the actual length of the curve than the straight-line distance of 3
√
2. This
distance is
d
2
= d{(0, 1), (1.5, 0.25)}+d{(1.5, 0.25), (3, 4)}
=
(1.5 − 0)
2
+ (0.25 −1)
2
+
(3 − 1.5)
2
+ (4 −0.25)
2
≈ 5.71592.
You’re probably way ahead of us by now. If approximating the length of the curve
with two line segments gives an improved approximation, why not use three or four or
more? Using the three line segments indicated in Figure 1.5c, we get the further improved
approximation
d
3
= d{(0, 1), (1, 0)}+d{(1, 0), (2, 1)}+d{(2, 1), (3, 4)}
=
(1 − 0)
2
+ (0 −1)
2
+
(2 − 1)
2
+ (1 −0)
2
+
(3 − 2)
2
+ (4 −1)
2
= 2
√
2 +
√
10 ≈ 5.99070.
No. of Segments Distance
1 4.24264
2 5.71592
3 5.99070
4 6.03562
5 6.06906
6 6.08713
7 6.09711
Note that the more line segments we use, the better the approximation appears to be.
This process will become much less tedious with the development of the definite integral in
Chapter 4. For now we list a number of these successively better approximations (produced
using points on the curve with evenly spaced x-coordinates) in the table found in the
margin. The table suggests that the length of the curve is approximately 6.1 (quite far from
P1: OSO/OVY P2: OSO/OVY QC: OSO/OVY T1: OSO
MHDQ256-Ch01 MHDQ256-Smith-v1.cls December 6, 2010 20:21
LT (Late Transcendental)
CONFIRMING PAGES
1-5 SECTION 1.1
..
A Brief Preview of Calculus 51
the straight-line distance of 4.2). If we continued this process using more and more line seg-
ments, the sum oftheir lengths would approach the actual length of the curve (about 6.126).
As in the problem of computing the slope of a curve, the exact arc length is obtained as
a limit.
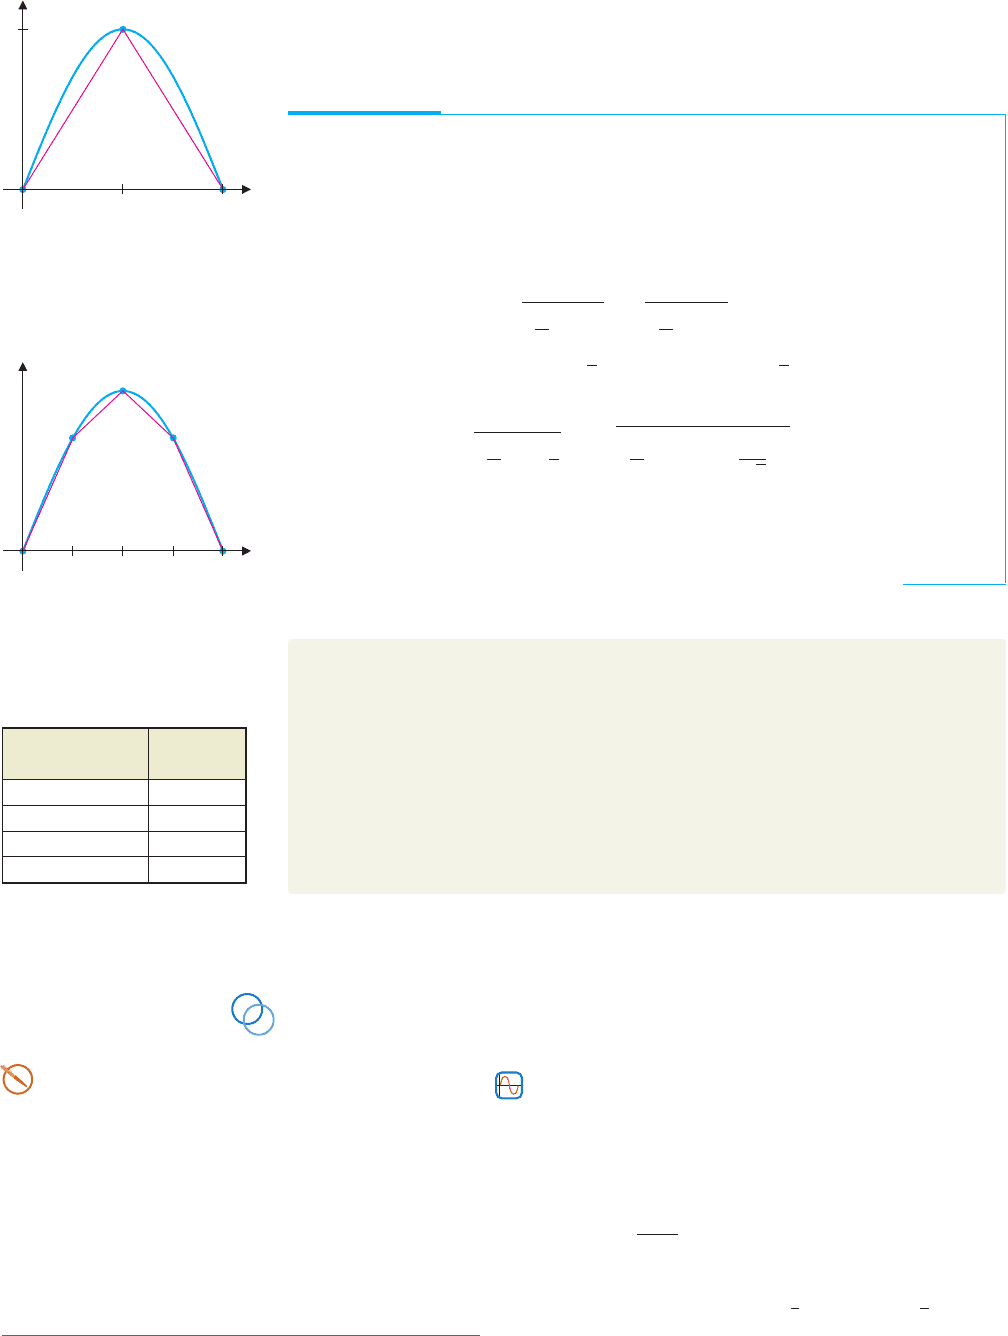
EXAMPLE 1.3 Estimating the Arc Length of a Curve
Estimate the arc length of the curve y = sin x for 0 ≤ x ≤ π. (See Figure 1.6a.)
y
y = sin x
x
1
q
p
FIGURE 1.6a
Approximating the curve with two
line segments
Solution The endpoints of the curve on this interval are (0, 0) and (π , 0). The distance
between these points is d
1
= π. The point on the graph of y = sin x corresponding to
the midpoint of the interval [0, π]is(π/2, 1). The distance from (0, 0) to (π/2, 1) plus
the distance from (π/2, 1) to (π , 0) (illustrated in Figure 1.6a) is
d
2
=
π
2
2
+ 1 +
π
2
2
+ 1 ≈ 3.7242.
Using the five points (0, 0), (π/4, 1/
√
2), (π/2, 1), (3π/4, 1/
√
2) and (π , 0) (i.e., four line
segments, as indicated in Figure 1.6b), the sum of the lengths of these line segments is
d
4
= 2
π
4
2
+
1
2
+ 2
π
4
2
+
1 −
1
√
2
2
≈ 3.7901.
Using nine points (i.e., eight line segments), you need a good calculator and some
patience to compute the distance of approximately 3.8125. A table showing further
approximations is given in the margin. At this stage, it would be reasonable to estimate
the length of the sine curve on the interval [0, π] as slightly more than 3.8.
y
y = sin x
x
qd
p
w
FIGURE 1.6b
Approximating the curve with
four line segments
Number of Sum of
Line Segments Lengths
8 3.8125
16 3.8183
32 3.8197
64 3.8201
BEYOND FORMULAS
In the process of estimating both the slope of a curve and the length of a curve, we
make some reasonably obvious (straight-line) approximations and then systematically
improve on those approximations. In each case, the shorter the line segments are, the
closer the approximations are to the desired value. The essence of this is the concept of
limit, which separates precalculus mathematics from the calculus. At first glance, this
limit idea might seem of little practical importance, since in our examples we never
compute the exact solution. In the chapters to come, we will find remarkably simple
shortcutstoexactanswers.Canyouthinkofwaystofindtheexactslopeinexample1.1?
EXERCISES 1.1
WRITING EXERCISES
1. To estimate the slope of f (x) = x
2
+ 1atx = 1, you
would compute the slopes of various secant lines. Note that
y = x
2
+ 1 curves up. Explain why the secant line connecting
(1, 2) and (1.1, 2.21) will have slope greater than the slope of
the curve at (1, 2). Discuss how the slope of the secant line
between (1, 2) and (0.9, 1.81) compares to the slope of the
curve at (1, 2).
2. Explain why each approximation of arc length in example 1.3
is less than the actual arc length.
In exercises 1–6, estimate the slope (as in example 1.1) of
y f (x)atx a.
1. f (x) = x
2
+ 1, (a) a = 1.5 (b) a = 2
2. f (x) = x
3
+ 2, (a) a = 1 (b) a = 2
3. f (x) = cosx, (a) a = 0 (b) a = π/2
4. f (x) =
√
x + 1, (a) a = 0 (b) a = 3
5. f (x) = tanx, (a) a = 0 (b) a = 1
6. f (x) = cosx, (a) a =
π
4
(b) a =
π
2
............................................................

P1: OSO/OVY P2: OSO/OVY QC: OSO/OVY T1: OSO
MHDQ256-Ch01 MHDQ256-Smith-v1.cls December 6, 2010 20:21
LT (Late Transcendental)
CONFIRMING PAGES
52 CHAPTER 1
..
Limits and Continuity 1-6
In exercises 7–12, estimate the length of the curve y f (x)on
the given interval using (a) n 4 and (b) n 8 line segments.
(c) If you can program a calculator or computer, use larger n’s
and conjecture the actual length of the curve.
7. f (x) = cos x, 0 ≤ x ≤ π/2
8. f (x) = sin x, 0 ≤ x ≤ π/2
9. f (x) =
√
x + 1, 0 ≤ x ≤ 3
10. f (x) = 1/x, 1 ≤ x ≤ 2
11. f (x) = x
2
+ 1, −2 ≤ x ≤ 2
12. f (x) = x
3
+ 2, −1 ≤ x ≤ 1
............................................................
13. Estimate the length of the curve y =
√
1 − x
2
for 0 ≤ x ≤ 1
with (a) n = 4 and (b) n = 8 line segments. Explain why the
exact length is π/2. How accurate are your estimates?
14. Estimate the length of the curve y =
√
9 − x
2
for 0 ≤ x ≤ 3
with (a) n = 4 and (b) n = 8 line segments. Explain why the
exact length is 3π/2. How would an estimate of π obtained
from part (b) of this exercise compare to an estimate of π
obtained from part (b) of exercise 13?
............................................................
Exercises 15–18 discuss the problem of finding the area of a
region.
15. Sketch the parabola y = 1 − x
2
and shade in the region above
the x-axis between x =−1 and x = 1. (a) Sketch in the fol-
lowing rectangles: (1) height f (−
3
4
) and width
1
2
extending
from x =−1tox =−
1
2
. (2) height f (−
1
4
) and width
1
2
ex-
tending from x =−
1
2
to x = 0, (3) height f (
1
4
) and width
1
2
extending from x = 0tox =
1
2
and (4) height f (
3
4
) and width
1
2
extending from x =
1
2
to x = 1. Compute the sum of the
areas of the rectangles. (b) Divide the interval [−1, 1] into 8
pieces and construct a rectangle of the appropriate height on
each subinterval. Compute the sum of the areas of the rectan-
gles. Compared to the approximation in part (a), explain why
youwouldexpectthistobe a betterapproximationof the actual
area under the parabola.
16. Use a computer or calculator to compute an approximation of
thearea in exercise15 using(a) 16 rectangles, (b) 32rectangles
and (c) 64 rectangles. Use these calculations to conjecture the
exact value of the area under the parabola.
17. Use the technique of exercise 15 to estimate the area below
y = sin x and above the x-axis between x = 0 and x = π .
18. Use the technique of exercise 15 to estimate the area below
y = x
3
and above the x-axis between x = 0 and x = 1.
EXPLORATORY EXERCISE
1. In this exercise, you will learn how to directly compute the
slope of a curve at a point. Suppose you want the slope of
y = x
2
at x = 1. You could start by computing slopes of se-
cant lines connecting the point (1, 1) with nearby points on the
graph.Supposethenearbypoint has x-coordinate1 +h,where
h is a small (positive or negative) number. Explain why the
corresponding y-coordinate is (1 + h)
2
. Show that the slope
of the secant line is
(1 + h)
2
− 1
1 + h − 1
= 2 +h.Ash gets closer
and closer to 0, this slope better approximates the slope of the
tangent line. Letting h approach 0, show that the slope of the
tangent line equals 2. In a similar way, show that the slope of
y = x
2
at x = 2 is 4 and find the slope of y = x
2
at x = 3.
Based on your answers, conjecture a formula for the slope of
y = x
2
at x = a, for any unspecified value of a.
1.2 THE CONCEPT OF LIMIT
In this section, we develop the notion of limit using some common language and illustrate
the idea with some simple examples. The notion turns out to be easy to think of intuitively,
but a bit harder to pin down in precise terms. We present the precise definition of limit
in section 1.6. There, we carefully define limits in considerable detail. The more informal
notion of limit that we introduce and work with here and in sections 1.3, 1.4 and 1.5 is
adequate for most purposes.
Suppose that a function f is defined for all x in an open interval containing a, except
possibly at x = a. If we can make f (x) arbitrarily close to some number L (i.e., as close
as we’d like to make it) by making x sufficiently close to a (but not equal to a), then we
say that L is the limit of f (x), as x approaches a, written lim
x→a
f (x) = L. For instance, we
have lim
x→2
x
2
= 4, since as x gets closer and closer to 2, f (x) = x
2
gets closer and closer
to 4. Consider the functions
f (x) =
x
2
− 4
x −2
and g(x) =
x
2
− 5
x −2
.