Stewart J. Calculus
Подождите немного. Документ загружается.

Differentiating this equation implicitly with respect to , we get
and so
M
EXAMPLE 1 Differentiate .
SOLUTION To use the Chain Rule, we let . Then , so
M
In general, if we combine Formula 1 with the Chain Rule as in Example 1, we get
or
EXAMPLE 2 Find .
SOLUTION Using (2), we have
M
EXAMPLE 3 Differentiate .
SOLUTION This time the logarithm is the inner function, so the Chain Rule gives
M
EXAMPLE 4 Find .
SOLUTION 1
SOLUTION 2
If we first simplify the given function using the laws of logarithms, then the
differentiation becomes easier:
!
1
x $ 1
'
1
2
&
1
x ' 2
'
d
dx
ln
x $ 1
s
x ' 2
!
d
dx
[
ln!x $ 1" '
1
2
ln!x ' 2"
]
!
x ' 2 '
1
2
!x $ 1"
!x $ 1"!x ' 2"
!
x ' 5
2!x $ 1"!x ' 2"
!
s
x ' 2
x $ 1
s
x ' 2
% 1 ' !x $ 1"
(
1
2
)
!x ' 2"
'1#2
x ' 2
d
dx
ln
x $ 1
s
x ' 2
!
1
x $ 1
s
x ' 2
d
dx
x $ 1
s
x ' 2
d
dx
ln
x $ 1
s
x ' 2
f )!x" !
1
2
!ln x"
'1#2
d
dx
!ln x" !
1
2
s
ln x
"
1
x
!
1
2x
s
ln x
f !x" !
s
ln x
d
dx
ln!sin x" !
1
sin x
d
dx
!sin x" !
1
sin x
cos x ! cot x
d
dx
ln!sin x"
V
d
dx
$ln t!x"% !
t)!x"
t!x"
d
dx
!ln u" !
1
u
du
dx
2
dy
dx
!
dy
du
du
dx
!
1
u
du
dx
!
1
x
3
$ 1
!3x
2
" !
3x
2
x
3
$ 1
y ! ln uu ! x
3
$ 1
y ! ln!x
3
$ 1"
V
dy
dx
!
1
e
y
!
1
x
e
y
dy
dx
! 1
x
412
|| ||
CHAPTER 7 INVERSE FUNCTIONS
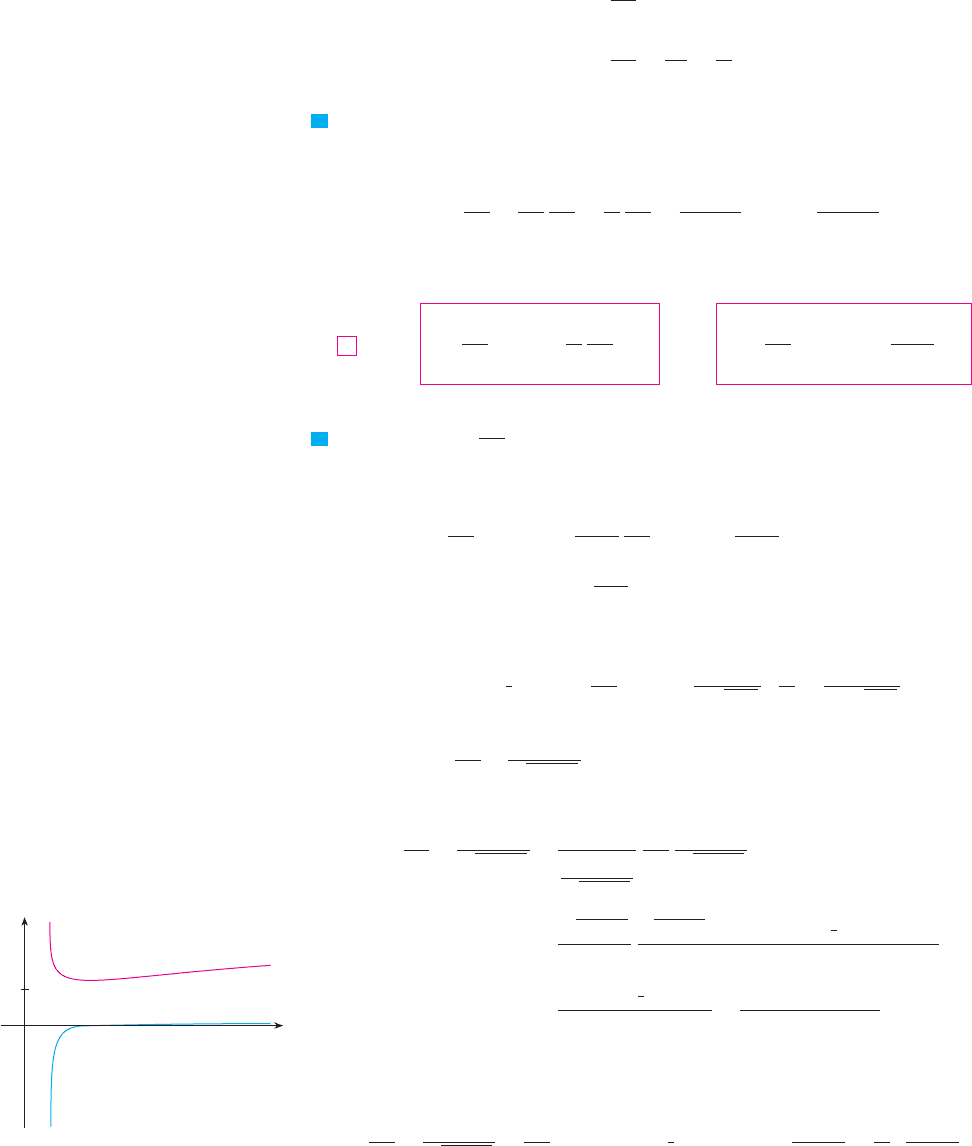
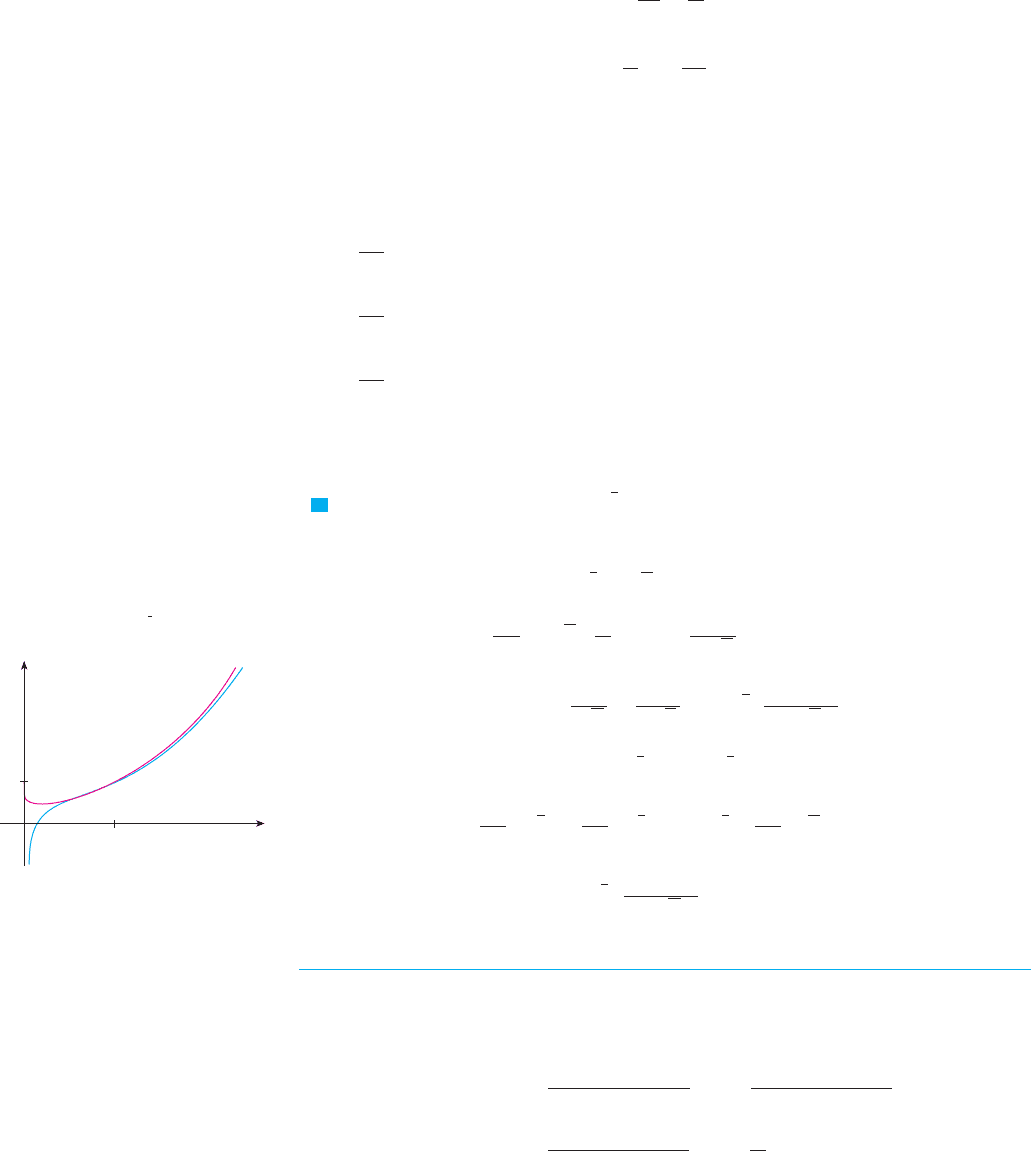
N Figure 1 shows the graph of the function
of Example 4 together with the graph of its deriv-
ative. It gives a visual check on our calculation.
Notice that is large negative when is
rapidly decreasing and when has
a minimum.
ff )!x" ! 0
ff )!x"
f
x
0
y
1
f
fª
F I G U R E 1
(This answer can be left as written, but if we used a common denominator we would see
that it gives the same answer as in Solution 1.) M
EXAMPLE 5 Find the absolute minimum value of .
SOLUTION The domain is and the Product Rule gives
Therefore when , that is, , or . Also,
when and for . So, by the First Derivative Test for
Absolute Extreme Values, is the absolute minimum.
M
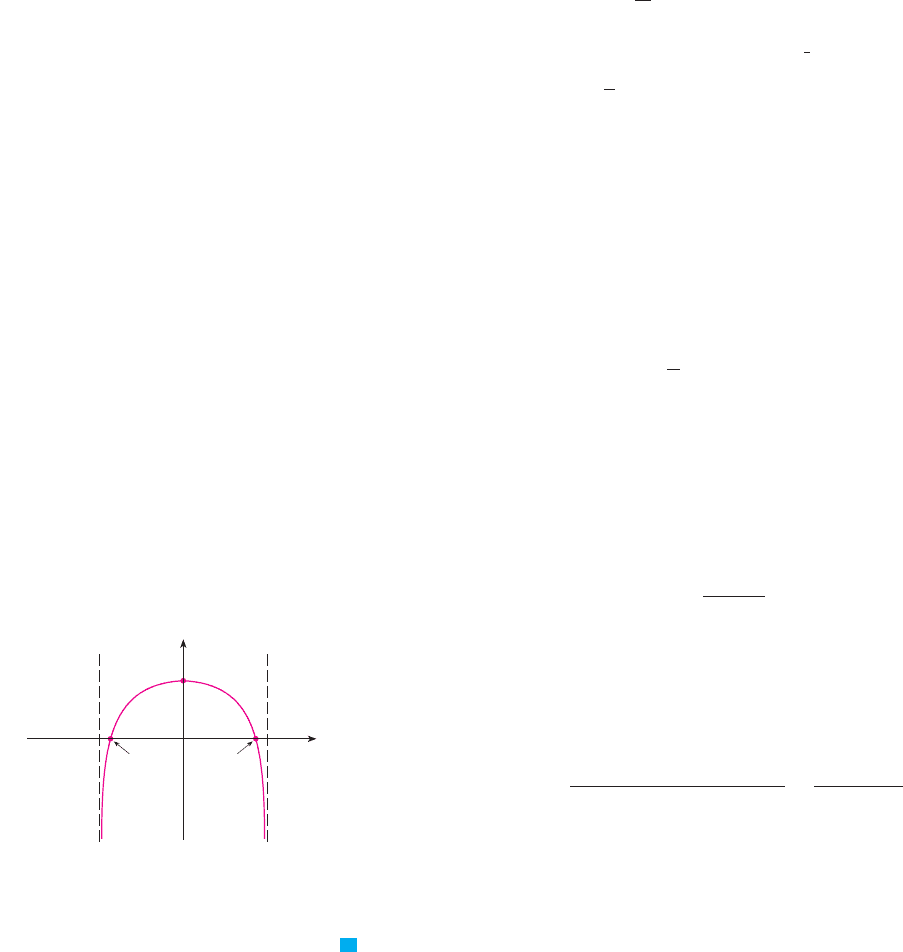
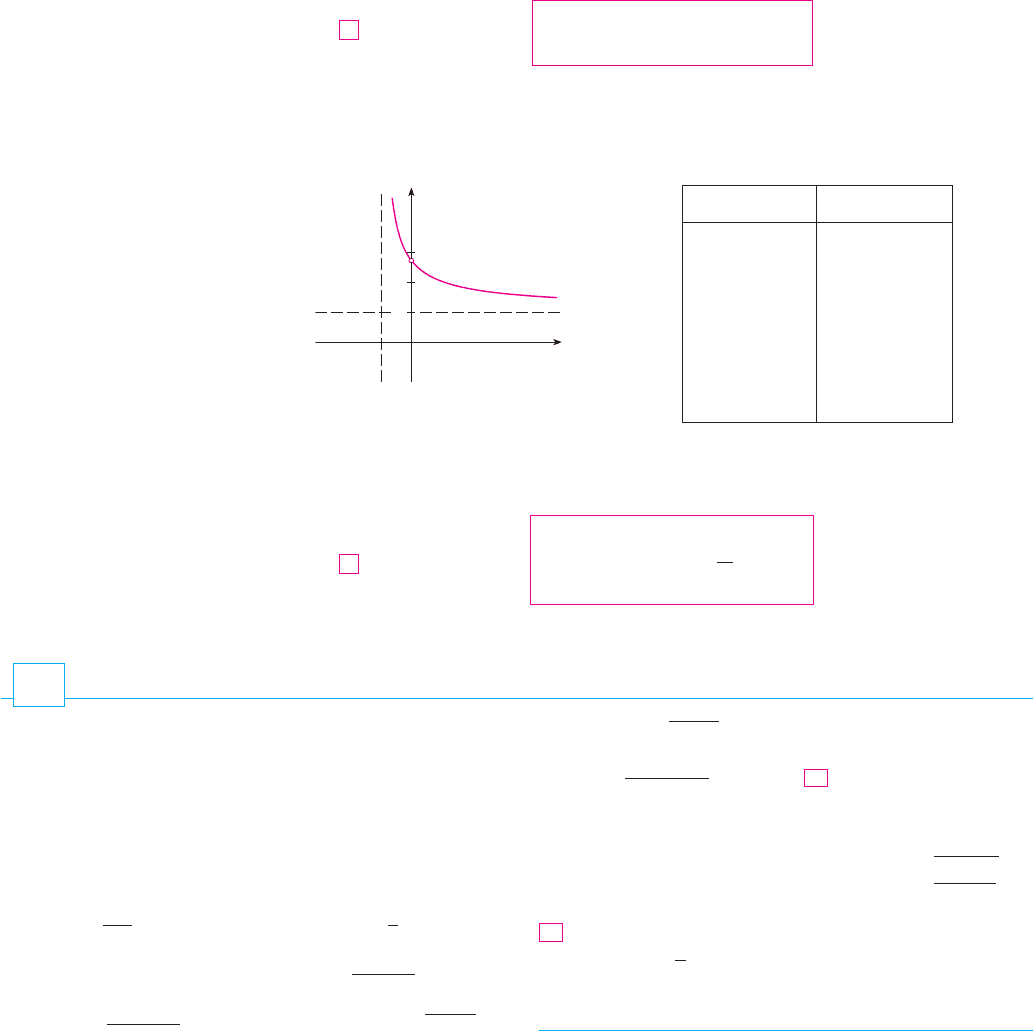
EXAMPLE 6 Discuss the curve using the guidelines of Section 4.5.
SOLUTION
A. The domain is
B. The -intercept is . To find the -intercept we set
We know that (since ), so we have
and therefore the -intercepts are .
C. Since , is even and the curve is symmetric about the -axis.
D. We look for vertical asymptotes at the endpoints of the domain. Since
as and also as , we have
and
by (7.3.8). Thus the lines and are vertical asymptotes.
E.
Since when and when , is increasing
on and decreasing on .
F. The only critical number is . Since changes from positive to negative at ,
is a local maximum by the First Derivative Test.
G.
Since for all , the curve is concave downward on and has no
inflection point.
H. Using this information, we sketch the curve in Figure 2. M
EXAMPLE 7 Find if .
SOLUTION Since
f !x" !
*
ln x
ln!'x"
if x " 0
if x
-
0
f !x" ! ln
)
x
)
f )!x"
V
!'2, 2"x
f *!x"
-
0
f *!x" !
!4 ' x
2
"!'2" $ 2x!'2x"
!4 ' x
2
"
2
!
'8 ' 2x
2
!4 ' x
2
"
2
f !0" ! ln 4
0f )x ! 0
!0, 2"!'2, 0"
f
0
-
x
-
2f )!x"
-
0'2
-
x
-
0
f )!x" " 0
f )!x" !
'2x
4 ' x
2
x ! '2x ! 2
lim
x
l
'2
$
ln!4 ' x
2
" ! '!lim
x
l
2
'
ln!4 ' x
2
" ! '!
x l '2
$
x l 2
'
4 ' x
2
l 0
$
yff !'x" ! f !x"
.
s
3
x
4 ' x
2
! 1 ? x
2
! 3e
0
! 1ln 1 ! log
e
1 ! 0
y ! ln!4 ' x
2
" ! 0
xf !0" ! ln 4y
+x
)
4 ' x
2
" 0, ! +x
)
x
2
-
4, ! +x
)
)
x
)
-
2, ! !'2, 2"
y ! ln!4 ' x
2
"
f
(
1#
s
e
)
! '1#!2e"
0
-
x
-
e
'1#2
f )!x"
-
0x " e
'1#2
f )!x" " 0x ! e
'1#2
ln x ! '
1
2
2 ln x ! '1f )!x" ! 0
f )!x" ! x
2
"
1
x
$ 2x ln x ! x!1 $ 2 ln x"
!0, !"
f !x" ! x
2
ln x
SECTION 7.4 DERIVATIVES OF LOGARITHMIC FUNCTIONS
|| ||
413
{œ„3,0}
{_œ„3,0}
0
y
x
x=2x=_2
(0,ln4)
F I G U R E 2
y
=ln(4 -≈)
it follows that
Thus for all .
M
The result of Example 7 is worth remembering:
The corresponding integration formula is
Notice that this fills the gap in the rule for integrating power functions:
The missing case is supplied by Formula 4.
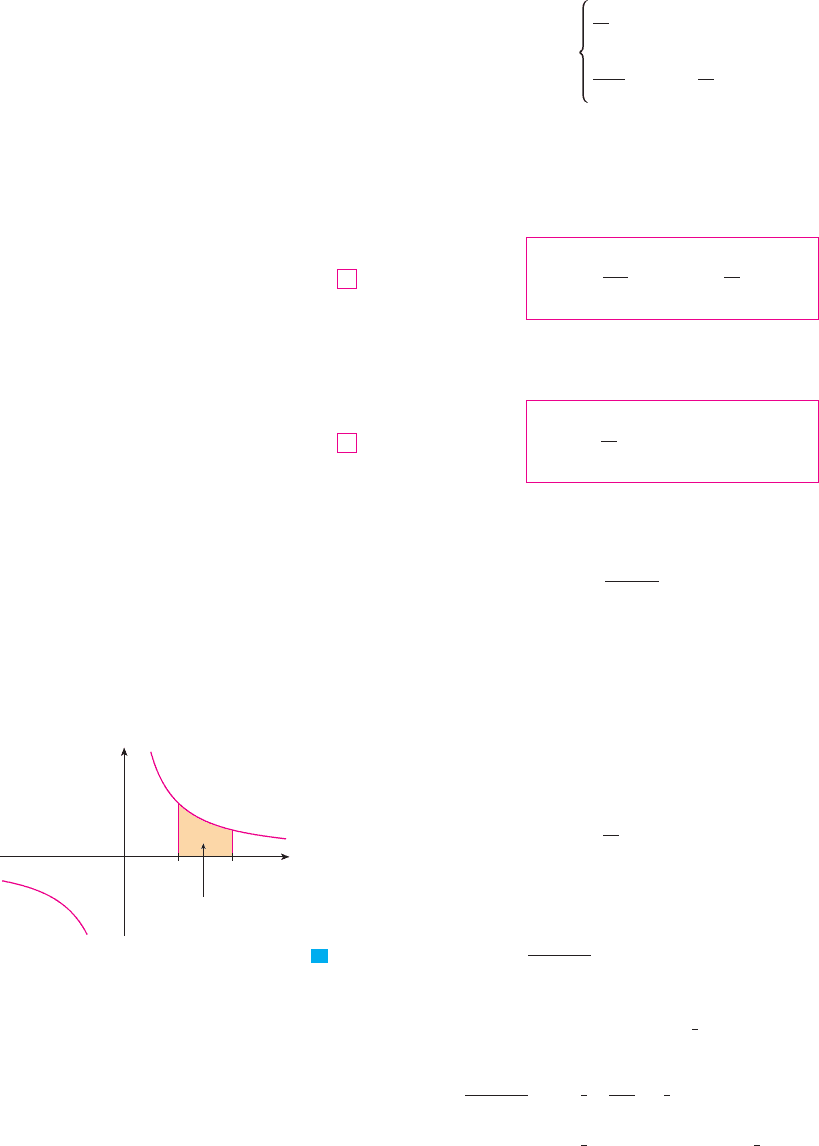
EXAMPLE 8 Find, correct to three decimal places, the area of the region under the
hyperbola from to .
SOLUTION The given region is shown in Figure 3. Using Formula 4 (without the absolute
value sign, since ), we see that the area is
M
EXAMPLE 9 Evaluate .
SOLUTION We make the substitution because the differential occurs
(except for the constant factor 2). Thus and
!
1
2
ln
!
x
2
! 1
!
! C !
1
2
ln"x
2
! 1# ! C
y
x
x
2
! 1
dx !
1
2
y
du
u
!
1
2
ln
!
u
!
! C
x dx !
1
2
du
du ! 2x dxu ! x
2
! 1
y
x
x
2
! 1
dx
V
! ln 2 " ln 1 ! ln 2 $ 0.693
A !
y
2
1
1
x
dx ! ln x
]
1
2
x # 0
x ! 2x ! 1xy ! 1
"n ! "1#
if n " "1
y
x
n
dx !
x
n!1
n ! 1
! C
y
1
x
dx ! ln
!
x
!
! C
4
d
dx
(
ln
!
x
!
)
!
1
x
3
x " 0f $"x# ! 1%x
1
x
if x # 0
1
"x
""1# !
1
x
if x
%
0
f $"x# !
414
|| ||
CHAPTER 7 INVERSE FUNCTIONS
F I G U R E 3
0
y
t
1 2
y=∆
area=ln2
Notice that we removed the absolute value signs because for all . We could
use the properties of logarithms to write the answer as
but this isn’t necessary.
M
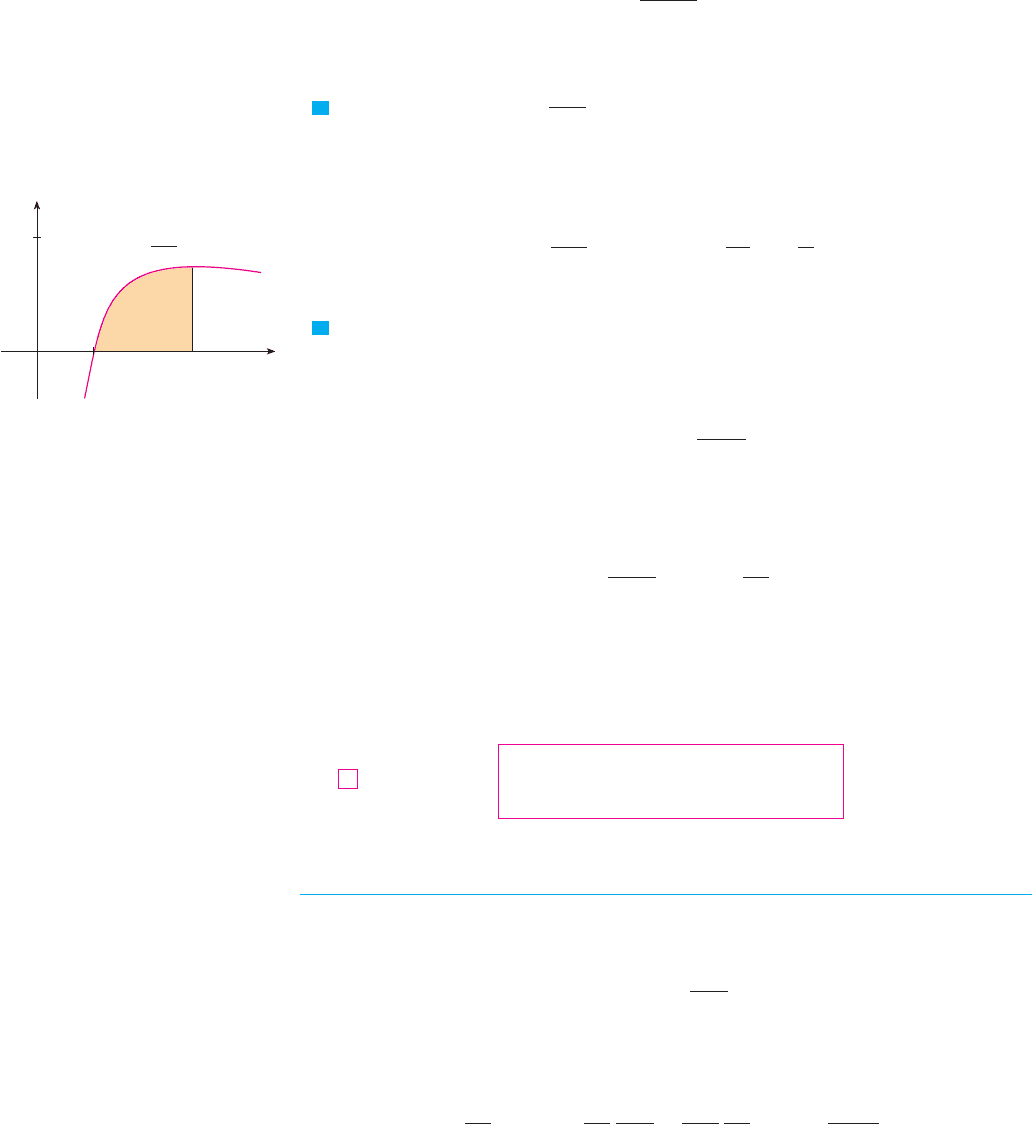
EXAMPLE 10 Calculate .
SOLUTION We let because its differential occurs in the integral. When
, ; when , . Thus
M
EXAMPLE 11 Calculate .
SOLUTION First we write tangent in terms of sine and cosine:
This suggests that we should substitute since then and so
:
M
Since , the result of Example 11 can also be
written as
GENERAL LOGARIT H M I C AN D E X P O NE N T I AL FU N C T I ON S
Formula 7 in Section 7.3 expresses a logarithmic function with base in terms of the nat-
ural logarithmic function:
Since is a constant, we can differentiate as follows:
d
dx
"log
a
x# !
d
dx
ln x
ln a
!
1
ln a
d
dx
"ln x# !
1
x ln a
ln a
log
a
x !
ln x
ln a
a
y
tan x dx ! ln
!
sec x
!
! C
5
"ln
!
cos x
!
! ln"1%
!
cos x
!
# ! ln
!
sec x
!
! "ln
!
u
!
! C ! "ln
!
cos x
!
! C
y
tan x dx !
y
sin x
cos x
dx ! "
y
du
u
sin x dx ! "du
du ! "sin x dxu ! cos x
y
tan x dx !
y
sin x
cos x
dx
y
tan x dx
V
y
e
1
ln x
x
dx !
y
1
0
u du !
u
2
2
&
0
1
!
1
2
u ! ln e ! 1x ! eu ! ln 1 ! 0x ! 1
du ! dx%xu ! ln x
y
e
1
ln x
x
dx
V
ln
s
x
2
! 1 ! C
xx
2
! 1 # 0
SECTION 7.4 DERIVATIVES OF LOGARITHMIC FUNCTIONS
|| ||
415
x
0
y
0.5
1
e
y=
lnx
x
F I G U R E 4
N Since the function in
Example 10 is positive for , the integral
represents the area of the shaded region in
Figure 4.
x # 1
f "x# ! "ln x#%x

EXAMPLE 12 Using Formula 6 and the Chain Rule, we get
M
From Formula 6 we see one of the main reasons that natural logarithms (logarithms
with base ) are used in calculus: The differentiation formula is simplest when
because .
EXPONENTIAL FUNCTIONS WITH BASE In Section 7.2 we showed that the derivative
of the general exponential function , is a constant multiple of itself:
We are now in a position to show that the value of the constant is .
PROOF We use the fact that :
M
In Example 6 in Section 3.7 we considered a population of bacteria cells that doubles
every hour and we saw that the population after hours is , where is the initial
population. Formula 7 enables us to find the growth rate:
EXAMPLE 13 Combining Formula 7 with the Chain Rule, we have
M
The integration formula that follows from Formula 7 is
a " 1
y
a
x
dx !
a
x
ln a
! C
d
dx
(
10
x
2
)
! 10
x
2
"ln 10#
d
dx
"x
2
# ! "2 ln 10#x10
x
2
dn
dt
! n
0
2
t
ln 2
n
0
n ! n
0
2
t
t
! "e
ln a
#
x
"ln a# ! a
x
ln a
d
dx
"a
x
# !
d
dx
"e
ln a
#
x
!
d
dx
e
"ln a#x
! e
"ln a#x
d
dx
"ln a#x
e
ln a
! a
d
dx
"a
x
# ! a
x
ln a
7
f $"0# ! ln a
f $"0# ! lim
h l 0
a
h
" 1
h
wheref $"x# ! f $"0#a
x
f "x# ! a
x
, a # 0
a
ln e ! 1
a ! ee
d
dx
log
10
"2 ! sin x# !
1
"2 ! sin x# ln 10
d
dx
"2 ! sin x# !
cos x
"2 ! sin x# ln 10
d
dx
"log
a
x# !
1
x ln a
6
416
|| ||
CHAPTER 7 INVERSE FUNCTIONS

EXAMPLE 14 M
LOGARITHMI C DIF F E R E NT I ATION
The calculation of derivatives of complicated functions involving products, quotients, or
powers can often be simplified by taking logarithms. The method used in the following
example is called logarithmic differentiation.
EXAMPLE 15 Differentiate .
SOLUTION We take logarithms of both sides of the equation and use the properties of loga-
rithms to simplify:
Differentiating implicitly with respect to gives
Solving for , we get
Because we have an explicit expression for , we can substitute and write
M
STEPS IN LOGARITHMIC DIFFERENTIATION
1.
Take natural logarithms of both sides of an equation and use the
properties of logarithms to simplify.
2. Differentiate implicitly with respect to .
3. Solve the resulting equation for .
If for some values of , then is not defined, but we can write
and use Equation 3. We illustrate this procedure by proving the general ver-
sion of the Power Rule, as promised in Section 3.3.
THE POWER RULE If is any real number and , then
PROOF Let and use logarithmic differentiation:
x " 0ln
!
y
!
! ln
!
x
!
n
! n ln
!
x
!
y ! x
n
f $"x# ! nx
n"1
f "x# ! x
n
n
!
y
!
!
!
f "x#
!
ln f "x#xf "x#
%
0
y$
x
y ! f "x#
dy
dx
!
x
3%4
s
x
2
! 1
"3x ! 2#
5
'
3
4x
!
x
x
2
! 1
"
15
3x ! 2
(
y
dy
dx
! y
'
3
4x
!
x
x
2
! 1
"
15
3x ! 2
(
dy%dx
1
y
dy
dx
!
3
4
!
1
x
!
1
2
!
2x
x
2
! 1
" 5 !
3
3x ! 2
x
ln y !
3
4
ln x !
1
2
ln"x
2
! 1# " 5 ln"3x ! 2#
y !
x
3%4
s
x
2
! 1
"3x ! 2#
5
y
5
0
2
x
dx !
2
x
ln 2
&
0
5
!
2
5
ln 2
"
2
0
ln 2
!
31
ln 2
SECTION 7.4 DERIVATIVES OF LOGARITHMIC FUNCTIONS
|| ||
417
N If we hadn’t used logarithmic differentiation in
Example 15, we would have had to use both the
Quotient Rule and the Product Rule. The resulting
calculation would have been horrendous.
N If , we can show that for
directly from the definition of a derivative.n # 1
f $"0# ! 0x ! 0
Therefore
Hence M
|
You should distinguish carefully between the Power Rule , where
the base is variable and the exponent is constant, and the rule for differentiating exponen-
tial functions , where the base is constant and the exponent is variable.
In general there are four cases for exponents and bases:
1. ( and are constants)
2.
3.
4.
To find , logarithmic differentiation can be used, as in the next
example.
EXAMPLE 16 Differentiate .
SOLUTION 1 Using logarithmic differentiation, we have
SOLUTION 2 Another method is to write :
(as in Solution 1) M
THE NUMBER
e
AS A LIMIT
We have shown that if , then . Thus . We now use this fact
to express the number as a limit.
From the definition of a derivative as a limit, we have
! lim
x l 0
ln"1 ! x#
1%x
! lim
x l 0
ln"1 ! x# " ln 1
x
! lim
x l 0
1
x
ln"1 ! x#
f $"1# ! lim
h l 0
f "1 ! h# " f "1#
h
! lim
x l 0
f "1 ! x# " f "1#
x
e
f $"1# ! 1f $"x# ! 1%xf "x# ! ln x
! x
s
x
'
2 ! ln x
2
s
x
(
d
dx
(
x
s
x
)
!
d
dx
(
e
s
x
ln x
)
! e
s
x
ln x
d
dx
(
s
x
ln x
)
x
s
x
! "e
ln x
#
s
x
y$ ! y
'
1
s
x
!
ln x
2
s
x
(
! x
s
x
'
2 ! ln x
2
s
x
(
y$
y
!
s
x
!
1
x
! "ln x#
1
2
s
x
ln y ! ln x
s
x
!
s
x
ln x
y ! x
s
x
V
"d%dx#) f "x#*
t"x#
d
dx
)a
t"x#
* ! a
t"x#
"ln a#t$"x#
d
dx
) f "x#*
b
! b) f "x#*
b"1
f $"x#
ba
d
dx
"a
b
# ! 0
)"d%dx# a
x
! a
x
ln a*
)"d%dx# x
n
! nx
n"1
*
y$ ! n
y
x
! n
x
n
x
! nx
n"1
y$
y
!
n
x
418
|| ||
CHAPTER 7 INVERSE FUNCTIONS
N Figure 5 illustrates Example 16 by showing
the graphs of and its derivative.f "x# ! x
s
x
F I G U R E 5
1
1
f
fª
x
0
y
Because , we have
Then, by Theorem 2.5.8 and the continuity of the exponential function, we have
Formula 8 is illustrated by the graph of the function in Figure 6 and a
table of values for small values of .
If we put in Formula 8, then as and so an alternative expression
for is
e ! lim
n l &
'
1 !
1
n
(
n
9
e
x l 0
!
n l &n ! 1%x
F I G U R E 6
2
3
y=(1+x)!?®
1
0
y
x
x
y ! "1 ! x#
1%x
e ! lim
x l 0
"1 ! x#
1%x
8
e ! e
1
! e
lim
x
l
0
ln"1!x#
1%x
! lim
x
l
0
e
ln"1!x#
1%x
! lim
x
l
0
"1 ! x#
1%x
lim
x
l
0
ln"1 ! x#
1%x
! 1
f $"1# ! 1
SECTION 7.4 DERIVATIVES OF LOGARITHMIC FUNCTIONS
|| ||
419
x
0.1 2.59374246
0.01 2.70481383
0.001 2.71692393
0.0001 2.71814593
0.00001 2.71826824
0.000001 2.71828047
0.0000001 2.71828169
0.00000001 2.71828181
(1 ! x)
1/x
13. 14.
15.
17. 18.
19. 20.
22.
23. 24.
25. 26.
y ! 2
3
x
2
y ! 5
"1%x
y ! log
2
"e
"x
cos
'
x#y ! 2x log
10
s
x
y ! )ln"1 ! e
x
#*
2
y ! ln"e
"x
! xe
"x
#
21.
H"z# ! ln
+
a
2
" z
2
a
2
! z
2
y ! ln
!
2 " x " 5x
2
!
y ! 10
tan
(
h"t# ! t
3
" 3
t
y ! ln"x
4
sin
2
x#
16.
f "u# !
ln u
1 ! ln"2u#
F"y# ! y ln"1 ! e
y
#t"x# ! ln
(
x
s
x
2
" 1
)
1. Explain why the natural logarithmic function is used
much more frequently in calculus than the other logarithmic
functions .
2–26 Differentiate the function.
2.
3. 4.
5. 6.
7. 8.
9. 10.
11. 12.
h"x# ! ln
(
x !
s
x
2
" 1
)
F"t# ! ln
"2t ! 1#
3
"3t " 1#
4
f "t# !
1 ! ln t
1 " ln t
f "x# ! sin x ln"5x#
f "x# ! ln
s
5
x
f "x# !
s
5
ln x
f "x# ! log
5
"xe
x
#f "x# ! log
2
"1 " 3x#
f "x# ! ln"sin
2
x#f "x# ! sin"ln x#
f "x# ! ln"x
2
! 10#
y ! log
a
x
y ! ln x
E X E R C I S E S
7.4

Find the intervals of concavity and the inflection points of the
function .
60. Find the absolute minimum value of the function
.
61–64 Discuss the curve under the guidelines of Section 4.5.
61. 62.
63. 64.
65. If , use the graphs of , , and to
estimate the intervals of increase and the inflection points of
on the interval .
;
66. Investigate the family of curves . What
happens to the inflection points and asymptotes as changes?
Graph several members of the family to illustrate what you
discover.
;
67. The flash unit on a camera operates by storing charge on a
capacitor and releasing it suddenly when the flash is set off.
The following data describe the charge remaining on the
capacitor (measured in microcoulombs, )C) at time (mea-
sured in seconds).
(a) Use a graphing calculator or computer to find an expo-
nential model for the charge.
(b) The derivative represents the electric current (mea-
sured in microamperes, )A) flowing from the capacitor to
the flash bulb. Use part (a) to estimate the current when
s. Compare with the result of Example 2 in
Section 2.1.
;
68. The table gives the US population from 1790 to 1860.
(a) Use a graphing calculator or computer to fit an exponen-
tial function to the data. Graph the data points and the
exponential model. How good is the fit?
(b) Estimate the rates of population growth in 1800 and 1850
by averaging slopes of secant lines.
(c) Use the exponential model in part (a) to estimate the rates
of growth in 1800 and 1850. Compare these estimates
with the ones in part (b).
t ! 0.04
Q$"t#
t
Q
c
f "x# ! ln"x
2
! c#
"0, 15*f
f *f $ff "x# ! ln"2x ! x sin x#
CAS
y ! ln"x
2
" 3x ! 2#y ! ln"1 ! x
2
#
y ! ln"tan
2
x#y ! ln"sin x#
f "x# ! x ln x
f "x# ! "ln x#%
s
x
59.
27–30 Find and .
27. 28.
29. 30.
31–34 Differentiate and find the domain of .
32.
33. 34.
35. If , find .
36. If , find .
37–38 Find an equation of the tangent line to the curve at the
given point.
37. , 38.
;
39. If , find . Check that your answer is
reasonable by comparing the graphs of and .
;
40. Find equations of the tangent lines to the curve
at the points and . Illustrate by graphing the
curve and its tangent lines.
41–52 Use logarithmic differentiation to find the derivative of the
function.
41. 42.
43. 44.
46.
48.
49. 50.
51. 52.
53. Find if .
Find if .
55. Find a formula for if .
56. Find .
;
57–58 Use a graph to estimate the roots of the equation correct
to one decimal place. Then use these estimates as the initial
approximations in Newton’s method to find the roots correct to
six decimal places.
57. 58.
ln"4 " x
2
# ! x"x " 4#
2
! ln x
d
9
dx
9
"x
8
ln x#
f "x# ! ln"x " 1#f
"n#
"x#
x
y
! y
x
y$
54.
y ! ln"x
2
! y
2
#y$
y ! "ln x#
cos x
y ! "tan x#
1%x
y ! "sin x#
ln x
y ! "cos x#
x
y !
s
x
x
y ! x
sin x
47.
y ! x
cos x
y ! x
x
45.
y !
+
4
x
2
! 1
x
2
" 1
y !
sin
2
x tan
4
x
"x
2
! 1#
2
y !
s
x
e
x
2
"x
2
! 1#
10
y ! "2x ! 1#
5
"x
4
" 3#
6
"e, 1%e#"1, 0#
y ! "ln x#%x
f $f
f $"x#f "x# ! sin x ! ln x
y ! ln"x
3
" 7#, "2, 0#"1, 1#y ! ln
(
xe
x
2
)
f $"0#f "x# ! ln"1 ! e
2x
#
f $"1#f "x# !
ln x
1 ! x
2
f "x# ! ln ln ln xf "x# ! ln"x
2
" 2x#
f "x# !
1
1 ! ln x
f "x# !
x
1 " ln"x " 1#
31.
ff
y ! ln"sec x ! tan x#y ! ln
(
x !
s
1 ! x
2
)
y ! "ln x#%x
2
y ! x
2
ln"2x#
y*y$
420
|| ||
CHAPTER 7 INVERSE FUNCTIONS
t 0.00 0.02 0.04 0.06 0.08 0.10
Q 100.00 81.87 67.03 54.88 44.93 36.76
Year Population Year Population
1790 3,929,000 1830 12,861,000
1800 5,308,000 1840 17,063,000
1810 7,240,000 1850 23,192,000
1820 9,639,000 1860 31,443,000

SECTION 7.2* THE NATURAL LOGARITHMIC FUNCTION
|| ||
421
84. Find the volume of the solid obtained by rotating the region
under the curve
from 0 to 3 about the -axis.
85. The work done by a gas when it expands from volume
to volume is , where is the
pressure as a function of the volume . (See Exercise 27 in
Section 6.4.) Boyle’s Law states that when a quantity of gas
expands at constant temperature, , where is a con-
stant. If the initial volume is 600 and the initial pressure
is 150 kPa, find the work done by the gas when it expands at
constant temperature to 1000 .
86. Find if , , , and .
87. If is the inverse function of , find .
88. If and , find .
89. For what values of do the line and the curve
enclose a region? Find the area of the region.
;
90. (a) Find the linear approximation to near l.
(b) Illustrate part (a) by graphing and its linearization.
(c) For what values of is the linear approximation accurate
to within 0.1?
Use the definition of derivative to prove that
92. Show that for any .x # 0lim
n l &
'
1 !
x
n
(
n
! e
x
lim
x
l
0
ln"1 ! x#
x
! 1
91.
x
f
f "x# ! ln x
y ! x%"x
2
! 1#
y ! mxm
h$"e#h"x# ! f
"1
"x#f "x# ! e
x
! ln x
t$"2#f "x# ! 2x ! ln xt
f "2# ! 0f "1# ! 0x # 0f *"x# ! x
"2
f
cm
3
cm
3
CPV ! C
V
P ! P"V #W !
x
V
2
V
1
P dVV
2
V
1
y
y !
1
x
2
! 1
(d) Use the exponential model to predict the population in
1870. Compare with the actual population of 38,558,000.
Can you explain the discrepancy?
69– 80 Evaluate the integral.
69. 70.
71. 72.
73. 74.
76.
77. 78.
79. 80.
81. Show that by (a) differentiating
the right side of the equation and (b) using the method of
Example 11.
82. Find, correct to three decimal places, the area of the region
above the hyperbola , below the -axis, and
between the lines and .
83. Find the volume of the solid obtained by rotating the region
under the curve
from 0 to 1 about the -axis.x
y !
1
s
x ! 1
x ! "1x ! "4
xy ! 2%"x " 2#
x cot x dx ! ln
!
sin x
!
! C
y
x2
x
2
dx
y
2
1
10
t
dt
y
e
x
e
x
! 1
dx
y
sin 2x
1 ! cos
2
x
dx
y
cos x
2 ! sin x
dx
y
"ln x#
2
x
dx
75.
y
sin"ln x#
x
dx
y
e
1
x
2
! x ! 1
x
dx
y
9
4
'
s
x
!
1
s
x
(
2
dx
y
2
1
dt
8 " 3t
y
2
1
4 ! u
2
u
3
du
y
4
2
3
x
dx
THE NATURAL L OGA RITH MIC FU NCTI ON
In this section we define the natural logarithm as an integral and then show that it obeys
the usual laws of logarithms. The Fundamental Theorem makes it easy to differentiate this
function.
DEFINITION The natural logarithmic function is the function defined by
The existence of this function depends on the fact that the integral of a continuous func-
tion always exists. If , then can be interpreted geometrically as the area under ln xx # 1
x # 0ln x !
y
x
1
1
t
dt
1
7.2*
N If your instructor has assigned Sections
7.2–7.4, you need not read Sections 7.2*, 7.3*,
and 7.4* (pp. 421–446).