Versteeg H., Malalasekra W. An Introduction to Computational Fluid Dynamics: The Finite Volume Method
Подождите немного. Документ загружается.


APPENDIX E 457
div(
ρ
V)dV =−
ρ
u
1
A
1
+
ρ
u
2
A
2
= 0 (E.3)
To develop the one-dimensional mass conservation equation we consider a
control volume with sufficiently small length ∆x so that we can use a one-
term Taylor-series expansion to write expressions for velocity and cross-
sectional area:
u
1
= u and u
2
= u +∆x (E.4a)
A
1
= A and A
2
= A +∆x (E.4b)
Substitution of equations (E.4a) and (E.4b) into (E.3) yields
−
ρ
uA +
ρ
u + ∆xA+∆x = 0 (E.5)
Multiplying out the brackets and neglecting terms of order ∆x
2
, we obtain
ρ
u ∆x +
ρ
A ∆x = 0 (E.6)
Dividing the equation by the control volume length ∆x and combining the
two terms on the left-hand side yields
= 0 (E.7)
The results (E.3) and (E.7) are familiar from introductory fluid mechanics
texts; the former is the usual continuity equation for a macroscopic control
volume and the latter is the differential form.
x-momentum conservation:
+ div(
ρ
uV) =− +div(
µ
grad(u)) + S
u
(2.37a)
For steady, incompressible, frictionless flow this reduces to:
div(
ρ
uV) =− (E.8)
Once more we integrate both sides of the equation over the control volume
and apply Gauss’s theorem to obtain integrals over the bounding surfaces.
For the left-hand side we find:
div(
ρ
uV)dV =
ρ
uV . ndA +
ρ
uV . ndA +
ρ
uV . ndA
=−
ρ
u
2
A +
ρ
u +∆x
2
A +∆x (E.9)
D
E
F
dA
dx
A
B
C
D
E
F
du
dx
A
B
C
∆A
3
A
2
A
1
∆V
∂
p
∂
x
∂
p
∂
x
∂
(
ρ
u)
∂
t
d(
ρ
uA)
dx
du
dx
dA
dx
D
E
F
dA
dx
A
B
C
D
E
F
du
dx
A
B
C
dA
dx
du
dx
∆V
ANIN_Z05.qxd 29/12/2006 10:08 AM Page 457

458 APPENDIX E
Using (E.5) this can be rewritten as follows:
−
ρ
u
2
A +
ρ
u +∆x
2
A +∆x
=
ρ
uA −u + u +∆x =
ρ
uA ∆x (E.10)
The control volume integral of the right-hand side of equation (E.8) and
subsequent application of Gauss’s divergence theorem (2.41) yields:
− dV =− pi . ndA − pi . ndA − pi . ndA
= pA − p +∆xA+∆x − p + k ∆x −∆x (E.11)
The factor k(0 < k < 1) in the last term accounts for the fact that the
pressure on side wall area ∆A
3
takes a value between p on inlet area A
1
and
p + (dp/dx)∆x on outlet area A
2
. Moreover, the x-component of the force
due to this pressure applies in the negative x-direction and has a magnitude
that is equal to the product of this intermediate pressure p + k(dp/dx)∆x
and the projection of side wall area ∆A
3
into the x-direction, which is
A
1
− A
2
=−(dA/dx)∆x. Multiplying out the brackets of (E.11) and neglect-
ing terms of order ∆x
2
, we obtain
pA − p +∆xA+∆x + p + k ∆x ∆x
=−A ∆x (E.12)
We place equation (E.10) on the left-hand side of the integrated x-momentum
equation and equation (E.12) on the right-hand side:
ρ
uA ∆x =−A ∆x (E.13)
Dividing the result by ∆x yields the one-dimensional momentum equation
for frictionless flow:
ρ
uA =−A (E.14)
dp
dx
du
dx
dp
dx
du
dx
dp
dx
D
E
F
dA
dx
A
B
C
D
E
F
dp
dx
A
B
C
D
E
F
dA
dx
A
B
C
D
E
F
dp
dx
A
B
C
D
E
F
dA
dx
A
B
C
D
E
F
dp
dx
A
B
C
D
E
F
dA
dx
A
B
C
D
E
F
dp
dx
A
B
C
∆A
3
A
2
A
1
∂
p
∂
x
∆V
du
∂
x
D
E
F
du
dx
A
B
C
D
E
F
dA
dx
A
B
C
D
E
F
du
dx
A
B
C
ANIN_Z05.qxd 29/12/2006 10:08 AM Page 458

As shown in Figures 11.15 and 16 (Chapter 11), using co-ordinates
ξ
along
the line joining P and A, and
η
along the face of the control volume (i.e.
along line joining points a and b), the term grad
φ
can be written with respect
to x, y co-ordinates or n,
η
co-ordinates as
grad
φ
= i + j = n + e
η
(F.1)
where n and e
η
are unit vectors along normal and tangential directions:
grad
φ
. n A
i
= i + j . nA
i
= . − . A
i
(F.2)
Using the chain rule we have
=+ (F.3)
=+ (F.4)
It is usual practice to write
∂φ
/
∂ξ
=
φ
ξ
,
∂φ
/
∂
x =
φ
x
,
∂φ
/
∂η
=
φ
η
etc.
Equations (F.3) and (F.4) can be rewritten as
φ
ξ
=
φ
x
x
ξ
+
φ
y
y
ξ
(F.5)
φ
η
=
φ
x
x
η
+
φ
y
y
η
(F.6)
Equations (F.5) and (F.6) can be solved to obtain
φ
x
and
φ
y
. The solution is
φ
x
= (
φ
ξ
y
η
−
φ
η
y
ξ
) =− (F.7)
φ
y
= (−
φ
ξ
x
η
+
φ
η
x
ξ
) =− + (F.8)
where J is the Jacobian given by
J = (x
ξ
y
η
− x
η
y
ξ
) =− (F.9)
D
E
F
∂
y
∂ξ
∂
x
∂η
∂
y
∂η
∂
x
∂ξ
A
B
C
D
E
F
∂
x
∂ξ
∂φ
∂η
∂
x
∂η
∂φ
∂ξ
A
B
C
1
J
1
J
D
E
F
∂
y
∂ξ
∂φ
∂η
∂
y
∂η
∂φ
∂ξ
A
B
C
1
J
1
J
∂
y
∂η
∂φ
∂
y
∂
x
∂η
∂φ
∂
x
∂φ
∂η
∂
y
∂ξ
∂φ
∂
y
∂
x
∂ξ
∂φ
∂
x
∂φ
∂ξ
D
E
F
∆x
A
i
∂φ
∂
y
∆y
A
i
∂φ
∂
x
A
B
C
D
E
F
∂φ
∂
y
∂φ
∂
x
A
B
C
∂φ
∂η
∂φ
∂
n
∂φ
∂
y
∂φ
∂
x
Appendix F Alternative derivation for the
term (n . grad
φφ
A
i
) in Chapter 11
ANIN_Z06.qxd 29/12/2006 10:09 AM Page 459

In equations (F.7) and (F.8)
∂φ
/
∂ξ
is the gradient of
φ
along the line joining
P and A, and
∂φ
/
∂η
is the gradient of
φ
along the line joining a and b (the
face). Other terms like
∂
x/
∂ξ
,
∂
y/
∂ξ
,
∂
x/
∂η
and
∂
y/
∂η
are simple geo-
metrical quantities. Expressions for those are given below.
By substituting (F.7) and (F.8) into (F.2) we have
grad
φ
. n A
f
= . − . A
i
=−∆y −− + ∆x
=∆y +∆x −∆y +∆x (F.10)
The two flux gradients involved in this expression may be calculated from
= and =
where ∆
ξ
= d
PA
is the distance between points A and P and ∆
η
= d
ab
is the
distance between vertices a and b (or in this case equal to A
i
). The first term
involving
∂φ
/
∂ξ
is called the direct gradient and the second term involving
∂φ
/
∂η
is called the cross-diffusion term.
The other geometrical quantities in equation (F.10) may be obtained from
==
==
Using Mathur and Murthy’s (1997; see the references in Chapter 11)
approach, expression (F.9) can be written using normal unit vector n and
two other unit vectors e
ξ
and e
η
in the directions of
ξ
and
η
respectively.
Recall that
n = i − j = i − j (F.11)
The unit vector along the
ξ
-direction may be defined as
e
ξ
= i + j (F.12)
The unit vector along the
η
-direction may be defined as
e
η
= i + j (F.13)
y
b
− y
a
∆
η
x
b
− x
a
∆
η
y
A
− y
P
∆
ξ
x
A
− x
P
∆
ξ
x
b
− x
a
∆
η
y
b
− y
a
∆
η
∆x
A
f
∆y
A
f
y
b
− y
a
∆
η
∂
y
∂η
x
b
− x
a
∆
η
∂
x
∂η
y
A
− y
P
∆
ξ
∂
y
∂ξ
x
A
− x
P
∆
ξ
∂
x
∂ξ
φ
b
−
φ
a
∆
η
∂φ
∂η
φ
A
−
φ
P
∆
ξ
∂φ
∂ξ
J
K
L
∂φ
∂η
D
E
F
∂
x
∂ξ
∂
y
∂ξ
A
B
C
∂φ
∂ξ
D
E
F
∂
x
∂η
∂
y
∂η
A
B
C
G
H
I
1
J
J
K
L
D
E
F
∂
x
∂ξ
∂φ
∂η
∂
x
∂η
∂φ
∂ξ
A
B
C
D
E
F
∂
y
∂ξ
∂φ
∂η
∂
y
∂η
∂φ
∂ξ
A
B
C
G
H
I
1
J
D
E
F
∆x
A
f
∂φ
∂
y
∆y
A
f
∂φ
∂
x
A
B
C
460 APPENDIX F
ANIN_Z06.qxd 29/12/2006 10:09 AM Page 460

APPENDIX F 461
The Jacobian in the expanded form is
J =−
=−
J = n . e
ξ
(F.14)
Using the above simplification for J the first term of equation (F.10) may be
written as
∆y +∆x = ( y
b
− y
a
)
+ (x
b
− x
a
)
= [n . nA
i
]
= A
i
(F.15)
Similarly the cross-diffusion term of equation (F.10) may be written as
−∆y +∆x =− ( y
b
− y
a
)
+ (x
b
− x
a
)
=− [e
ξ
. e
η
∆
η
]
=− (F.16)
The complete diffusion contribution in vector form is
n . grad
φ
A
f
=− (F.17)
∂φ
∂η
e
ξ
. e
η
A
i
n . e
ξ
∂φ
∂ξ
n . nA
i
n . e
ξ
∂φ
∂η
e
ξ
. e
η
A
i
n . e
ξ
∂φ
∂η
1
n . e
ξ
∂φ
∂η
J
K
L
(x
A
− x
P
)
∆
ξ
( y
A
− y
P
)
∆
ξ
G
H
I
1
n . e
ξ
∂φ
∂ξ
J
K
L
D
E
F
∂
x
∂ξ
∂
y
∂ξ
A
B
C
G
H
I
1
J
∂φ
∂ξ
n . n
n . e
ξ
∂φ
∂ξ
1
n . e
ξ
∂φ
∂ξ
J
K
L
(x
b
− x
a
)
∆
η
( y
b
− y
a
)
∆
η
G
H
I
1
n . e
ξ
∂φ
∂ξ
J
K
L
D
E
F
∂
x
∂η
∂
y
∂η
A
B
C
G
H
I
1
J
D
E
F
(y
A
− y
P
)
∆
ξ
(x
b
− x
a
)
∆
η
(y
b
− y
a
)
∆
η
(x
A
− x
P
)
∆
ξ
A
B
C
D
E
F
∂
y
∂ξ
∂
x
∂η
∂
y
∂η
∂
x
∂ξ
A
B
C
ANIN_Z06.qxd 29/12/2006 10:09 AM Page 461
G.1 Some applications
In this appendix we give three examples of simple CFD applications. An
interested reader with access to commercial or any other CFD software
could repeat these exercises to gain some hands-on experience. The bound-
ary conditions and problem specification are briefly described and specimen
results are presented to illustrate how CFD and modelling of combustion can
be applied to practical situations. The examples are presented without finer
details of the calculations, which can be found in the cited references.
G.2 Flow in a sudden pipe contraction
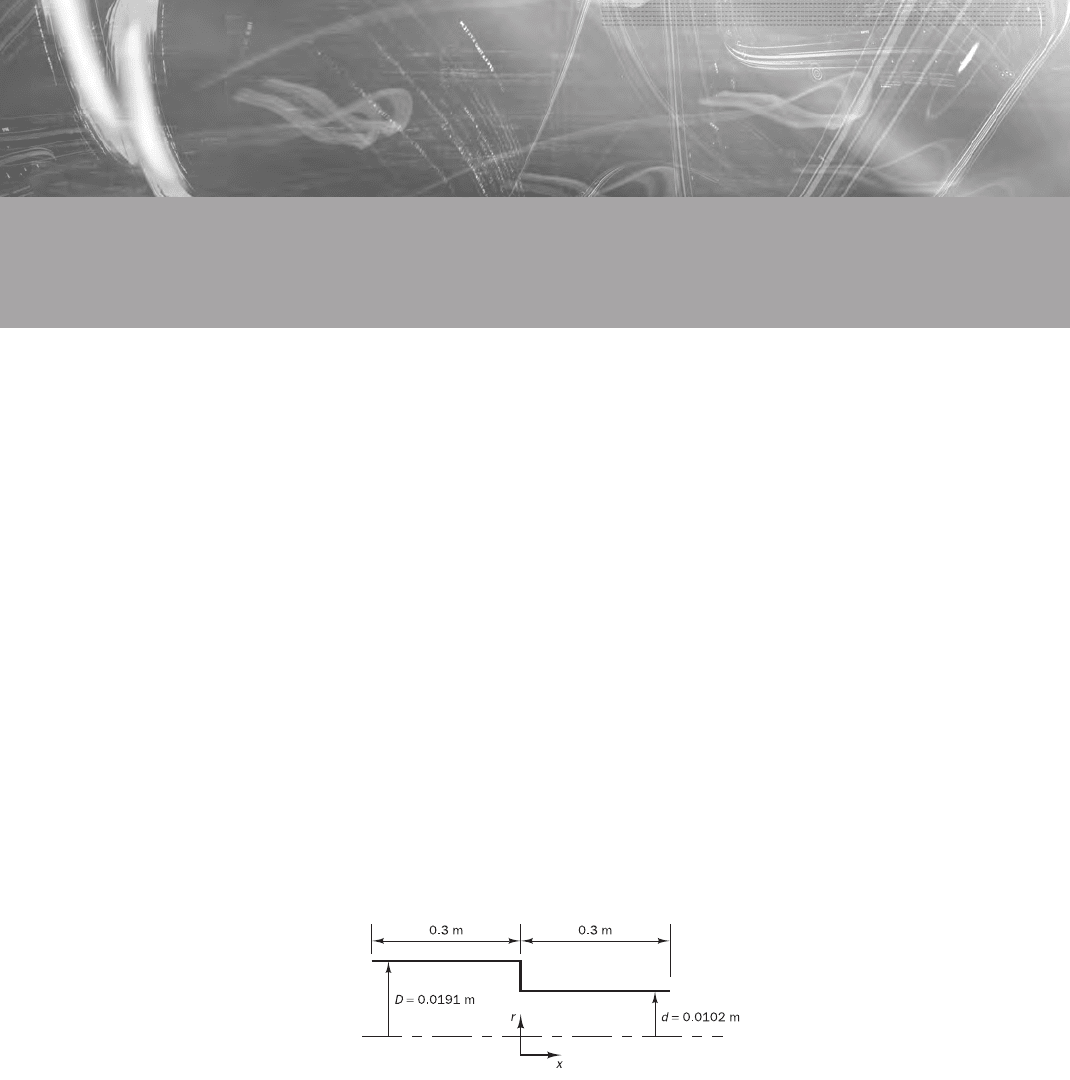
The problem considered
This problem was selected to illustrate the application of CFD to a bench-
mark problem with a set of well-documented data for the comparison of pre-
dictions with experiments. The problem considered here is laminar pipe flow
in a sudden contraction shown in Figure G.1. Durst and Loy (1985) have
provided the experimental data for a range of Reynolds numbers. The flow
with a Reynolds number (Re =
ρ
UD/
µ
) of 372 was considered for CFD
modelling, where U is the average velocity in the pipe with diameter D.
Appendix G Some examples
Figure G.1 Experimental
configuration of Durst and
Loy (1985)
CFD simulation
The geometry was modelled with a two-dimensional axisymmetric grid of
100 × 60. The velocity profile for fully developed laminar flow was imposed
at the inlet, and the no-slip condition was applied at wall boundaries. At the
exit plane, all derivatives in the axial direction were set to zero. The CFD
calculation was carried out using the SIMPLER algorithm and the hybrid
differencing scheme.
ANIN_Z07.qxd 29/12/2006 04:50PM Page 462
APPENDIX G 463
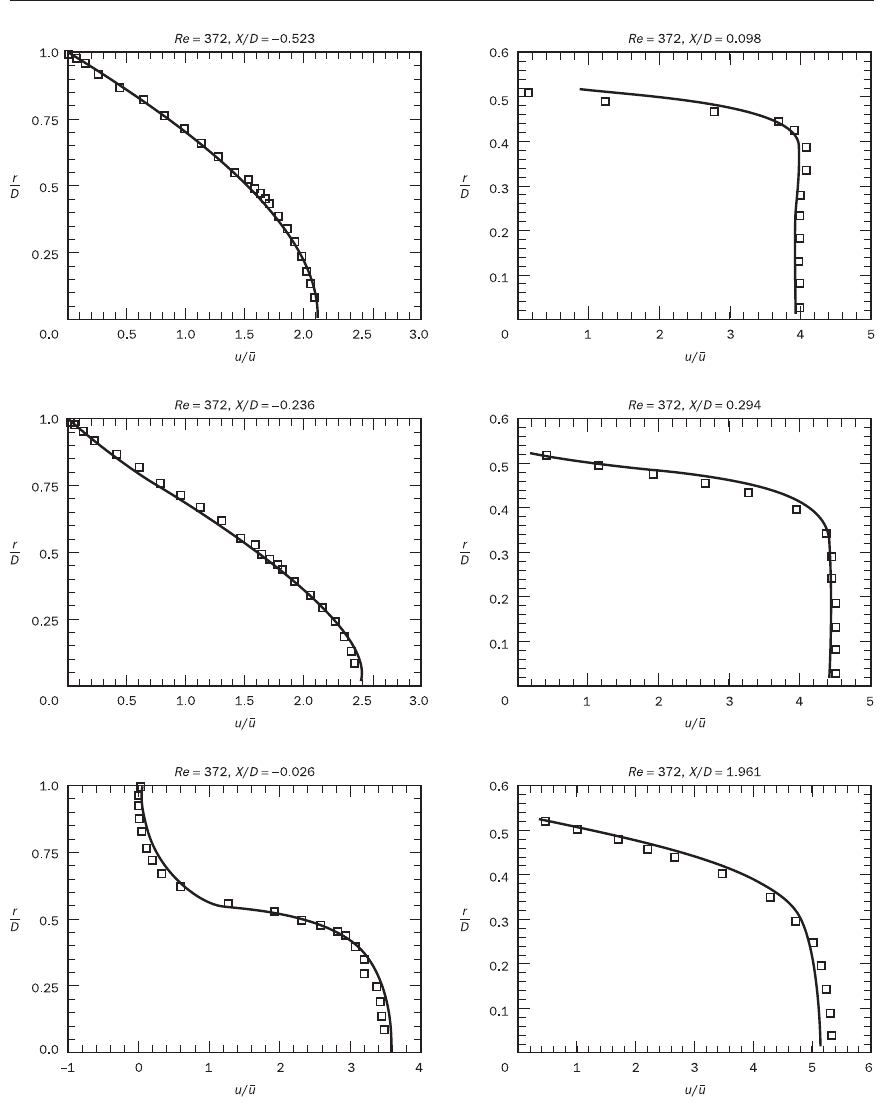
Specimen results
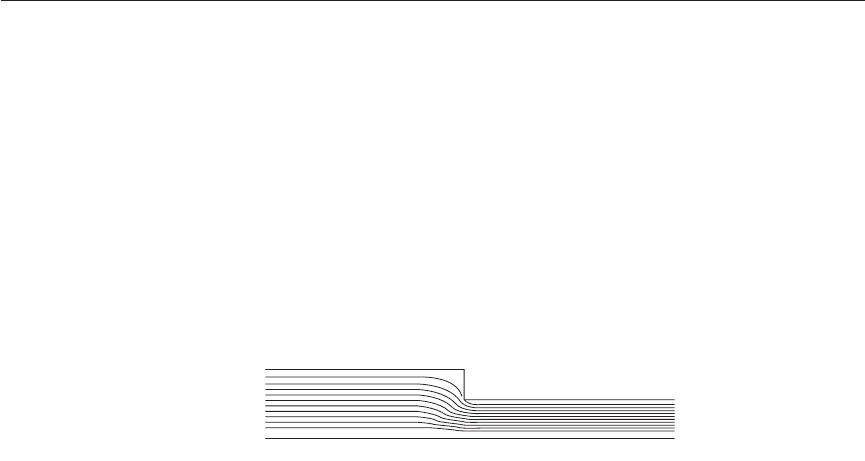
Since the flow is laminar, the governing equations are exact (i.e. no turbu-
lence modelling involved here). The predicted streamlines of the flow are
shown in Figure G.2. The velocity profiles are shown in Figure G.3 for six
different cross-sections of the domain: three before, and three after, the con-
traction. The experimental data of Durst and Loy (1985) are also included
for comparison. It can be seen that the predictions agree well with the experi-
mental measurements. Further grid refinement did not cause significant
changes in the predictions, and therefore these results can be considered to
be grid independent. It should be noted that comparisons for locations other
than those shown in the figure and for other Reynolds numbers also agree
well with the experimental data. This simple example shows the capability of
CFD to predict practical flow situations, with a good degree of accuracy.
Figure G.2 Predicted streamline
pattern
G.3 Modelling of a fire in a test room
The problem considered
In contrast to the previous benchmark problem we now study a case at the
other end of the spectrum of complexity. We compare CFD calculations
with experimental fire tests carried out by the Lawrence Livermore National
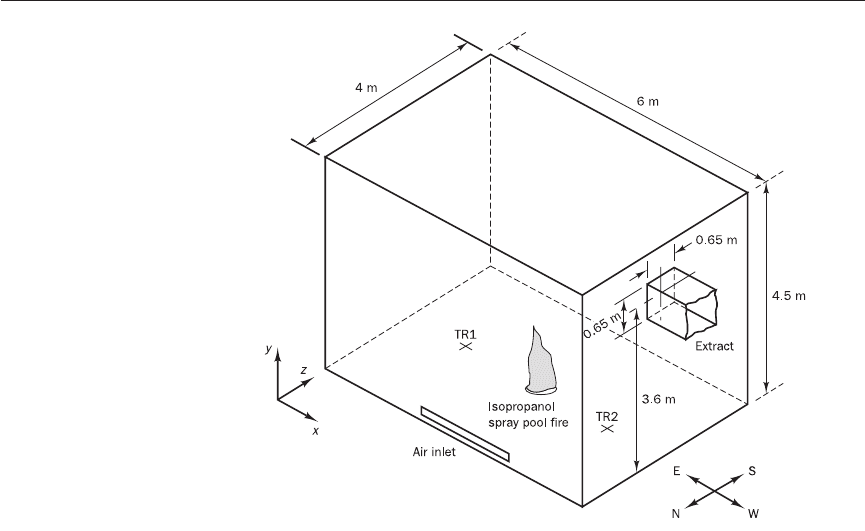
Laboratory (LLNL) in the test room shown in Figure G.4. The details of the
experiments have been reported in Alvarez et al. (1984). The fire was at the
centre of the floor and clean air was introduced along the floor of the test cell,
which is approximated in the model by a 0.12 m high and 2 m long slot for
air entry, located 0.1 m above the floor. The fire sources in the experiments
were a burner, a spray and a pool of fuel in a tray. The products of combus-
tion were extracted near the top of the cell using an axial flow fan through a
rectangular 0.65 m square duct placed 3.6 m above the floor, as shown in
Figure G.4. A total of 27 tests were reported by Alvarez et al. (1984), and the
one designated MOD08 has been selected for CFD modelling here. In this
test, a spray of isopropyl alcohol from an opposed-jet nozzle located at the
centre of the pan was used, and the fuel evaporated quickly to burn in a way
similar to a natural pool fire. The fuel injection rate was 13.1 g/s with a
total heat release rate of 400 kW. These data were used to specify burner
conditions at the fire source. The measured extraction rate, 400 l/s in the
steady state, was used to specify the outflow. The mass flow rate of air into
the domain and the inlet and outlet velocities are calculated as part of the
solution. The walls, the floor and the ceiling of the compartment were of
0.1 m thick refractory. The estimated thermal conductivity, density and
specific heat were, respectively, 0.39 W/m.K, 1400 kg/m
3
and 1 kJ/kg.K
for the walls and 0.63 W/m.K, 1920 kg/m
3
and 1 kJ/kg.K for the ceiling
and the floor. The walls were assumed to be perfectly black for radiation
calculations.
ANIN_Z07.qxd 29/12/2006 04:50PM Page 463
464 APPENDIX G
Figure G.3 Comparison of predictions and experimental results at six different locations
ANIN_Z07.qxd 29/12/2006 04:50PM Page 464
APPENDIX G 465
CFD simulation
The simulation of the aerodynamics and combustion was carried out using
a three-dimensional CFD procedure based on the SIMPLE algorithm and
the hybrid differencing scheme for discretisation. Turbulence was modelled
with the k–
ε
turbulence model with buoyancy terms, and combustion
modelling assumed fast chemistry (SCRS). The discrete transfer model
of thermal radiation (Lockwood and Shah, 1981) was used to calculate
radiative heat transfer. The wall temperatures were obtained from a one-
dimensional wall heat transfer model. A numerical grid of 14 × 13 × 12,
although not very fine, was considered adequate to predict the overall prop-
erties of the fire. Further details of the model can be found in Malalasekera
(1988) and Lockwood and Malalasekera (1988). Some specimen results are
presented below.
Specimen results
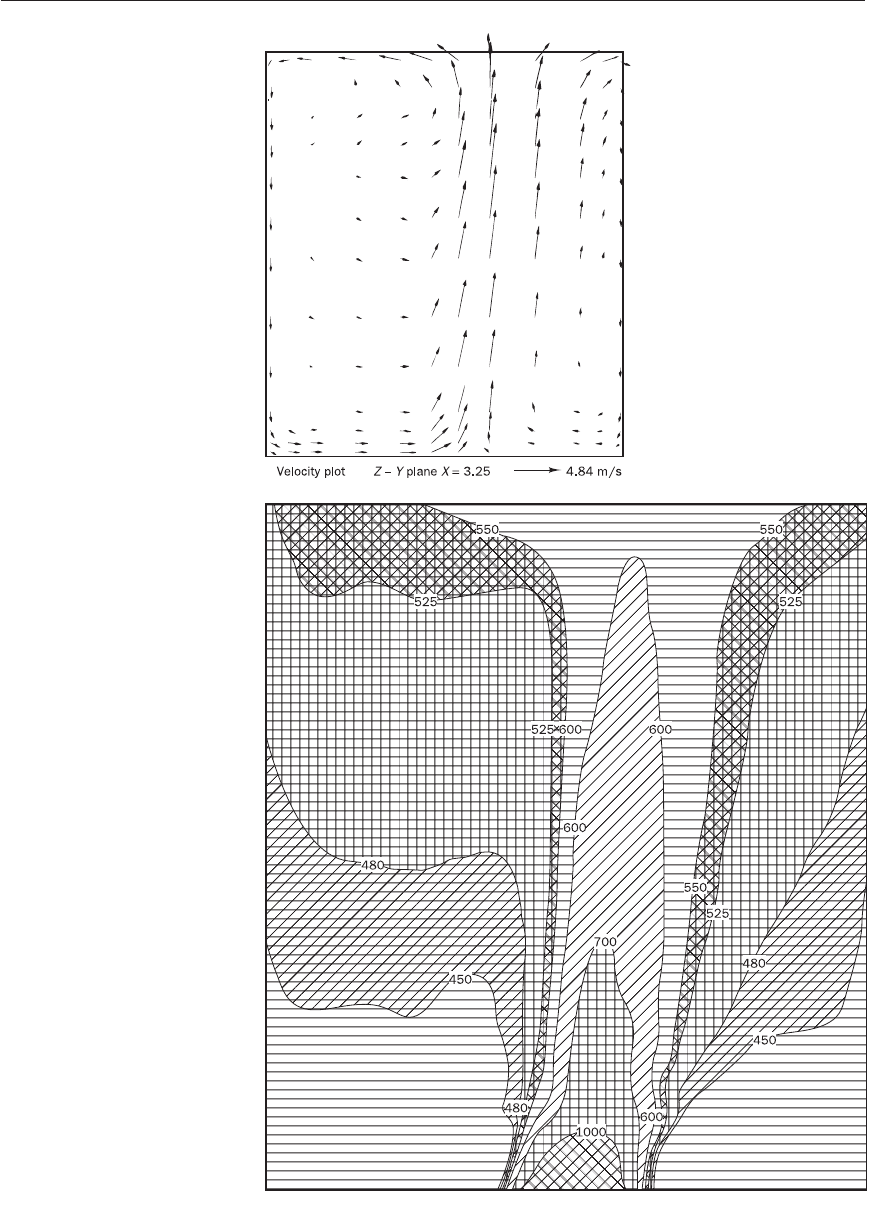
Figure G.5 shows the predicted steady state flow pattern in the Y–Z plane at
X = 3.25 m. The buoyancy-generated flow is clearly reproduced by the simu-
lation, which also shows the entrainment induced by the strong buoyancy
effects. The predicted temperature distribution in the Y–Z plane at X = 3.00 m
(Figure G.6) shows the hot gases around the central flame and the forma-
tion of a hot layer at ceiling level. The flame structure and tilt due to induced
air flow are also clearly visible. Figure G.7 compares the room temperature
predictions with the experimental data of Alvarez et al. (1984). The experi-
mental temperatures were recorded using two thermocouple rakes (TR1,
east rake; and TR2, west rake) with 15 thermocouples each placed 1.5 m on
either side of the fire and located in the central plane as shown in Figure G.4.
Figure G.4 Schematic diagram
of the Lawrence Livermore
National Laboratory (LLNL)
fire test cell
ANIN_Z07.qxd 29/12/2006 04:50PM Page 465
466 APPENDIX G
Figure G.5 Predicted fiow inside
the compartment: velocity vector
plots in the Z–Y plane at
X = 3.25 m
Figure G.6 Predicted
temperature (K) field in the
Y–Z plane at X = 3.00 m
ANIN_Z07.qxd 29/12/2006 04:50PM Page 466